A free application "App De statistics" that allows you to see various government statistical data
The Statistics Bureau of the Ministry of Internal Affairs and Communications conducts planning and implementation of important statistical surveys of the country including the census and the variousPublish statistical datadoing. The statistical data from such a statistical office is "developed so that more people can utilize" the application is "App De statistics"is.
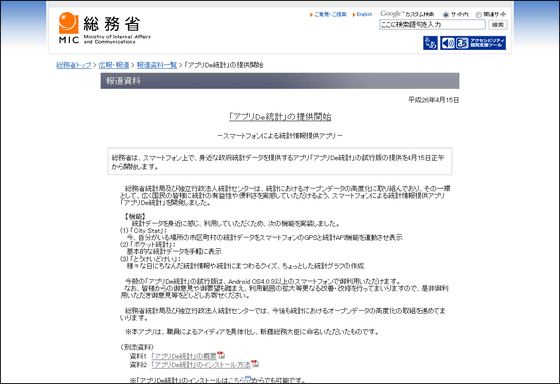
Ministry of Internal Affairs and Communications launched "Application De statistics"
http://www.soumu.go.jp/menu_news/s-news/01toukei01_02000031.html
Application installation is possible from the following page.
App De statistics - Android application on Google Play
https://play.google.com/store/apps/details?id=jp.go.stat.statapi001
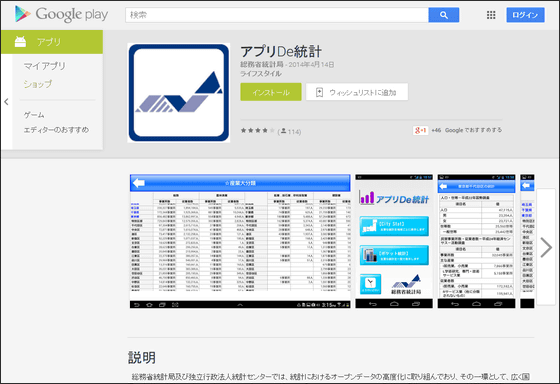
"Application De statistics" delivered on Google Play is a free application.

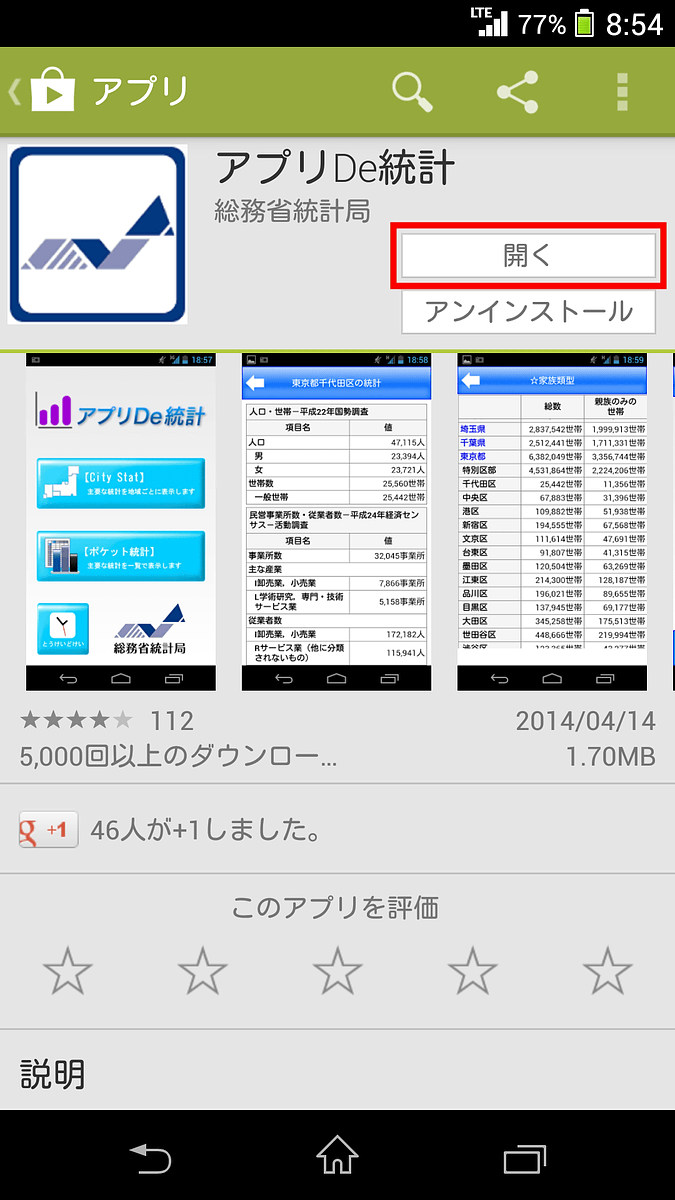
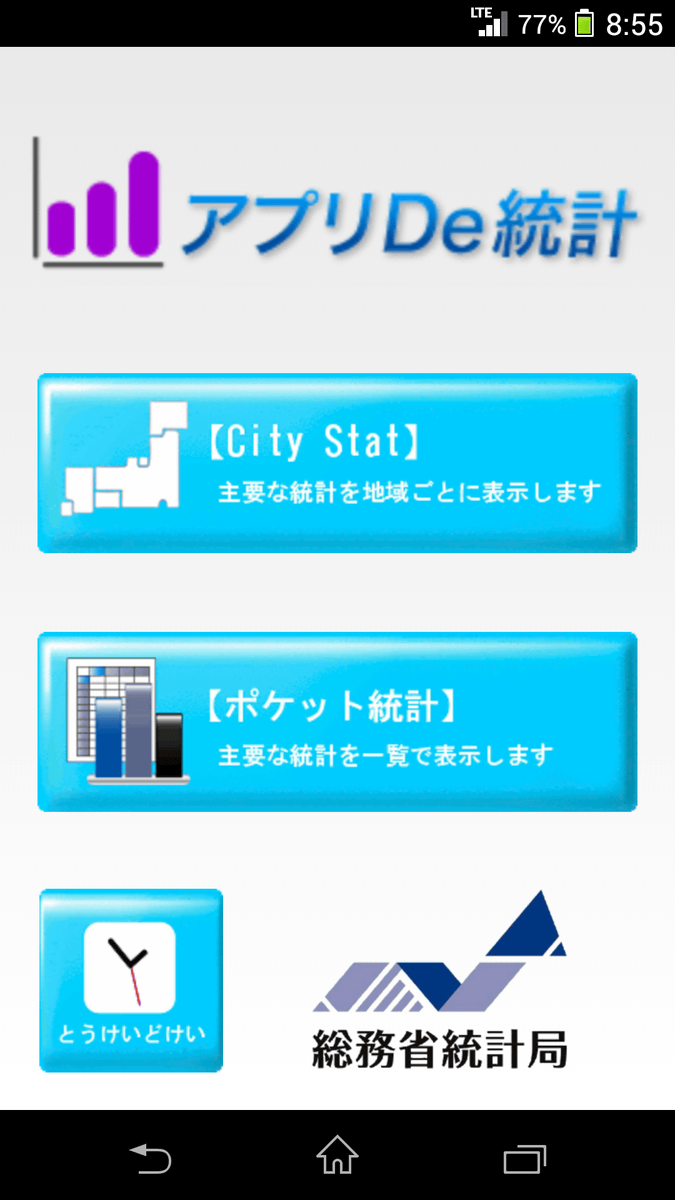
When installation is completed, tap "Open" to launch the application.
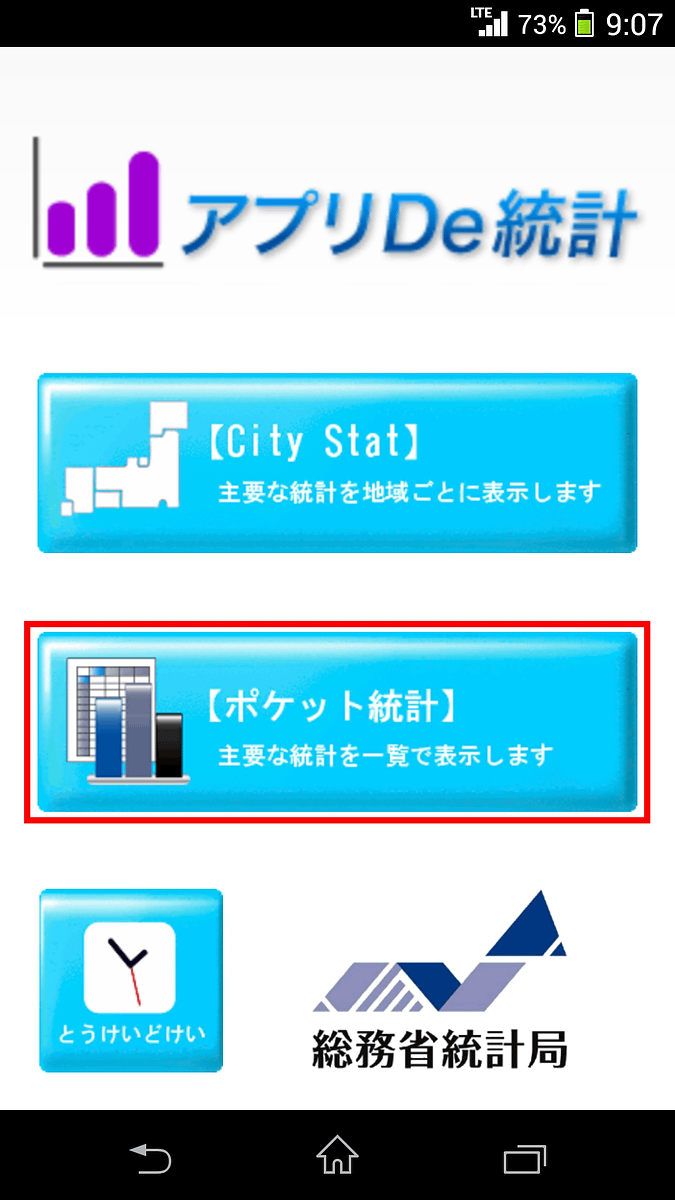
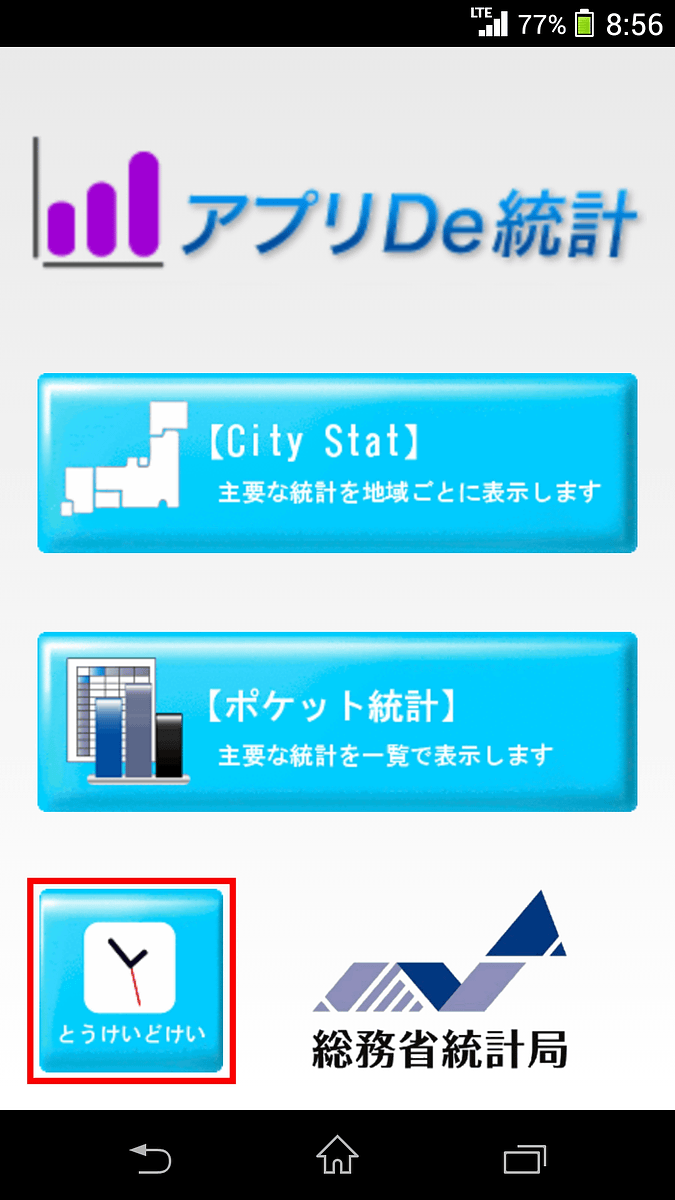
The startup screen of the application looks something like this, it is very simple. The menu is roughly divided into three categories, "City Stat", "Pocket Statistics", and "Ui Kei Kei".
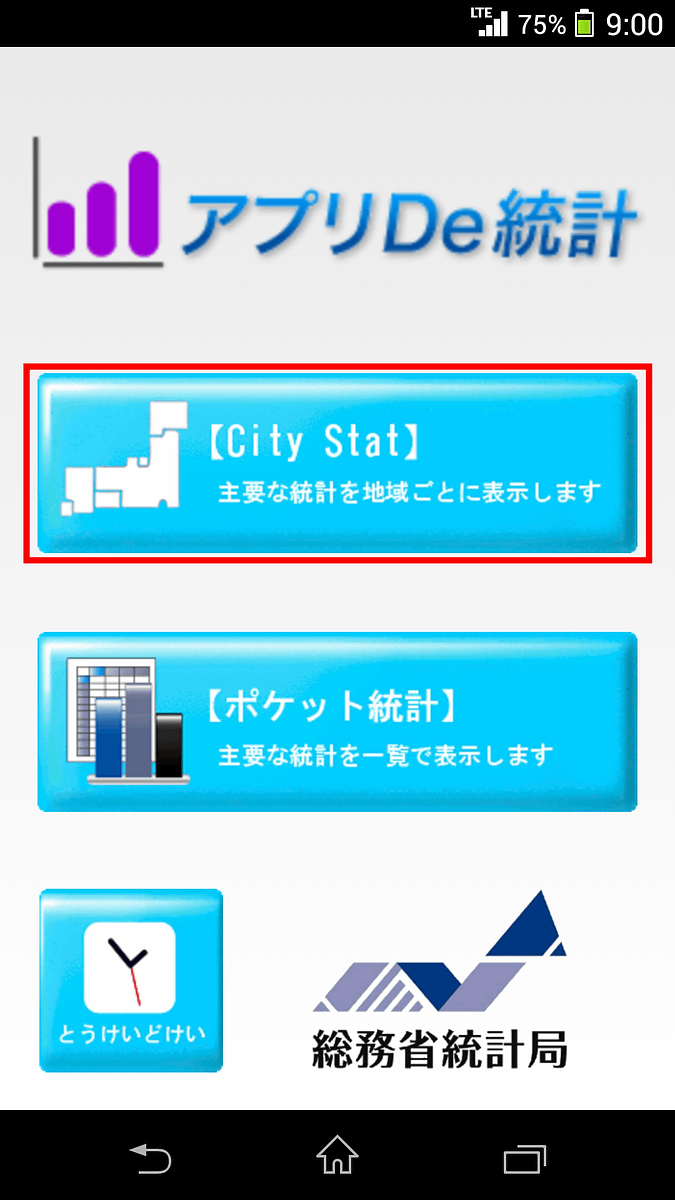
◆ City Stat (Displays major statistical data for each region)
So tap "City Stat" first.
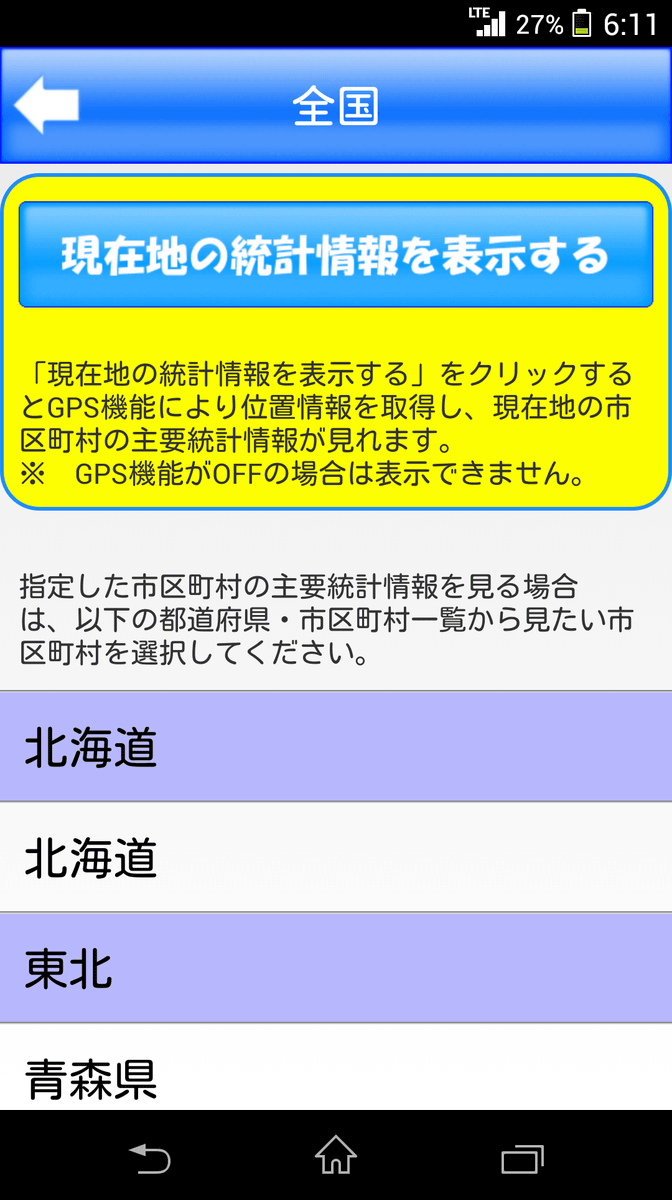
At the top of the screen of "City Stat" there is an indication "Display statistics information of location", and if you tap it, you can identify the current location of the smartphone with the GPS function and display the statistical information of the current location .
Of course it is OK even if you select the municipal district of the prefecture you want to see statistics information manually. That's why "Tokyo" ...
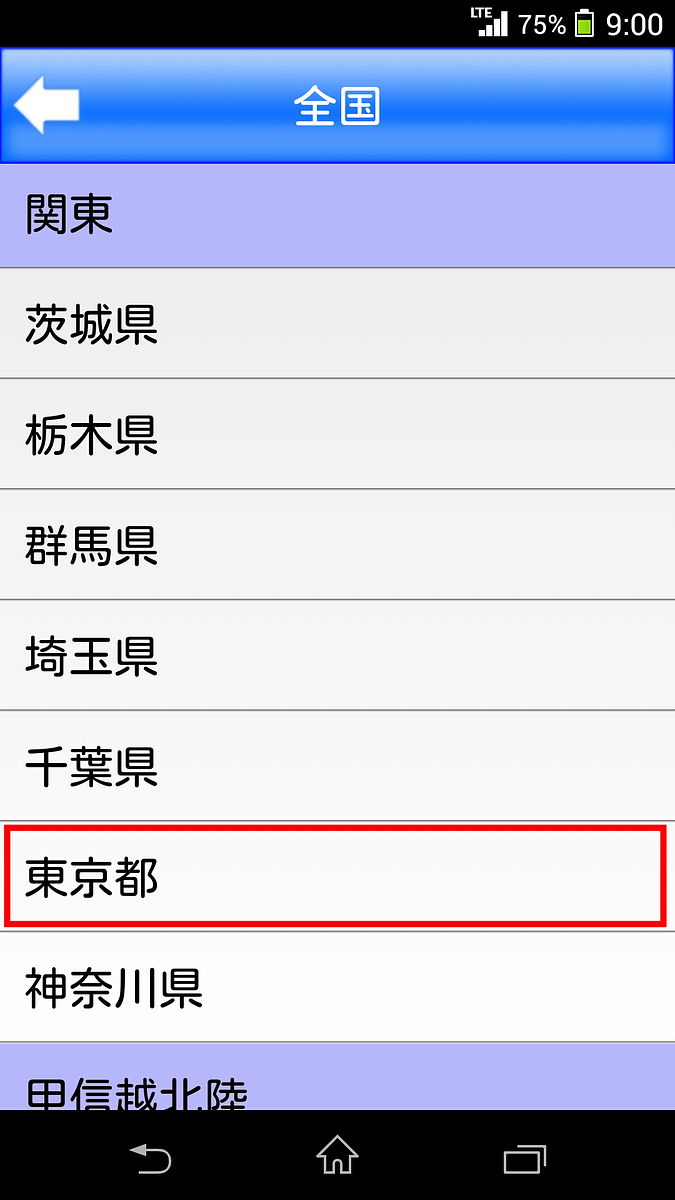
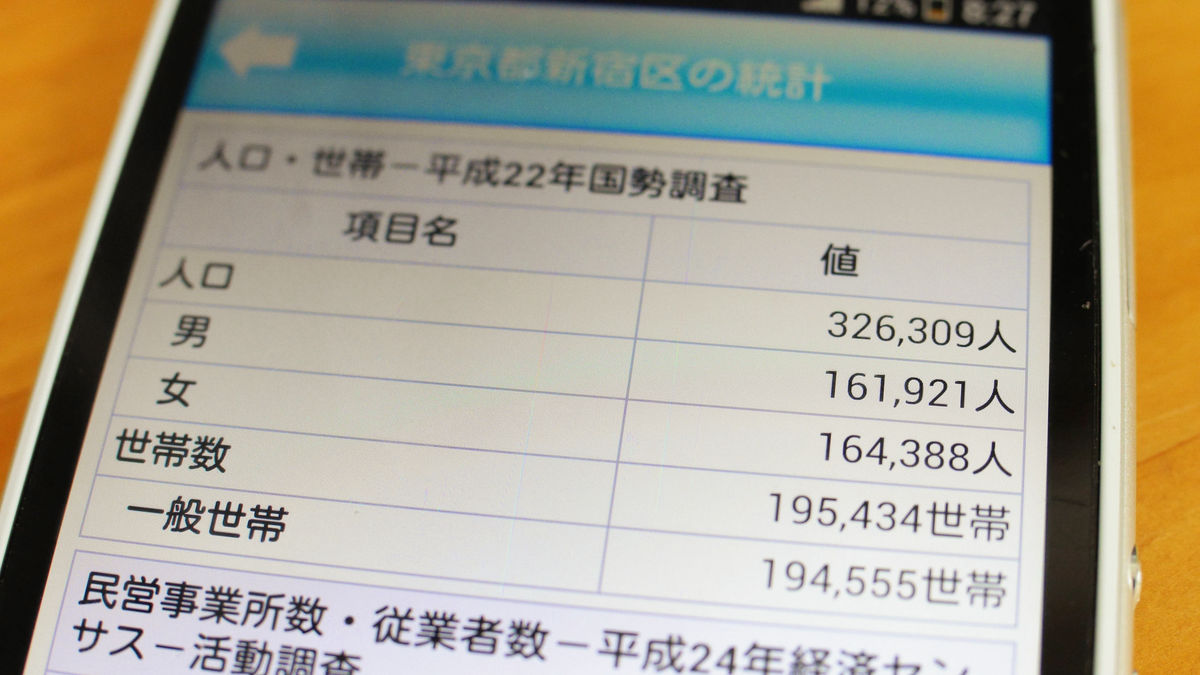
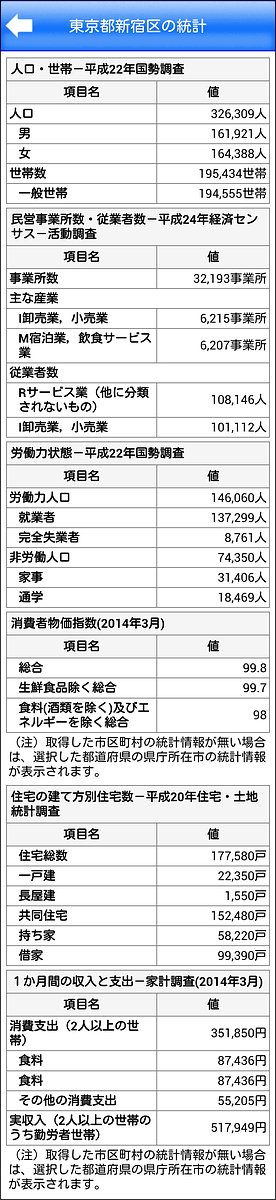
I will try to display the statistical information of "Shinjuku-ku".

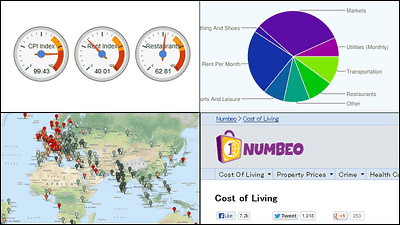
Then, statistical data such as "population · household", "number of private enterprises and employees" "labor force state" "consumer price index" "number of houses by housing method" "income and expenditure for one month" You will see a slippery slide.
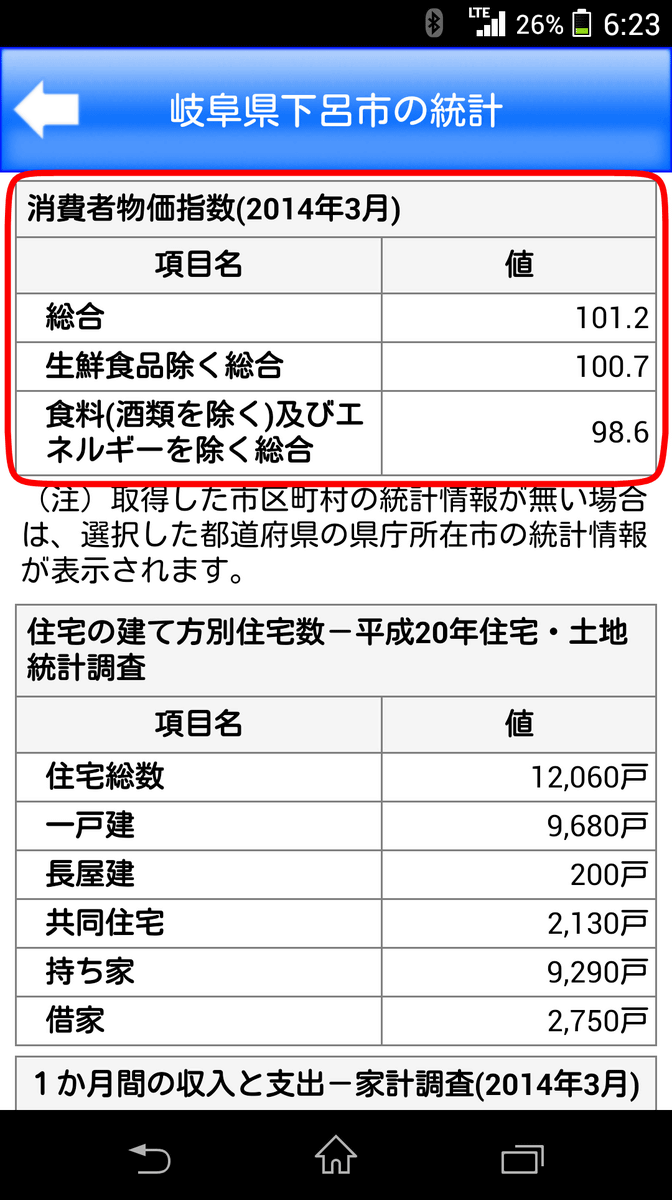
With this "City Stat" you can see the statistics information of the current location with one tap, so check out the consumer price index of sightseeing spots visited by travel ... ...
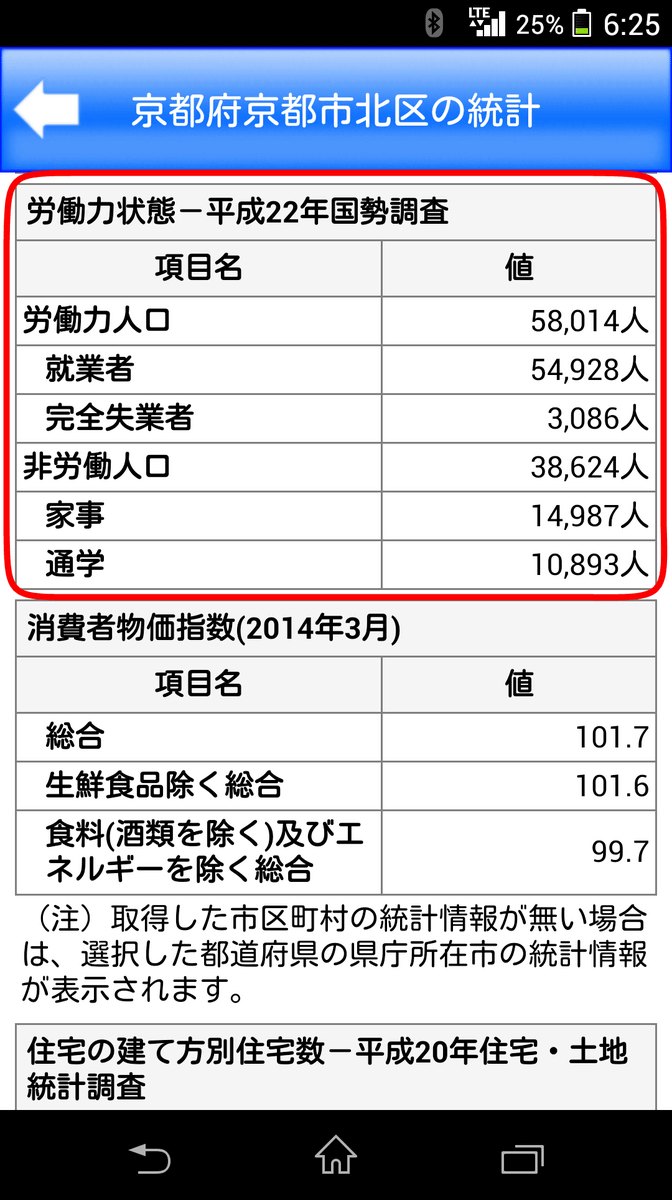
Looking at the state of the labor force of the moving destination, you can try to imagine how many strangers are likely to be in town, or how many students are likely to be.
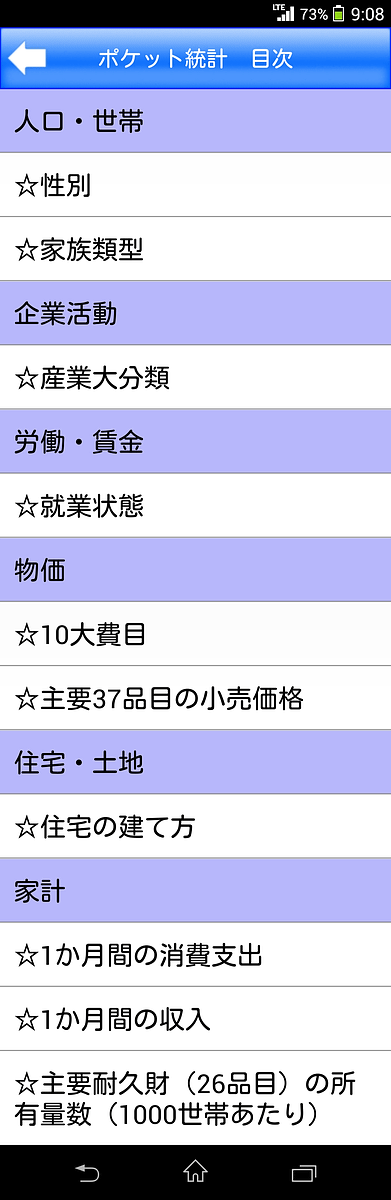
◆ Pocket statistics
Next I will try using "Pocket statistics".
In the pocket statistics, it is possible to view 10 types of statistical data of 6 types, "population · household", "corporate activity", "labor · wage", "price", "housing / land" and "household".
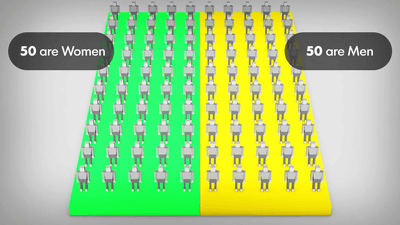
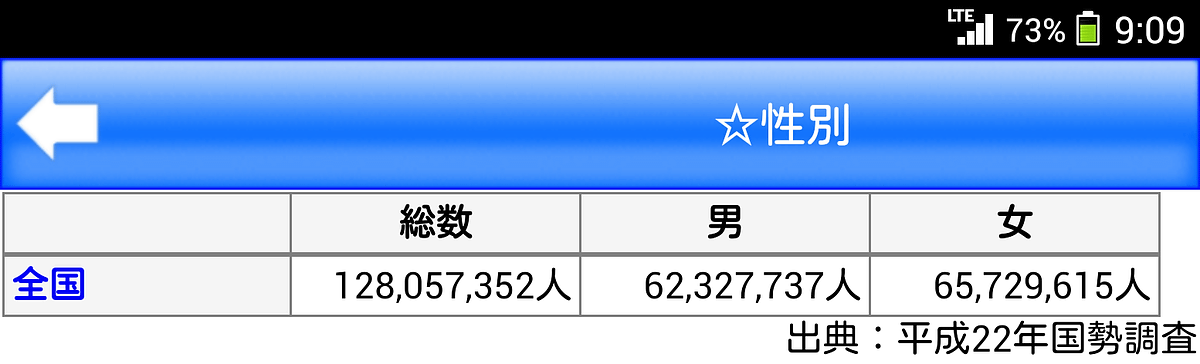
For example, when you tap "sex", you can see the population of Japanese people. According to the census of 2010, the total population of the Japanese is 122,057,352, of which the breakdown is that the number of men is 62.337737 and that of women is 65,709,1615.
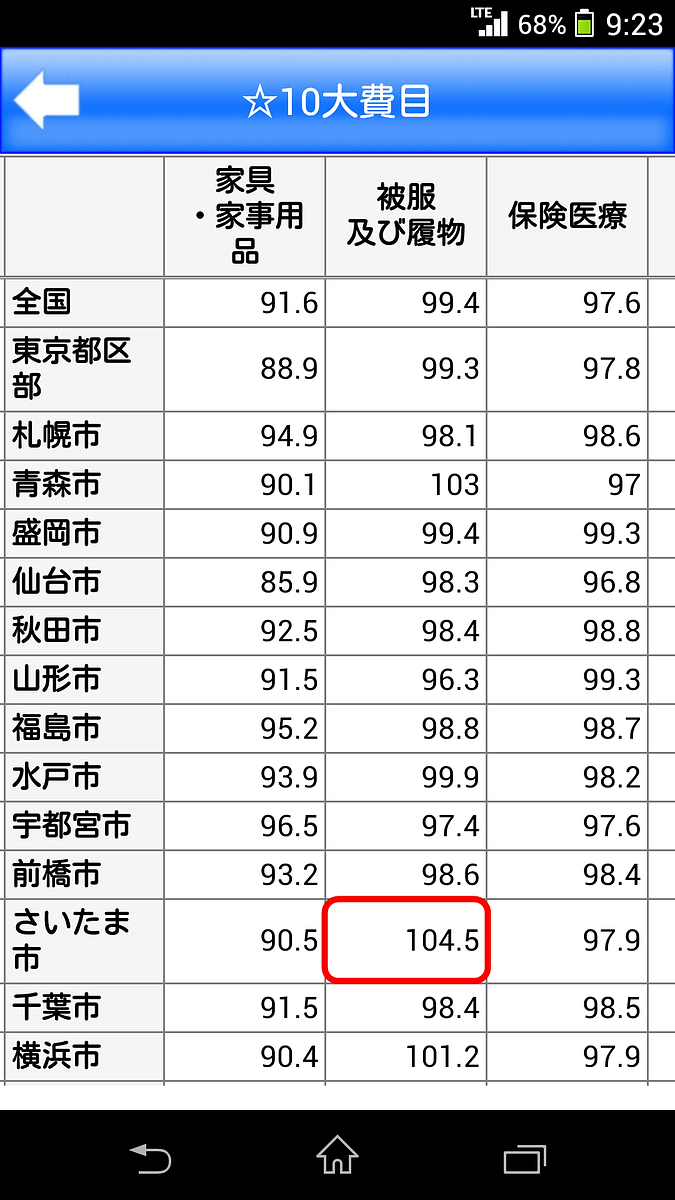
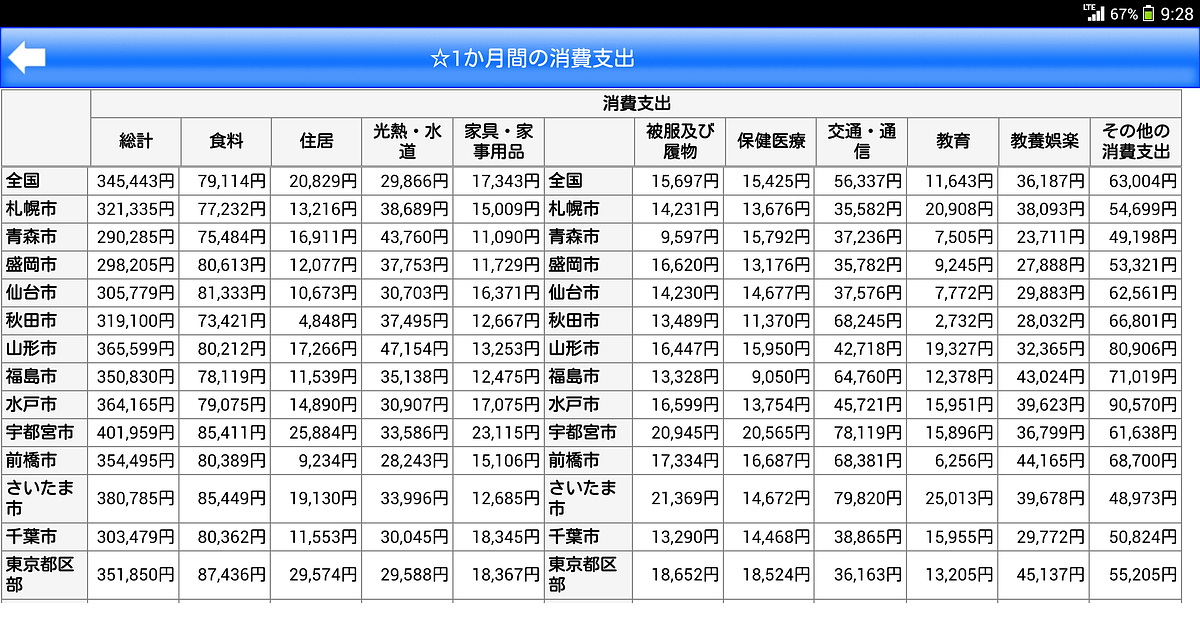
"10 major expenditure items" includes 10 kinds of foods, housing, light heat / water, furniture, household goods, clothing and footwear, health care, traffic / communication, education, educational entertainment, various miscellaneous expensesConsumer price indexIt is possible to display for each area.

As the consumer price index for each region is displayed, we can see that in Saitama City there was a price hike of products belonging to "clothing and footwear" than in the same month of the previous year.
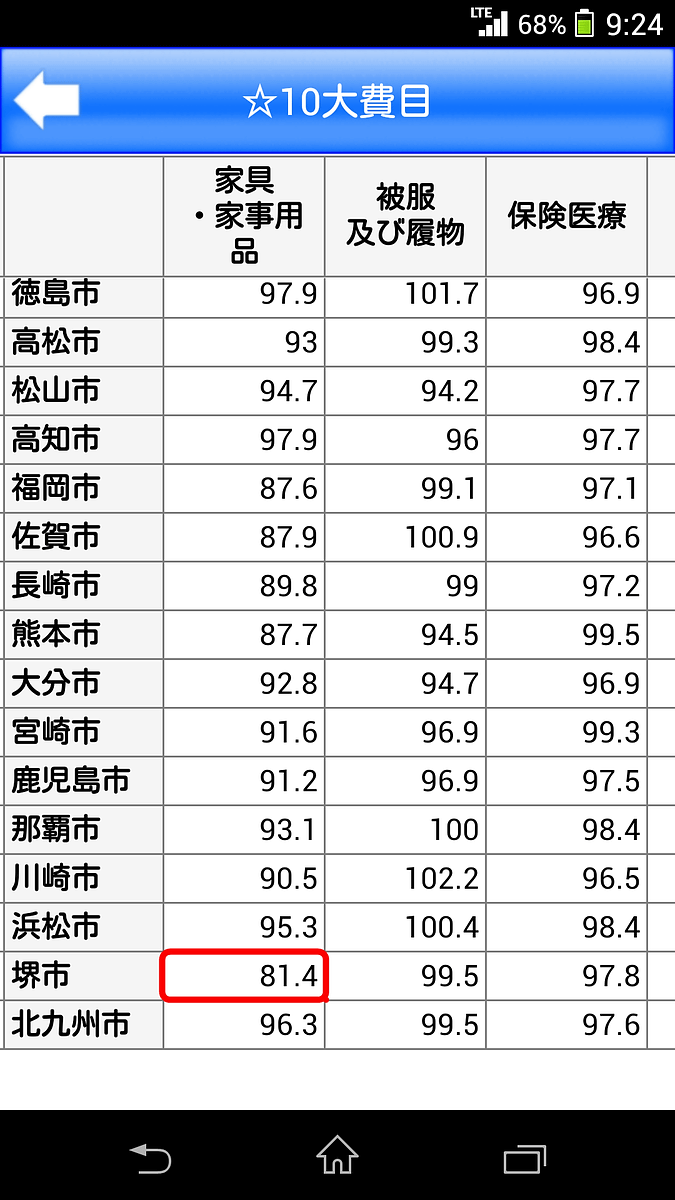
Besides, in Sakai City, it seems that "furniture / household goods" could be purchased cheaply briefly than the same month last year. Since this data is the consumer price index in March, Heisei 20, what happened in Sakai city before tax increase?
In addition, "monthly consumption expenditure" for each prefectural capital location ... ...
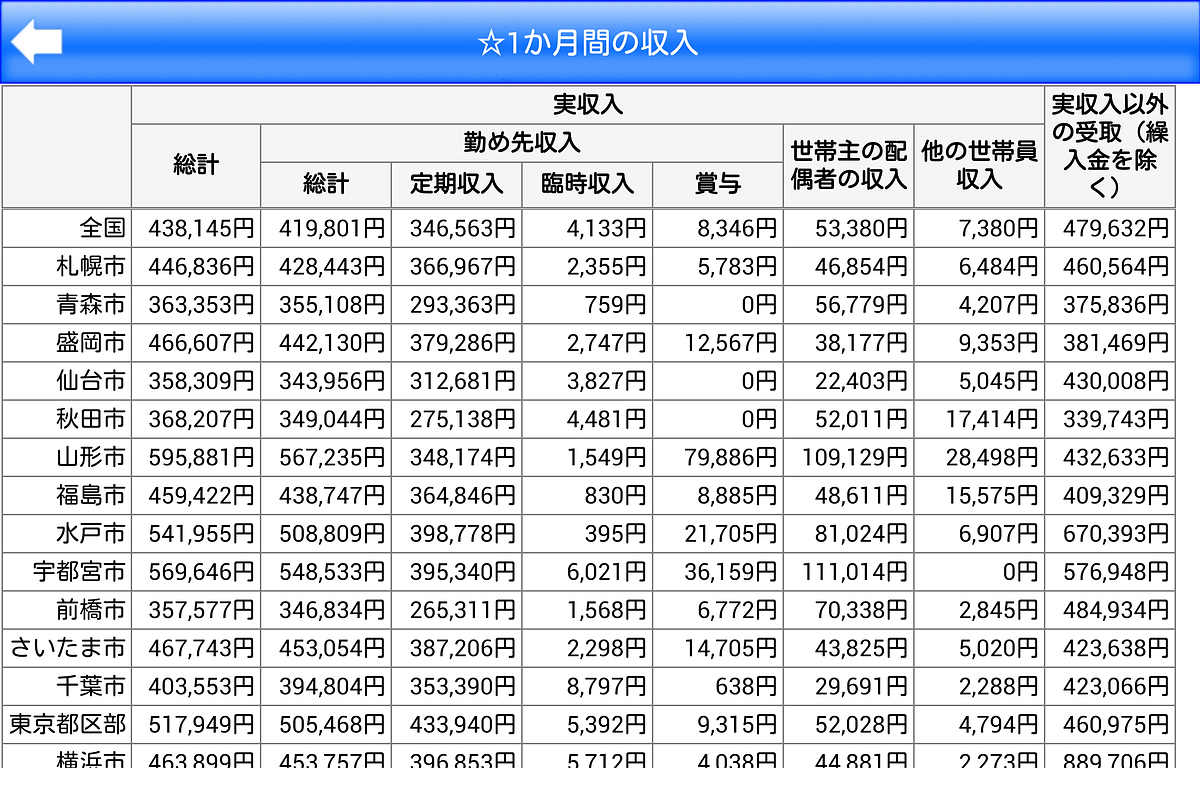
"Revenue per month"
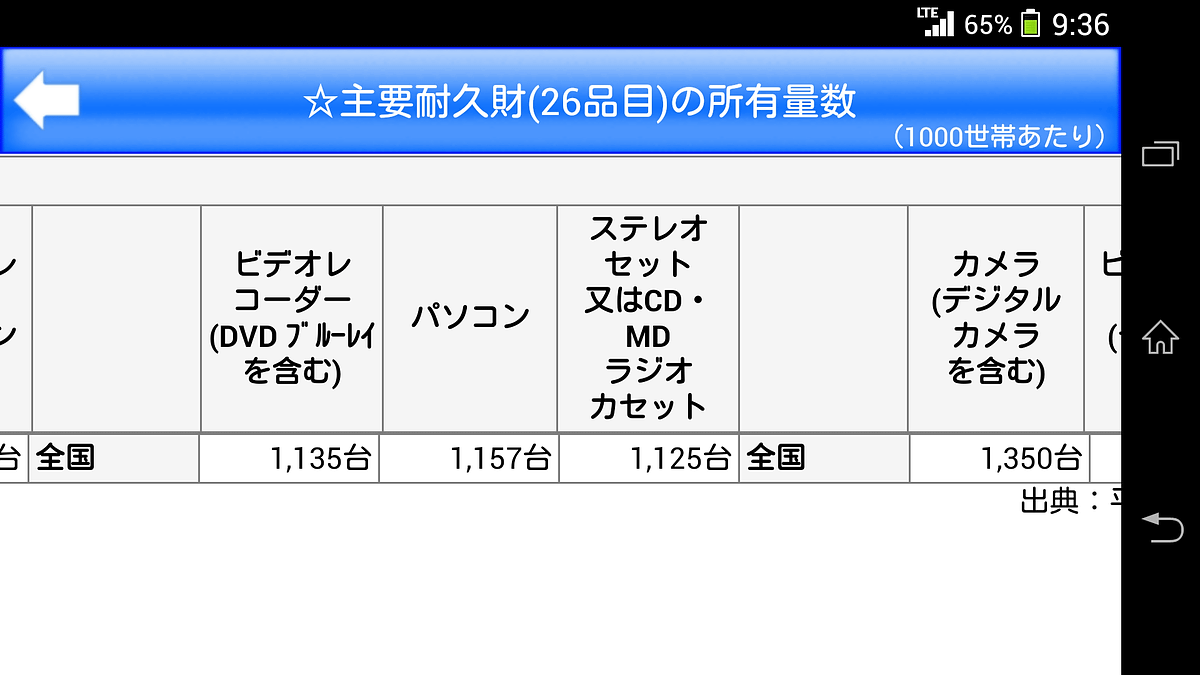
"Number of ownership of main durable goods (26 items)" and others can be seen.
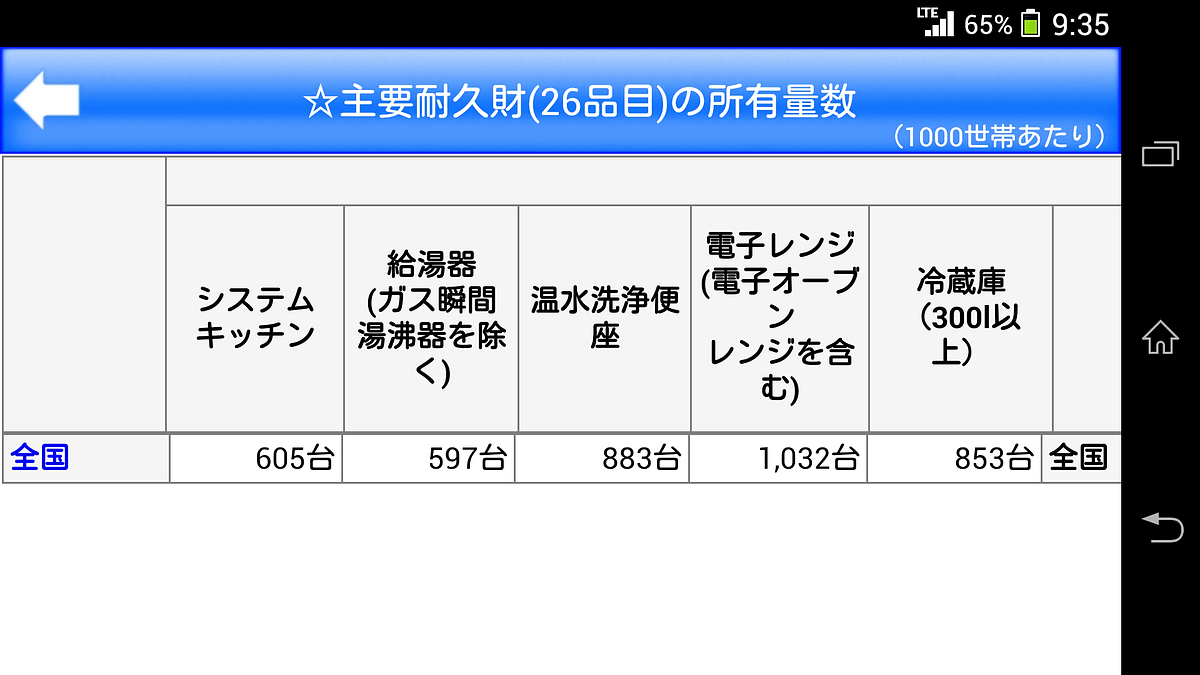
According to Korea, the number of motorcycle scooters per 1,000 households is only 177.
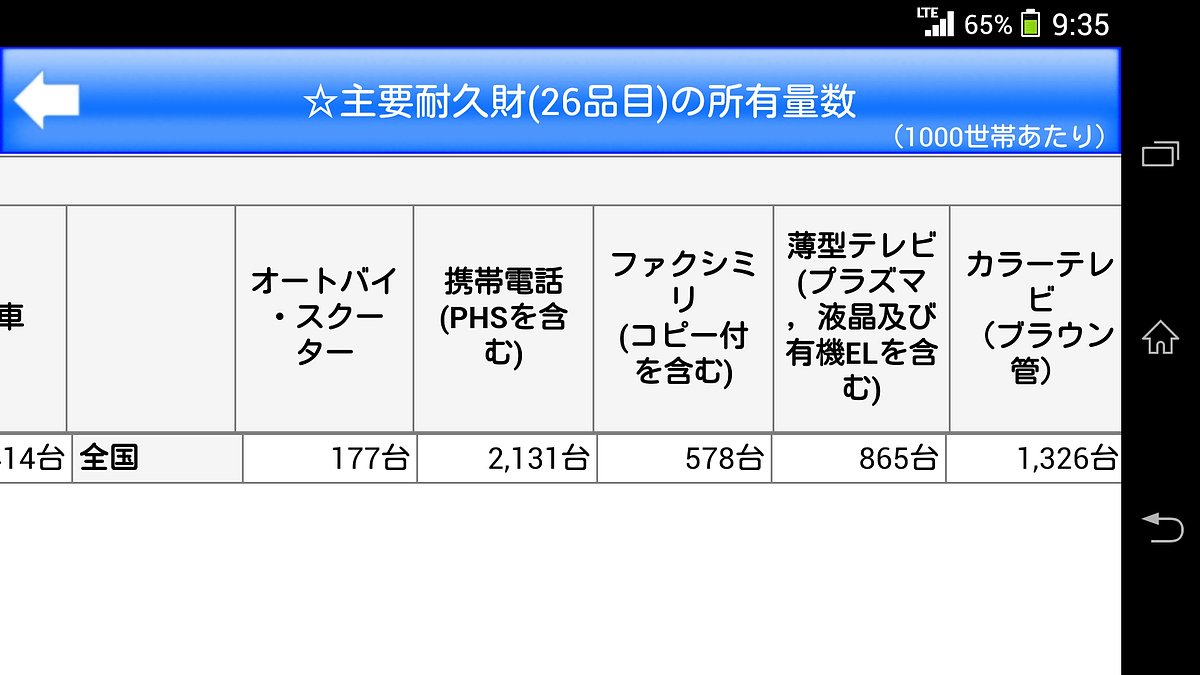
On the other hand, it is possible that one household has at least one video recorder (including DVD blu-ray), personal computer, stereo set or CD / MD radio cassette, and camera (including digital camera) I understand. I do not have anything to say because I understood, but I will be alone with "I see ~ hee ~".
___ ___ 0
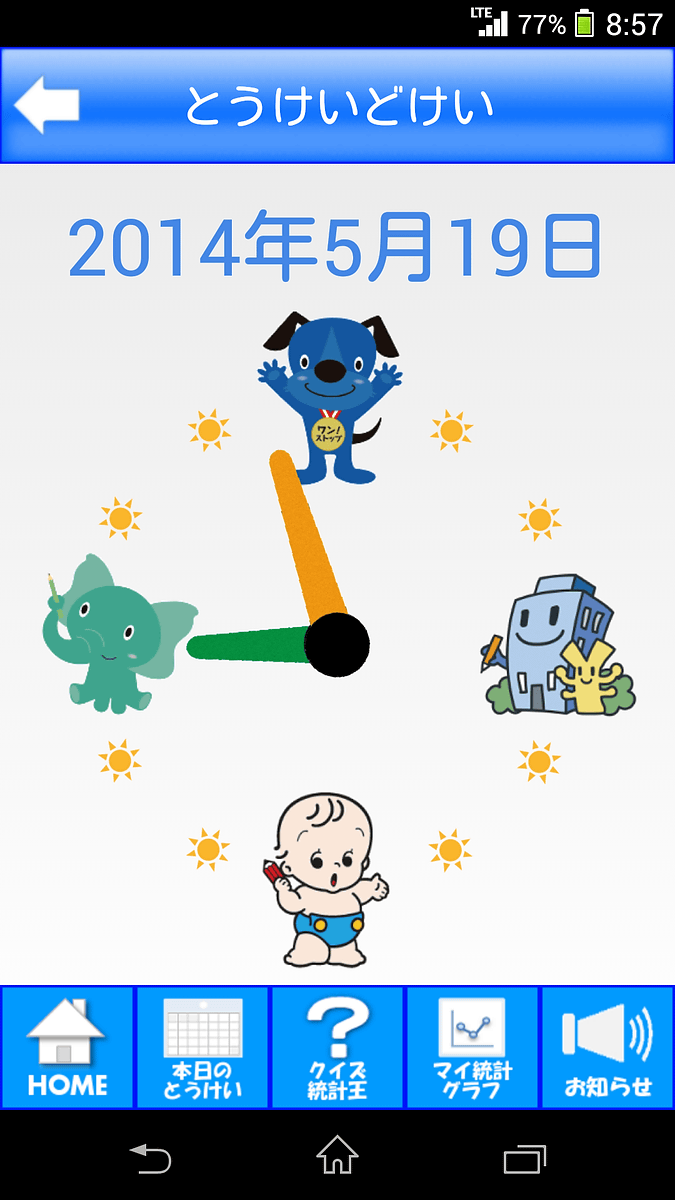
In the end, I will try using "Keio Kei".
And the top screen of the Kei Kei is like this, it is unlikely to be an application created by a government agency that is unlikely to unlikely.
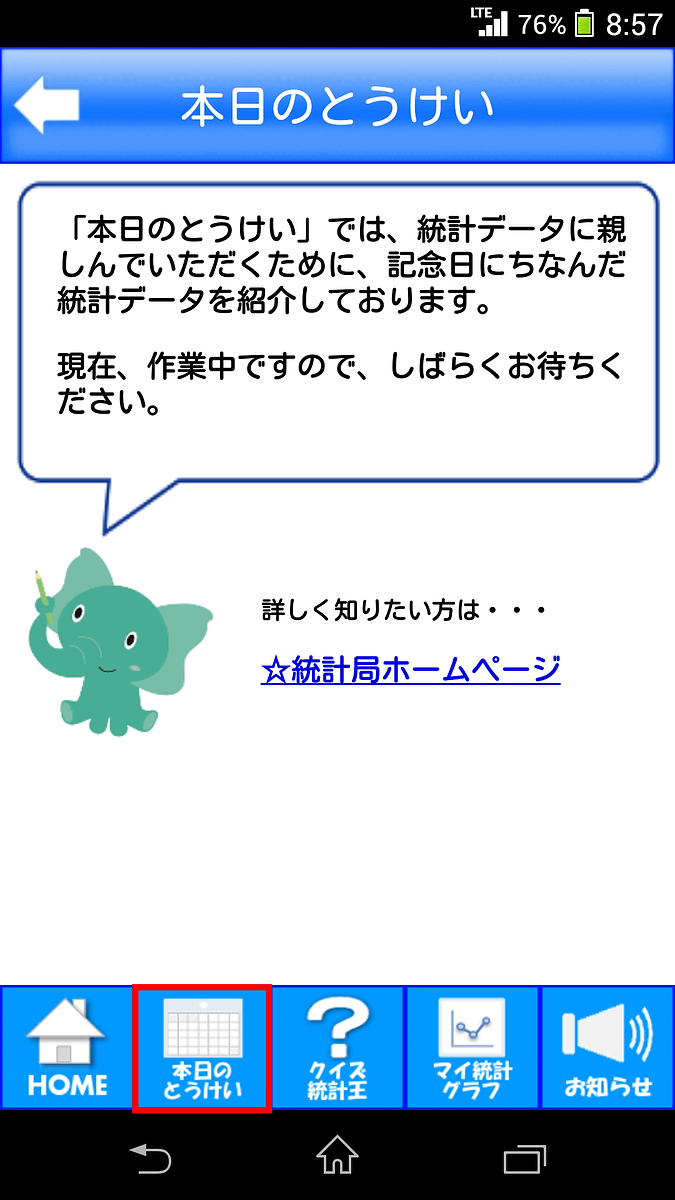
When you tap "Today's toy" at the bottom of the screen, it will display statistical data for that day that day .... Although it is supposed to be a trial version of the application, "Please wait for a while as it is under construction." It is displayed only.
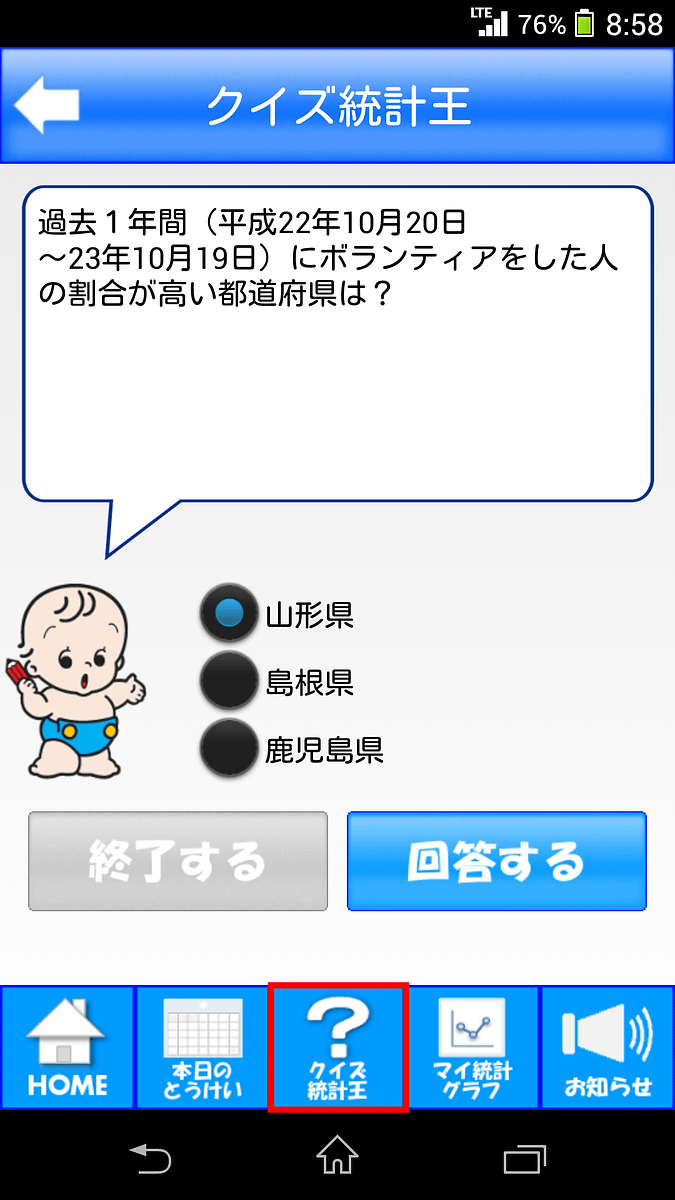
When you tap "Quiz statistics king", quizzes created based on statistical data are displayed.
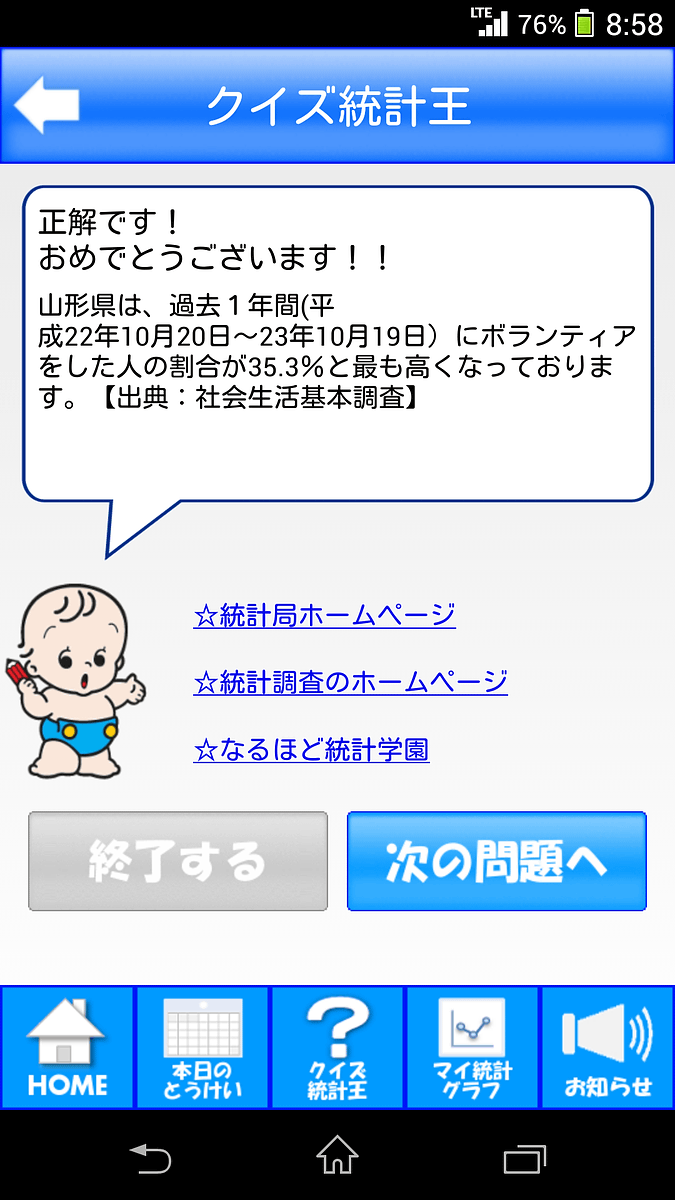
After answering it will display detailed data, so it seems that the number of knowledgeable beans will increase rapidly.
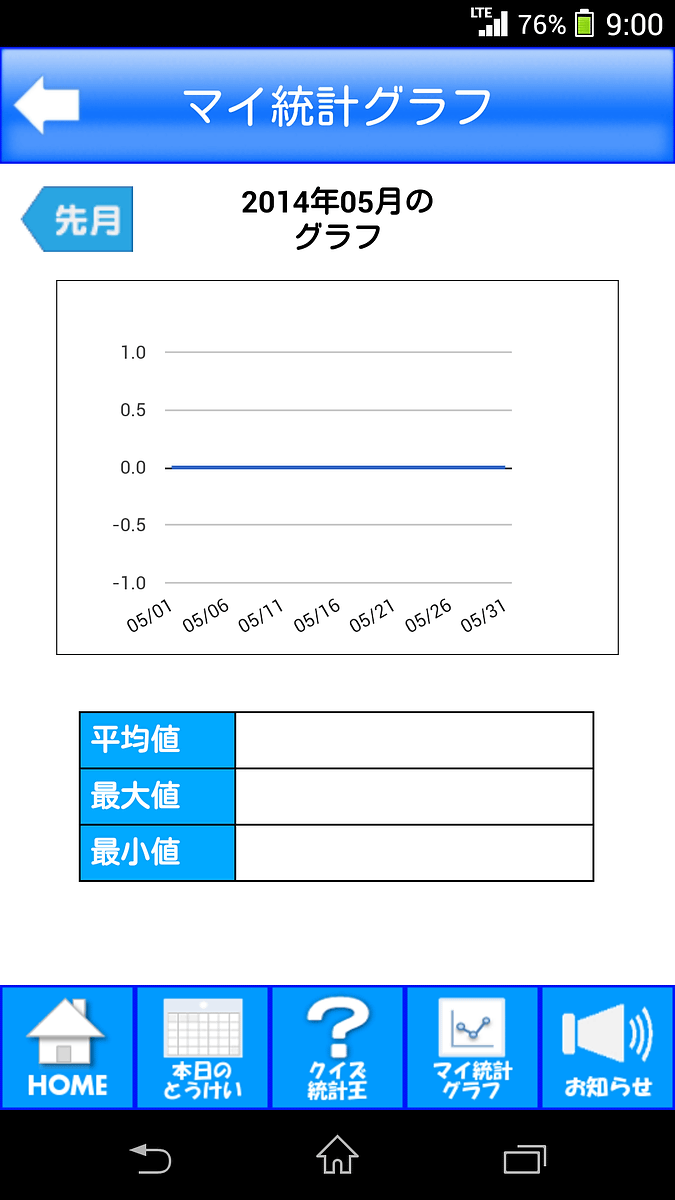
You can also create statistical graphs by entering data yourself by tapping "My statistical graph".
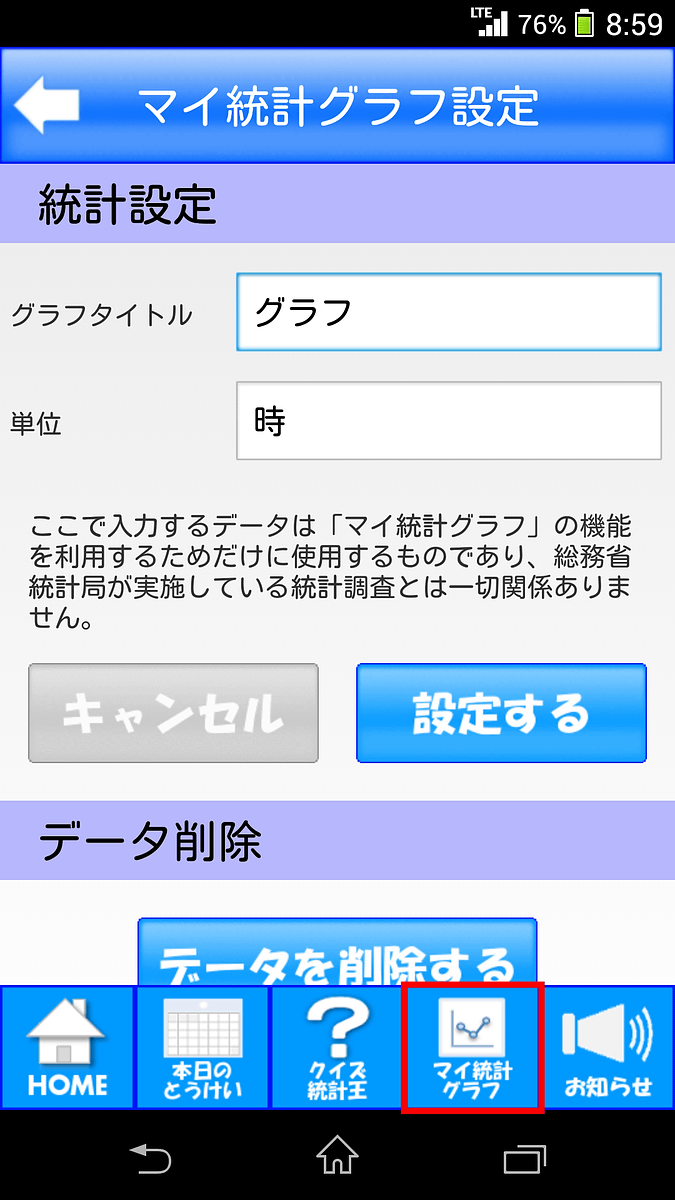
If you enter detailed numerical values on this screen ... ...
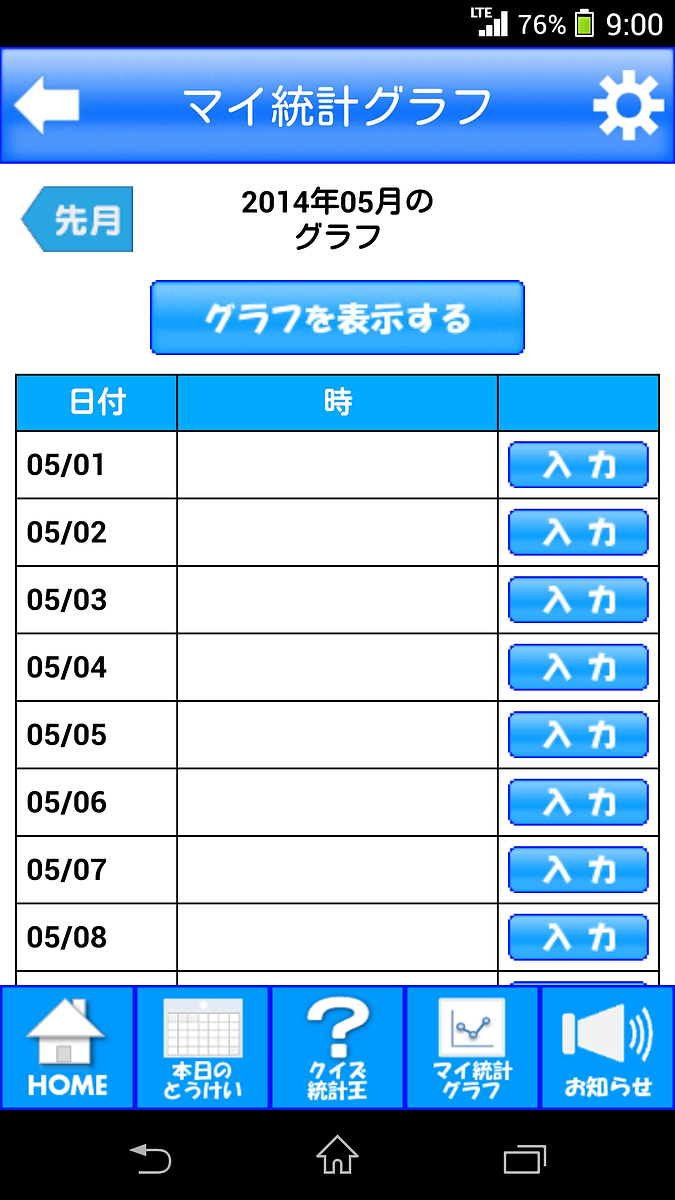
It creates graphs, that's why.
Ali is trying to install the application and see the statistical data of the area where you live because you can easily access a lot of statistical data that you do not usually touch so much.
Related Posts: