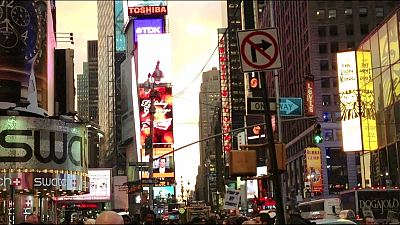
Study to demonstrate "cracked window theory" using Google's street view
Using the street view photos of Google, we will examine how the appearance of the city affects the impression that "the place is safe or prosperous" that people have "Place Pulse"Was developed. this isMassachusetts Institute of Technology(MIT) researchers, and a pilot study was conducted from 2010 to 2012, and now data of 56 cities are being compared.
Place Pulse | Mapping Urban Perception
http://pulse.media.mit.edu/
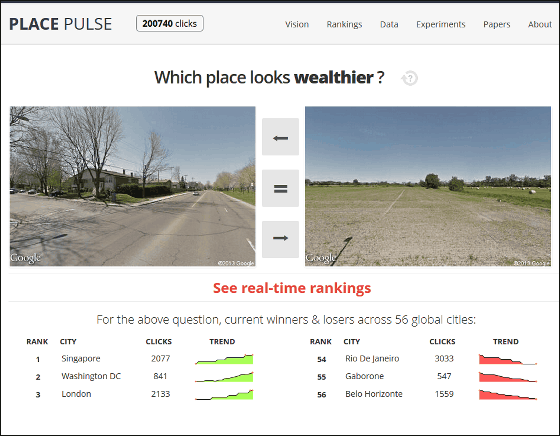
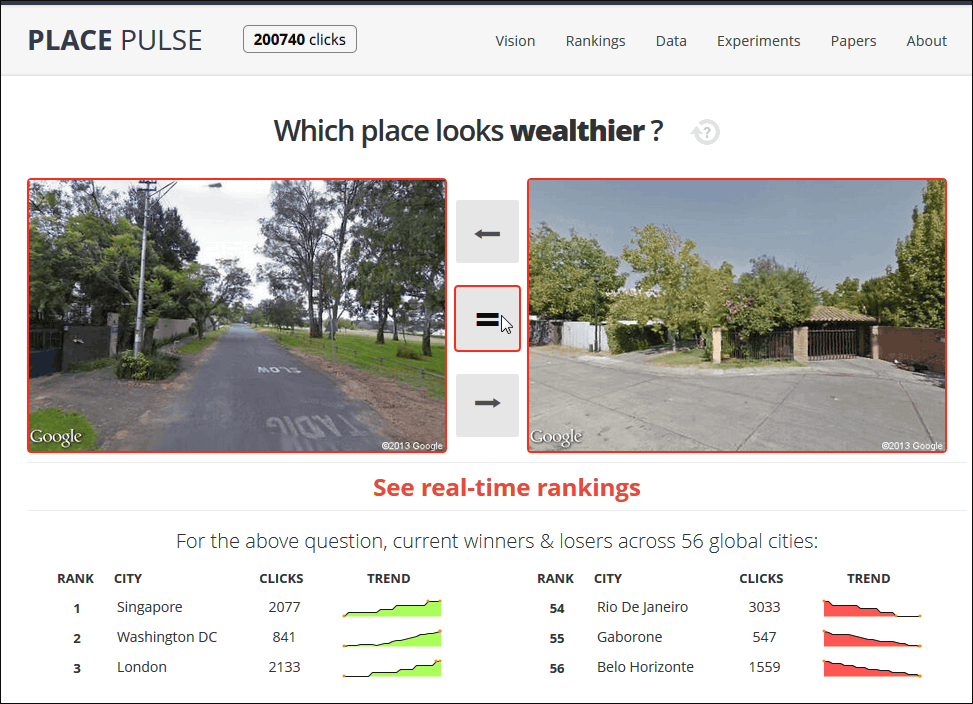
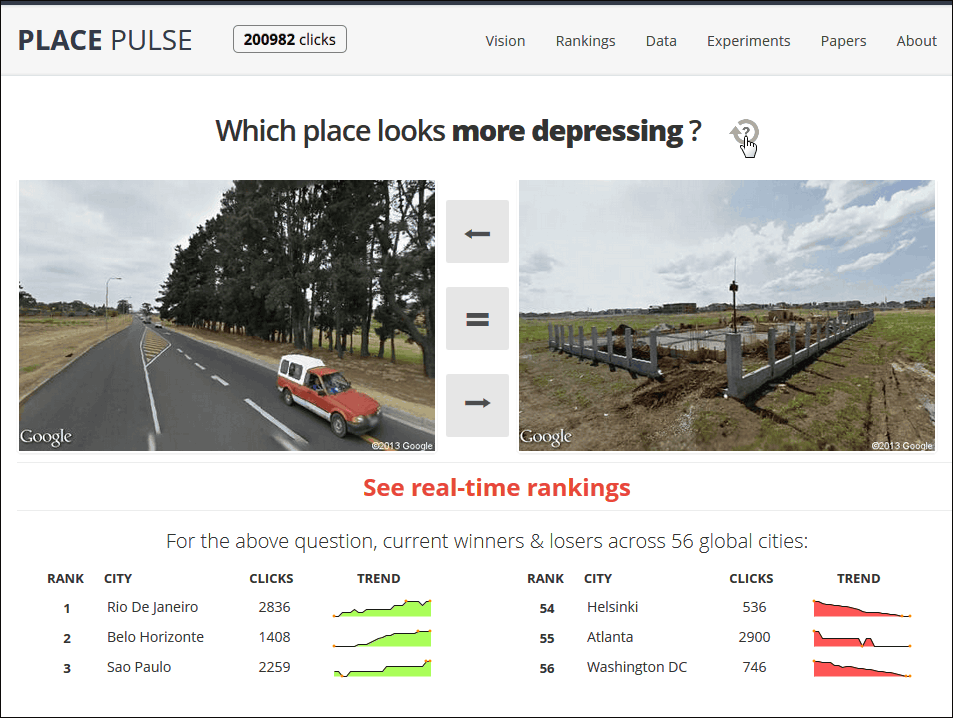
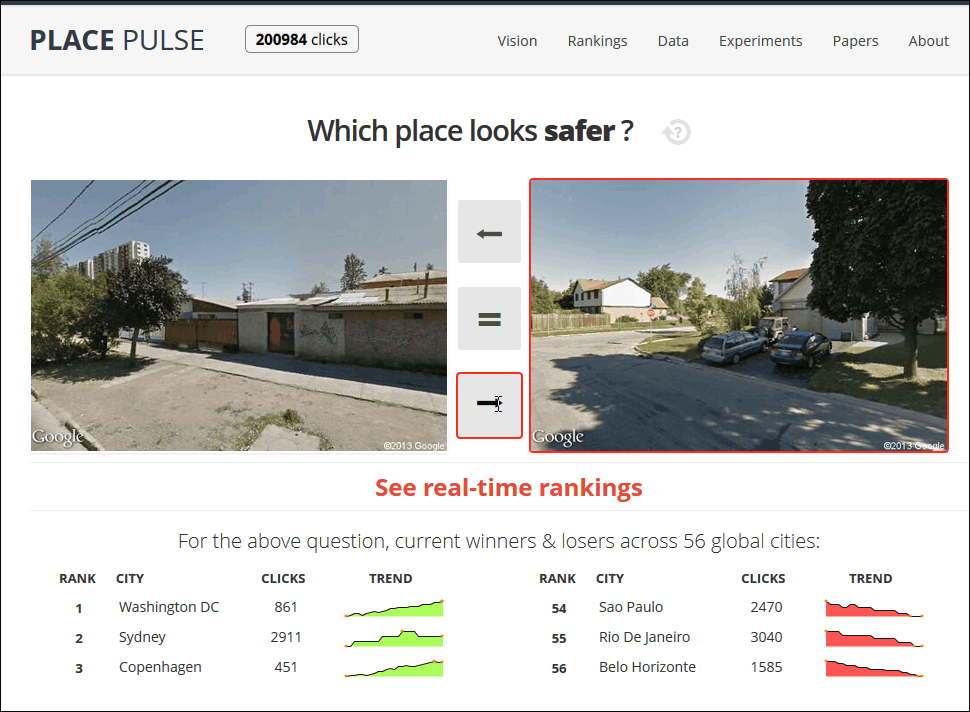
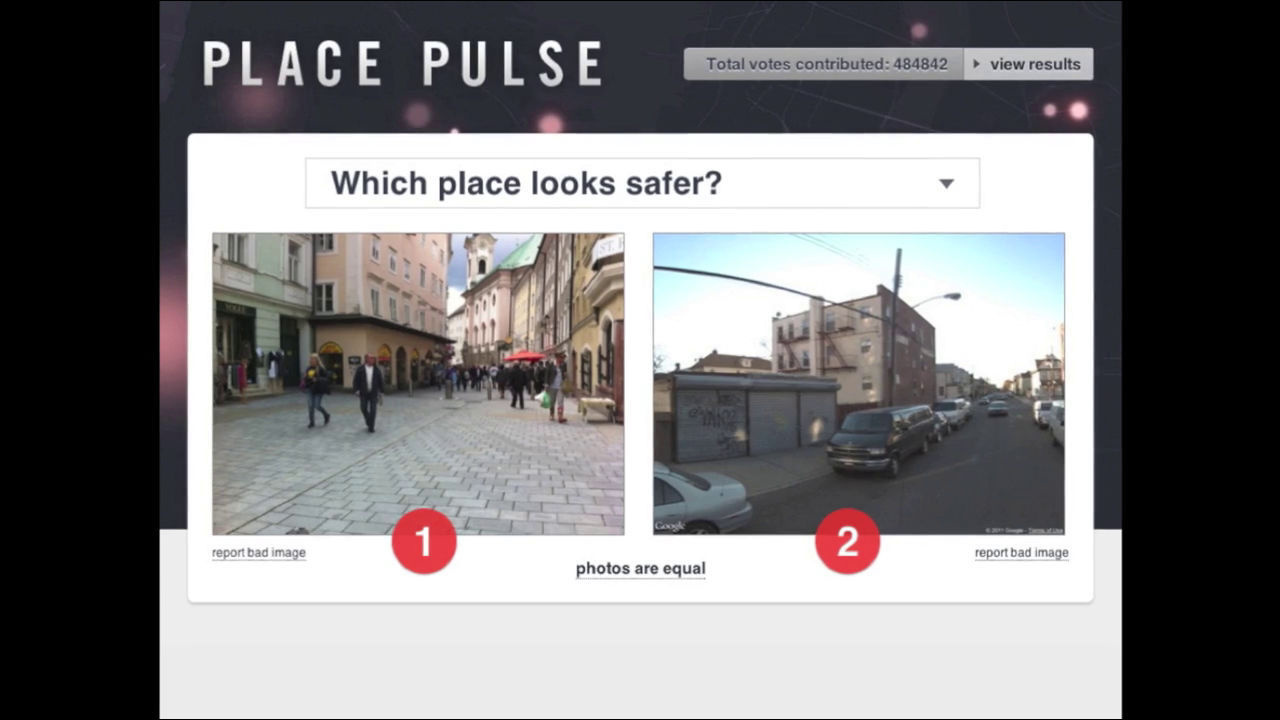
When you visit the website two images will be displayed on the page. The question is "Which place looks wealthy?" Answer by clicking on the symbol in the middle that the image on the right, the image on the left, or both images are the same impression.
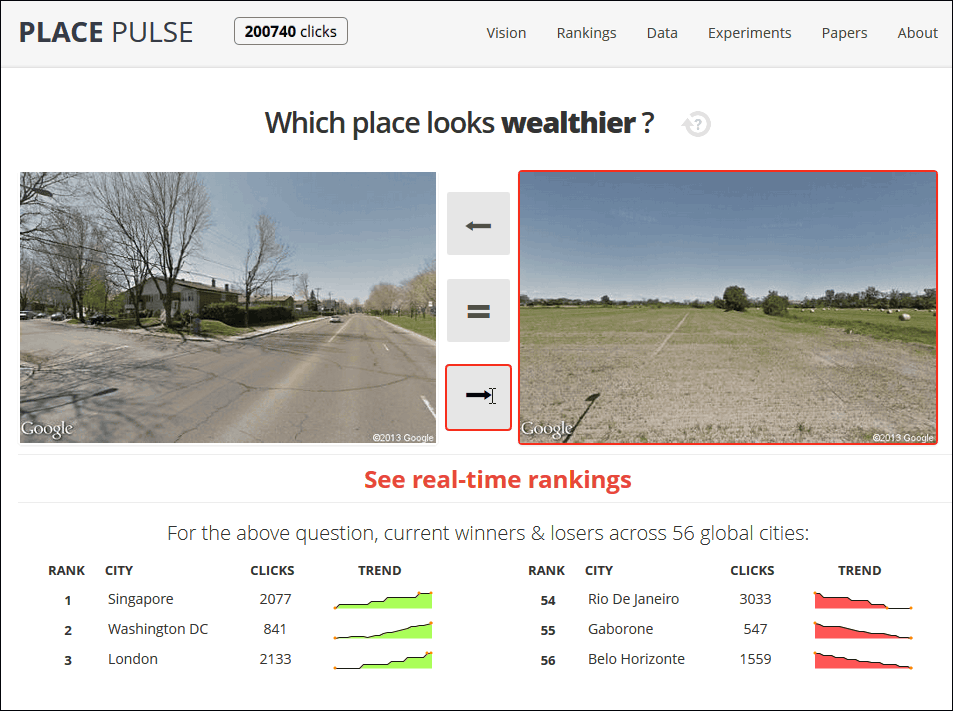
Then I move on to the next question. The real time ranking of each city against the question can be confirmed under the image. For example, the first ranking for the question "Which place looks wealthy?" Is Singapore, the lowest ranking is in the southeastern part of BrazilBelo Horizonte.
If you click "?" To the right of the question the question will change. Next, "Which place looks more depressed?", Rio de Janeiro in Brazil, who had the most melancholy impression, the furthest from the melancholy impression was Washington, D.C.
The first place in the question "Which place looks boring?" Is the capital of BotswanaGaborone, The lowest is Taipei.

Washington D. C. Is the No. 1 place to ask "Which place looks safe?", The lowest place is Belo Horizonte.
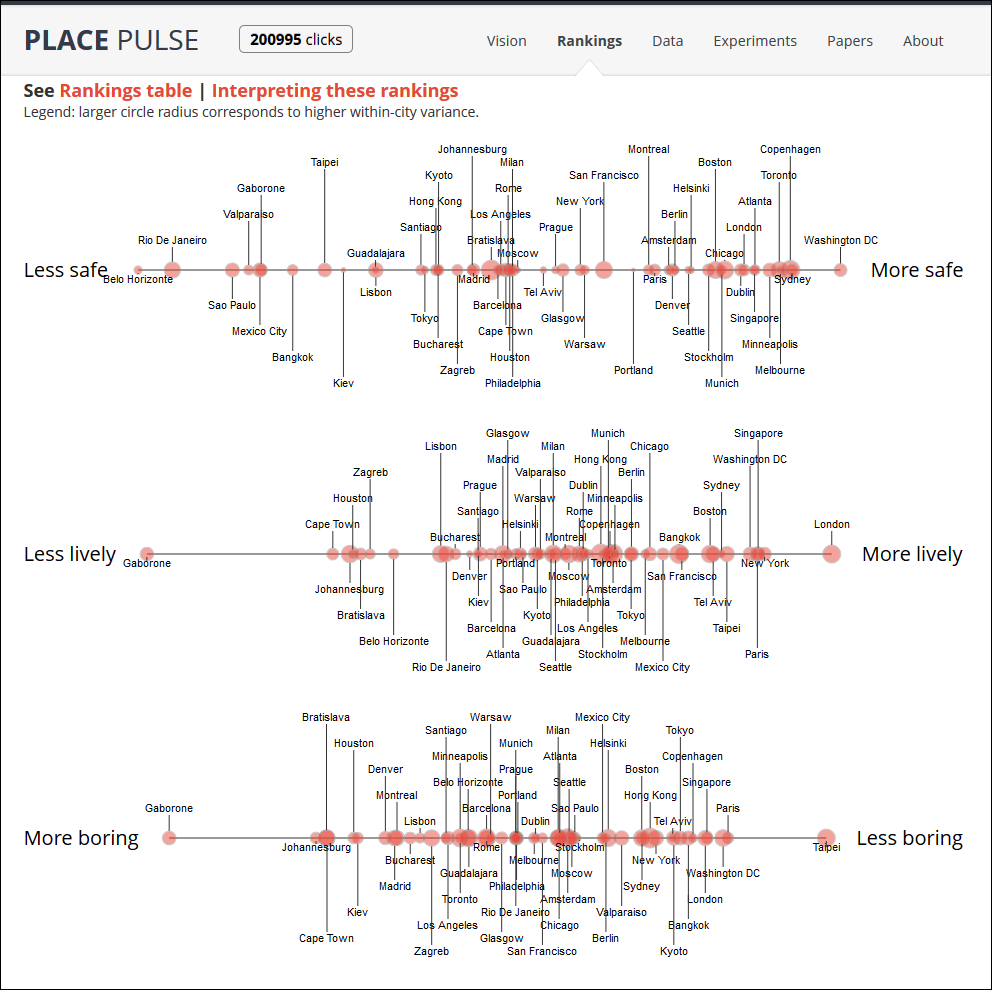
There are five questions in all, and in each questionRankingIt is also open to the public.
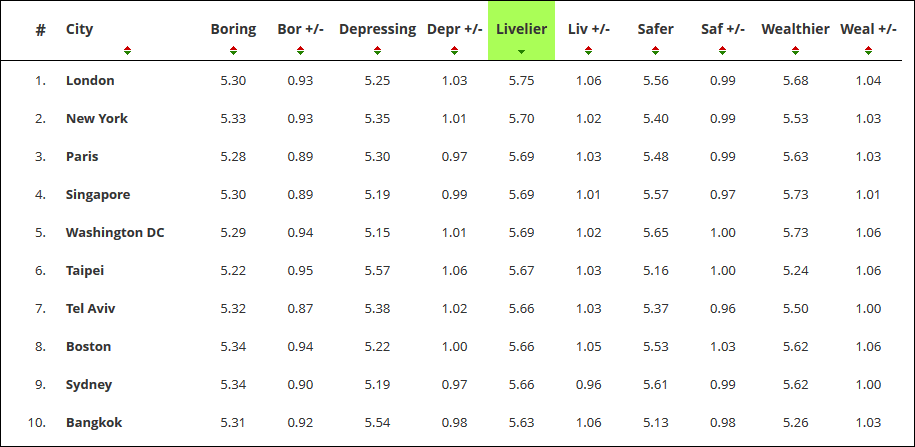
Ranking on the criteria of "looking lively", ranked first in London, No. 2 in New York, 3rd in Paris, 4th in Singapore, 5th in Washington, DC, 6th in Taipei , The 7th placeTel Aviv, Boston the eighth place, Sydney the ninth place, Bangkok the tenth place.
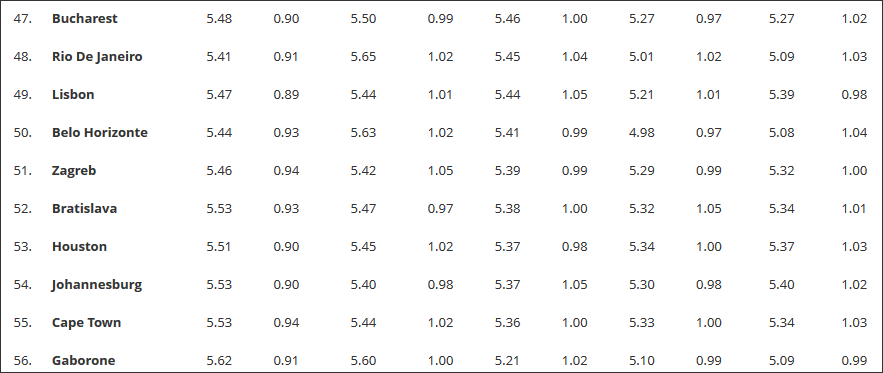
Conversely, the worst 10 in the ranking is Gaborone in the 1st place, Cape Town in the second place, Johannesburg in the third place, Houston in the fourth place, Houston in the fifth placeBratislava, The sixth place isZagreb, Belo Horizonte the 7th place, Lisbon the 8th place, Rio de Janeiro the 9th place, the 10th placeBudapestIt was.
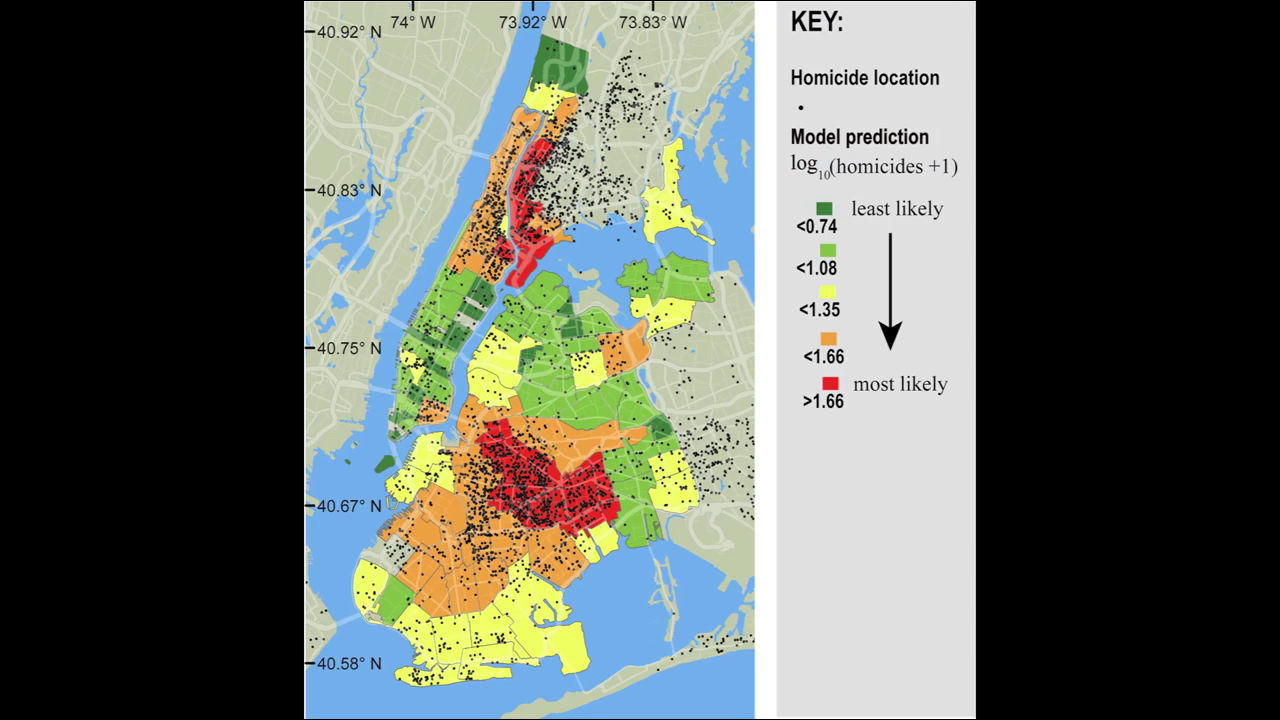
From the idea that "If the building's window is broken, it becomes a symbol that nobody is paying attention and eventually all the other windows will be destroyed", also criticizing minor crimes thoroughly In criminal enviroment on the theory that suppression of crime including violent crime can be suppressed "Cracked window theoryIs also used in the maintenance of public security in New York and Sapporo and is also used in Tokyo Disney Land Tokyo DisneySea, but on the other hand it is impossible to quantify subjective things like "awkward disorder" There was also criticism that it was. However, with this tool, it is possible to analyze what kind of impression people have to a place from enormous data, and it will be possible to map it on a map That's it.
The contents of pilot study conducted from 2010 to 2012 can be seen from the following movie.
The Collaborative Image of the City on Vimeo
The pilot version was done using about 5000 pictures for cities such as New York, Boston, Linz, Salzburg.
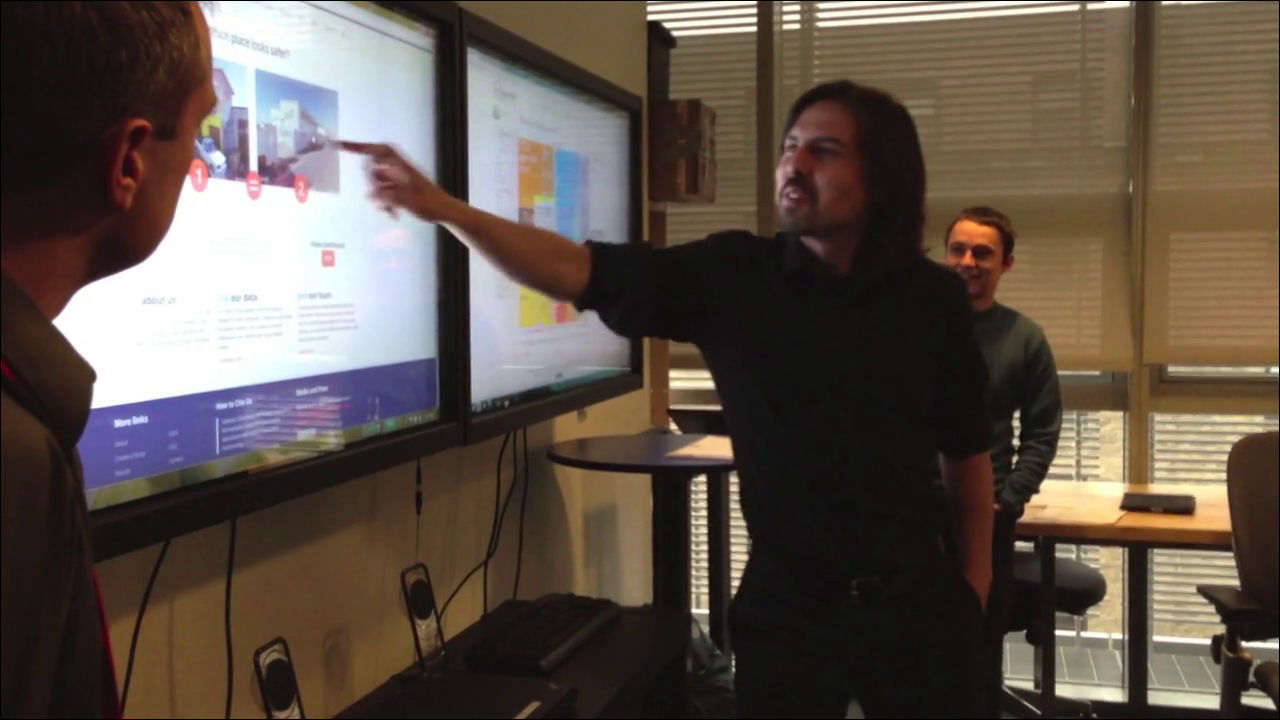
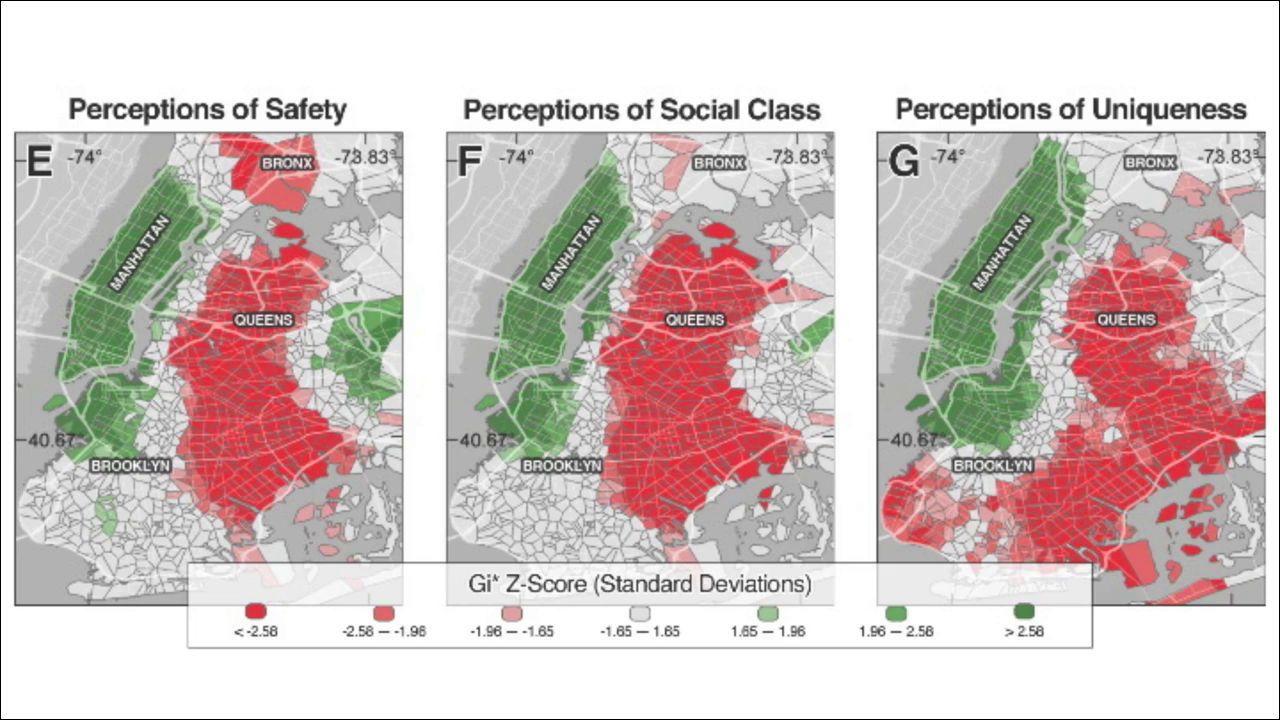
The interface is slightly different from the current version, and the question was also three kinds of "which one seems safe", "which one looks more upstream" or "which is more unique".
The color coding of the map for each question is as follows. Among New York, Manhattan seems to have the impression that it is safer, upper class, and unique than Queens.
Coloring New York with the criteria of "vibrant" was like this.
Related Posts:


in Note, Posted by darkhorse_log