``Autonomous driving has an overwhelmingly lower accident rate than human drivers,'' claims Cruise, a subsidiary of GM, with a 65% reduction in accidents and a 74% reduction in accidents with the risk of injury.
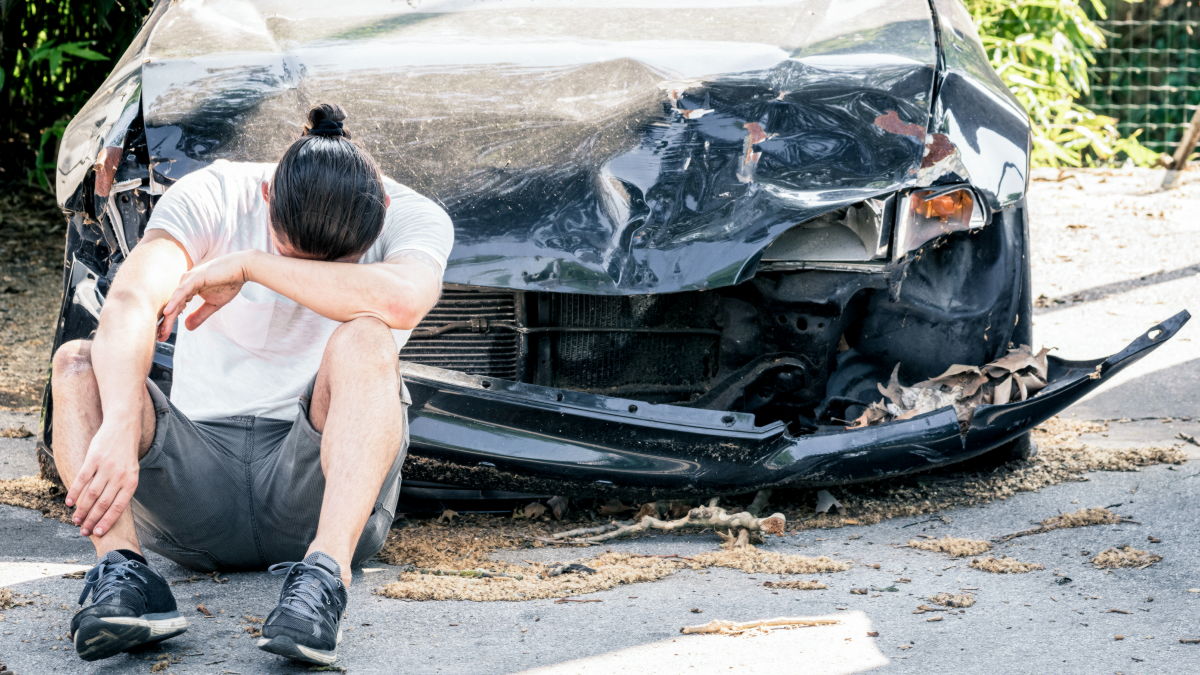
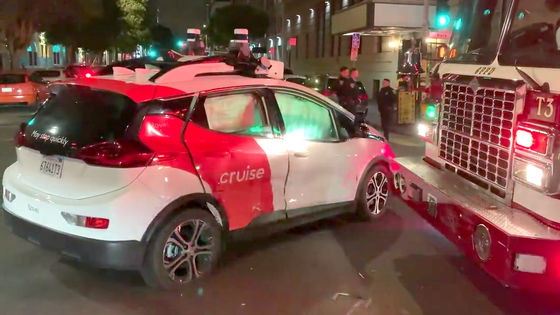
In recent years, advances in self-driving technology have been remarkable, and social experiments in which self-driving cars are driven on public roads are already underway in some parts of the United States, but there have been cases where self-driving cars have caused
Establishing a Crash Rate Benchmark Using Large-Scale Naturalistic Human Ridehail Data
https://deepblue.lib.umich.edu/handle/2027.42/178179
A Comprehensive Study - Human Ridehail Crash Rate Benchmark | Cruise
https://getcruise.com/news/blog/2023/human-ridehail-crash-rate-benchmark/
Today we are publishing a white paper that presents the human driver crash rate we use as a safety benchmark.
— Kyle Vogt (@kvogt) September 27, 2023
It is the most precise study of human driving performance ever conducted, and it shows @Cruise AVs outperform humans in a comparable driving environment. More ????(1/5) pic.twitter.com/nupCbv1s7b
'Today, we're publishing a white paper showing the 'human driver crash rate' we use as a safety benchmark,' Cruise co-founder and CEO Kyle Vogt said in a post on X. 'This is the most accurate study of human driving performance ever conducted, showing that Cruise's self-driving cars outperform humans in comparable driving environments.'
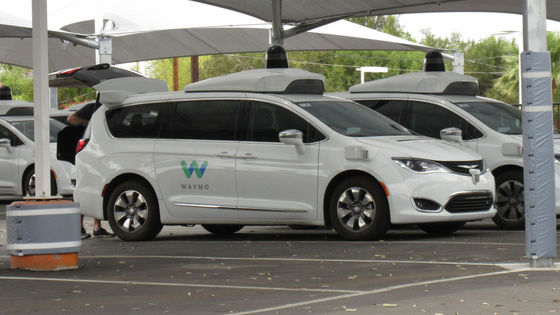
GM collaborated with America's leading transportation research centers, the University of Michigan Transportation Research Institute and the Virginia Tech Transportation Research Institute, to conduct a study to measure human driving performance in urban environments.
The data used in the study was collected between 2016 and 2018 by the University of Michigan Transportation Research Institute and the Virginia Tech Transportation Research Institute, using cars from Maven , a car-sharing service owned by GM, and some other drivers who agreed to participate in the study. It was obtained from. The range of driving data is the entire San Francisco area excluding some expressways, and the total driving distance is 5,611,765 miles (approximately 900 km).
Dividing the total distance traveled by the number of accidents that occurred while driving revealed that human drivers cause an accident once every 15,414 miles (about 25,000 km). This translates to 64.9 accidents per million miles (approximately 1.6 million km).
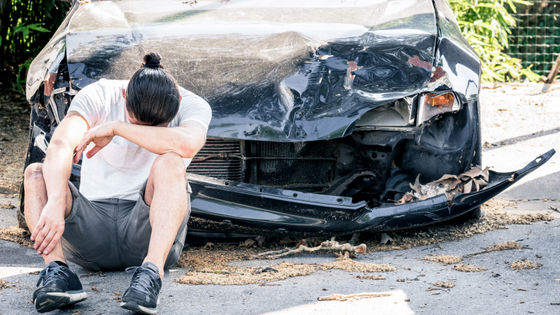
In order to more accurately understand the risk of accidents caused by human drivers, the research team also investigated responsibility for accidents and the risk of injury due to accidents. For example, the risk of injury or death to those involved is vastly different between a minor collision that occurs while waiting at a traffic light and a collision that occurs when the driver runs a red light at high speed.
In order to identify accidents with a high risk of injury, the research team focused on
As a result, it was found that there were 66 Level 2, Level 1, and Level 0 accidents with a high risk of injury. Dividing this by the total distance traveled results in a collision with a risk of injury occurring once every 85,027 miles (approximately 13.7 km), or 11.76 times per million miles. .
In addition, based on traffic accident statistics and available collision data in the United States in 2021, it was concluded that ``vehicles involved in accidents bear approximately 50% of the responsibility for accidents,'' and that It is said that the liability ratio has been offset. Thus, the research team roughly estimates that 32.45 accidents occurred every 30,828 miles (approximately 50,000 km), or 32.45 times over 1 million miles, due to the driver.
Below is a table showing the ``risk of a human driver causing a traffic accident'' derived from this research.
| Miles per accident | Number of accidents that occur in 1 million miles (1.6 million km) | |
|---|---|---|
| All accidents | 15,414 miles (approximately 25,000km) | 64.9 times |
| Responsible accident | 30,828 miles (approximately 50,000 km) | 32.45 times |
| High risk accident | 85,027 miles (approx. 13.7km) | 11.76 times |
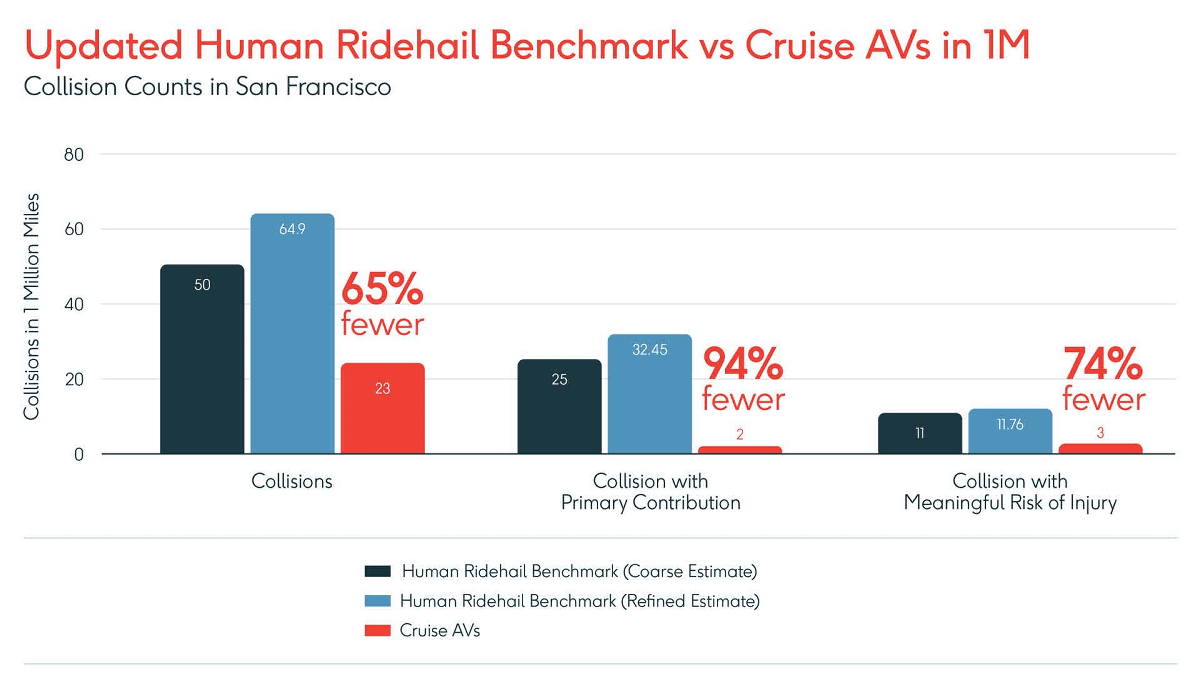
Furthermore, this is a graph that compares this data with accident data collected by Cruise over a total of 1 million miles throughout San Francisco. Red indicates Cruise's self-driving car, which has 23 accidents per million miles, 65% less than humans, 94% less responsible accidents, and 74 accidents with high risk of injury. % decrease.
'This study will help us understand the safety of human driving in the current ride-hailing space and will allow us to better understand the positive safety impact that Cruise brings to our roads,' Vogt said. I did.
This research helps us understand the status quo of human driving safety in the ridehail space, and enables us to better understand the positive safety impact Cruise has on the road. (4/5)
— Kyle Vogt (@kvogt) September 27, 2023
Related Posts: