GitHub publishes 'The State of the Octoverse 2020', a detailed summary of usage such as the number of users and repositories in 2020, popular programming languages and topics
Software development platform
The State of the Octoverse 2020 --The GitHub Blog
https://github.blog/2020-12-02-the-state-of-the-octoverse-2020/
The State of the Octoverse | The State of the Octoverse explores a year of change with new deep dives into developer productivity, security, and how we build communities on GitHub.
https://octoverse.github.com/
In 2020, the pandemic of the new coronavirus has moved people around the world to remote work. This has led many companies to connect with open source software developers. 'The State of the Octoverse 2020' is a report that summarizes detailed figures for such a special year. The data aggregation period is from October 2019 to September 2020.
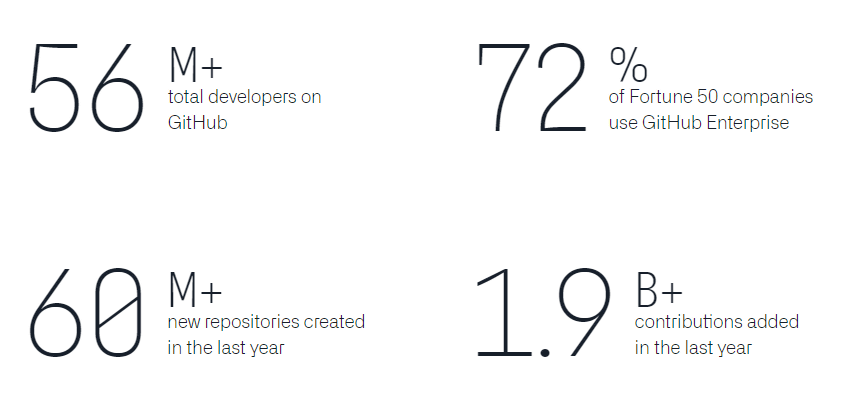
The total number of developers using GitHub during the aggregation period is over 56 million, the adoption rate of GitHub Enterprise in the top 50 'World's Most Admired Companies 2020' selected by Fortune is 72%, and the newly created repository is 6000 Over 10,000, the total number of contributions by all users is over 1.9 billion.
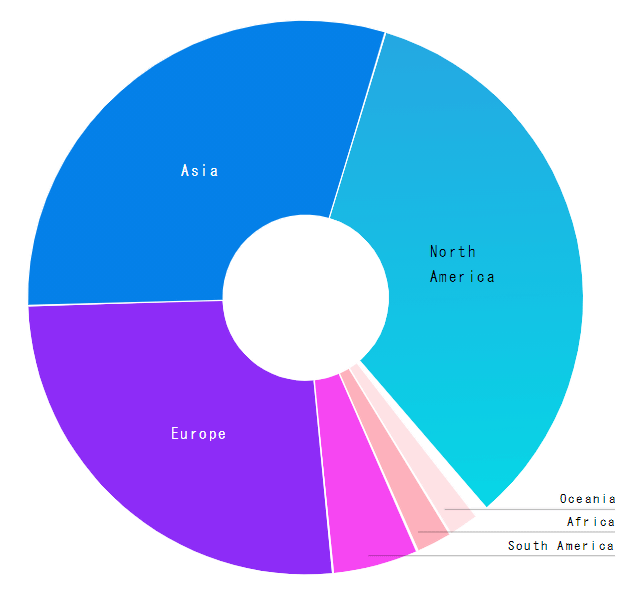
The breakdown of users by region is 34% in North America (down 2% from the previous year), 30.7% in Asia (up 1.1% from the previous year), 26.8% in Europe (up 0.1% from the previous year), and 4.9% in South America (up 0.1% from the previous year). (0.4% increase from the previous year), 2% in Africa (0.3% increase from the previous year), 1.7% in Oceania (no change from the previous year).
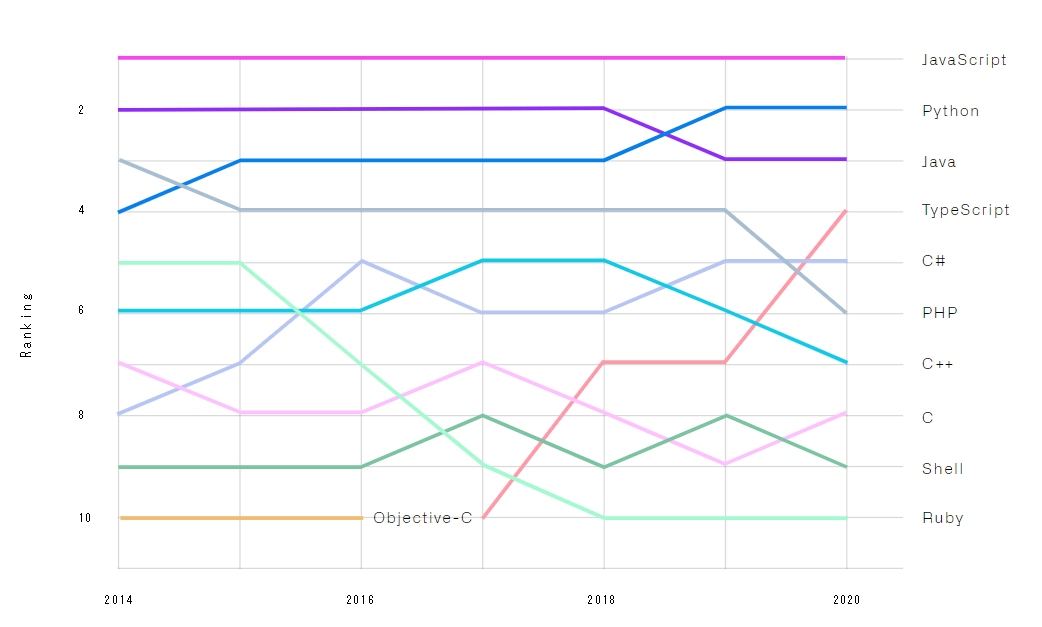
The most popular programming languages on GitHub are: JavaScript has been the number one for seven consecutive years since 2014, with Python in second, Java in third, TypeScript in fourth, C # in fifth, PHP in sixth, C ++ in seventh, and eighth. Is C language, 9th place is Shell, and 10th place is Ruby.
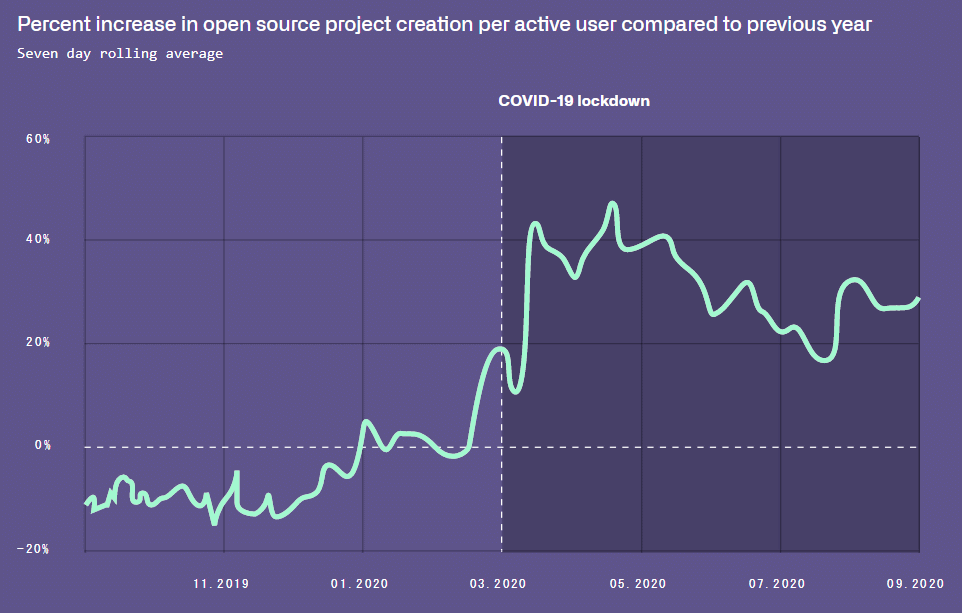
The graph below shows the rate of increase / decrease in the number of open source projects created per active user compared to the previous year. We can see that the pandemic of the new coronavirus has increased the open source project creation rate by up to nearly 50% since March 2020, when lockdowns began to take place around the world.
The graph below shows how much OSS contributions make up of the whole line chart, and the bar chart shows the user's development time by day of the week. Development time is measured by measuring the time between the first and last pushes on the branch. Development time has increased year-on-year on all days, with the longest development time being Wednesday and the shortest development time being Saturday. On the other hand, you can see that the percentage of OSS contributions is much higher on Saturday, when the development time is the shortest.

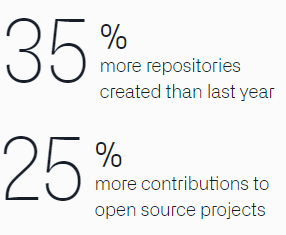
Year-over-year, repository creations increased 35% and open source project contributions increased 25%.
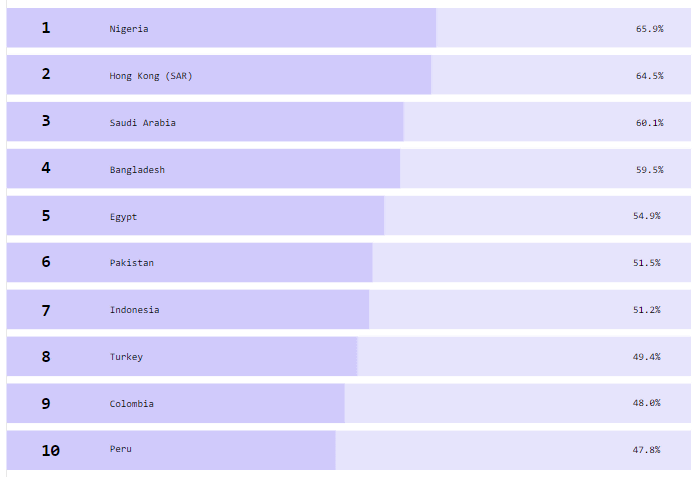
The number of contributors increased in the following 10 countries compared to the previous year. Nigeria (up 65.9%) has the largest number of contributors, followed by Hong Kong (up 64.5%), Saudi Arabia (up 60.1%), Bangladesh (up 59.5%), Egypt (up 54.9%) and Pakistan (up 54.9%). 51.5% up), Indonesia (51.2% up), Turkey (49.4% up), Colombia (48.0% up), Peru (47.8% up).
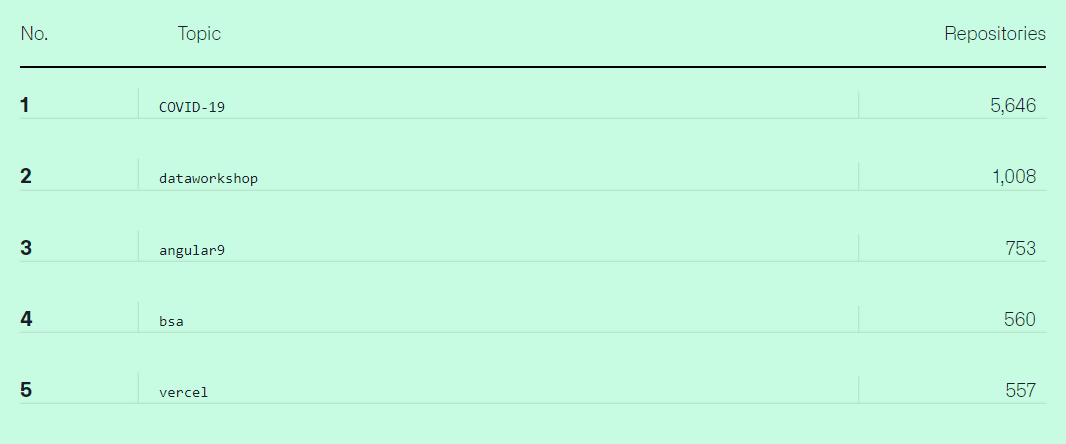
Comparing the number of repositories by topic, we can see that the number of projects related to Severe Acute Respiratory Syndrome (COVID-19) is overwhelming.
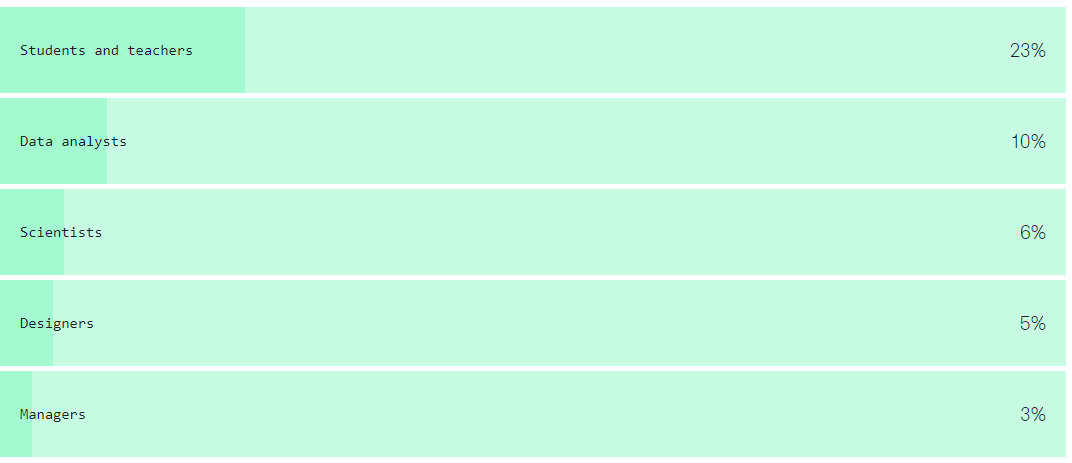
The most common users of GitHub are students / teachers (23%), followed by data analysts (10%), scientists (6%), designers (5%), and managers (3%). I will. The active user rate of teachers is very high at 73%, but the active user rate of students is 32%.
Released in May 2020, 'GitHub Discussions', which adds a bulletin board-type community function on the GitHub page, was experimentally introduced on the
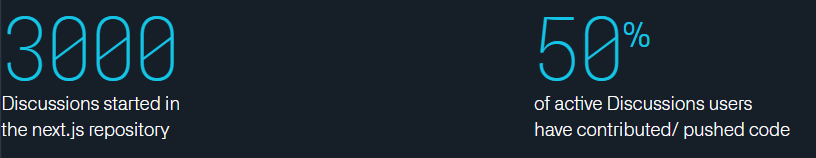
The graph below shows how the number of threads increased over time on the bulletin board provided on the Next.js repository.

In the graph below, the line graph shows the number of new users by action, and the bar graph shows the account retention rate by the first action taken by the new user. Push is the overwhelming majority of new users' first actions. The retention rate of new push users is 49%, which indicates that about half of the new users will continue to use GitHub. The highest retention rate is for pull request reviews (73%), and the lowest retention rate is for issue creation (23%).

Most projects on GitHub rely on open source software. The graph below shows the percentage of active repositories that rely on open source. The most dependent is JavaScript (94%), the most popular programming language on GitHub.

In addition, GitHub also distributes the download version of 'The State of the Octoverse 2020' on the following page, and the download version contains more detailed contents that are not mentioned on the page, so I'm curious People should check it out.
The State of the Octoverse | The State of the Octoverse explores a year of change with new deep dives into developer productivity, security, and how we build communities on GitHub.
https://octoverse.github.com/
Related Posts:


in Web Service, Posted by logu_ii