What is the mechanism and basis for Google's 'COVID-19 Infection Prediction (Japan Version)', which shows the number of new corona infections and deaths over the next 28 days?
Regarding the new corona infection number / death number prediction tool '
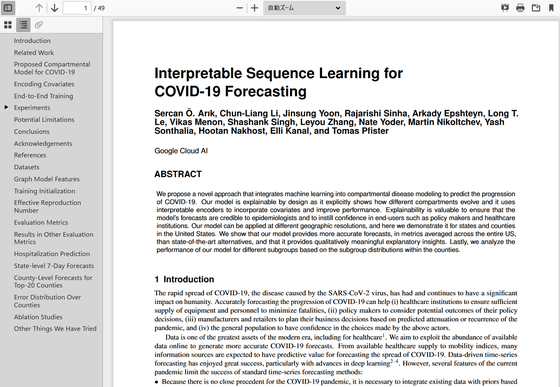
Interpretable Sequence Learning for COVID-19 Forecasting
(PDF file) https://storage.googleapis.com/covid-external/COVID-19ForecastWhitePaper.pdf
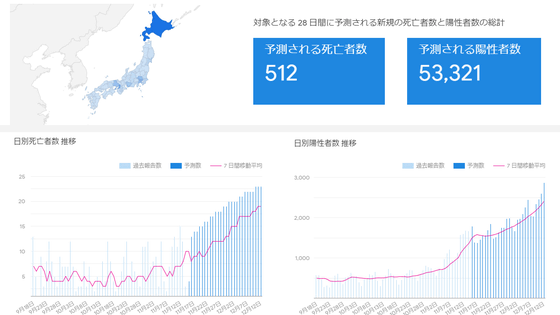
On November 17, 2020, Google's tool for predicting the number of deaths, positives, hospitalizations, medical treatment, etc. of the new coronavirus infection (COVID-19) in Japan 'COVID-19 infection prediction (Japan version)' Has been released.
Google has released 'COVID-19 Infection Prediction (Japan Version)' that shows how the number of new coronavirus infections in Japan will change in the next 28 days, and the number of deaths, positives, hospitalization, medical treatment, etc. predicted in 28 days Numbers are also posted-GIGAZINE
The core of the algorithm that is the basis of this COVID-19 infection prediction (Japan version) is ' SEIR, ' which is a mathematical model for infectious disease epidemics. SEIR is 'Susceptible', 'Exposed', 'Infectious', 'Recovered' after recovering from the infectious disease. ) ”Is used as a variable to analyze the epidemic situation of infectious diseases. In this COVID-19 infection prediction,“ Undocumented infected (unidentified infected person) ”and“ Hospital resource usage (hospital resource usage rate) ) ”Is also added to the analysis.
Below is a diagram that considers the mutual effects of these four elements of SEIR and the newly added 'unidentified infected persons' and 'resource utilization rate of hospitals'. The variables are 'number of contacts of unidentified / confirmed infected persons', 'reinfection rate', 'reverse incubation period', 'diagnosis rate', 'ratio of COVID-19 infected persons in hospital', and 'intensive treatment room (ICU)'. 'Usage rate', 'ICU artificial respirator usage rate', 'Recovery rate of unidentified infected persons / confirmed infected persons', and 'Death rate of unidentified infected persons / confirmed infected persons' are adopted.
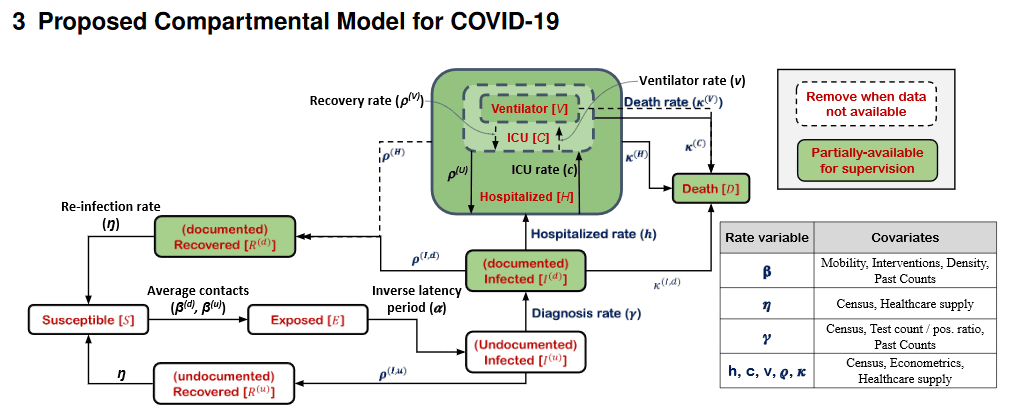
Regarding this model, Google cites that COVID-19 is a disease with a particularly high number of asymptomatic infections, saying that 'unidentified infected individuals should spread the infection until they are diagnosed or recover on their own.' The hospitalization status shall be subdivided into three stages: simple hospitalization, ICU admission, and artificial respirator required. '' Although there is no scientific consensus on the degree of immunity of the recoverer, reinfection Since re-infection has been reported, there is a low probability that reinfection will occur. ”“ All deaths due to COVID-19 shall be found. ”“ The entire population is immutable, and birth Deaths other than COVID-19 shall be ignored. '
In addition, Google has adopted the concept that each function that assigns these variables is not invariant and 'varies with time.' It is said that the function at each time point was dynamically calculated by machine learning, assuming that the change of the function itself can be mapped from the existing observation results.
As it is known that various indicators such as population, health, environment, hospital resources, demographics, economic statistics, etc. have an influence on the epidemic rate of COVID-19, Google has obtained statistics obtained throughout the United States. As ground truth data (accuracy verification required data), forward estimation and backward estimation are applied to covariates, median estimation is applied to static covariates, and machine learning is performed by the
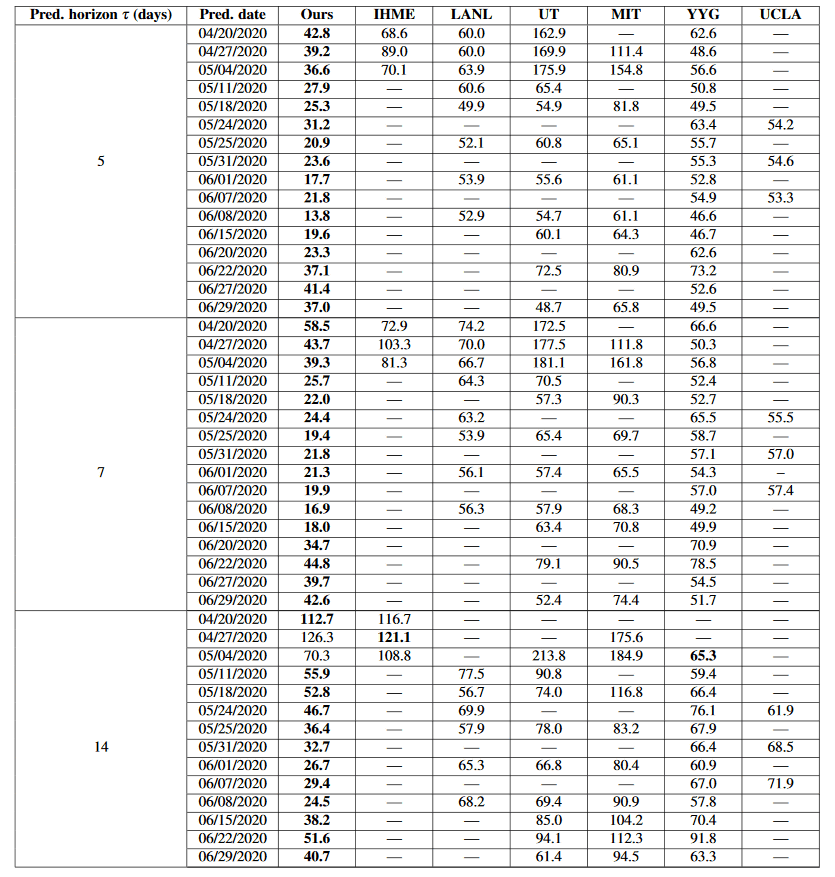
Regarding the prediction results obtained in this way, Google uses prediction models developed by other research institutes such as IHME (Health Index Evaluation Institute) and LANL (Los Alamos National Laboratory) and indicators such as MAE (Mean Absolute Error). We also carry out comparisons to compare. It clarifies that the forecast model developed in-house is superior in various indicators.
Regarding this prediction model, Google may not be completely accurate due to various causes, and if the number of cases fluctuates suddenly, it may fail to capture the fluctuation value. Assuming differences in racial and ethnic prevalence, points that can be seen, under-prediction and over-prediction that may be required when formulating policies such as public policy, socio-economic dynamics, and public health did not work well. It states that various issues remain, such as points excluded from the above and the problem of over-adaptation .
Related Posts:

in Web Service, Science, Posted by darkhorse_log