Which countries in the world are doing the most data communication?

Tefficient analyzing telecommunications carriers has published data on the data traffic volume of SIM cards used in 36 countries around the world in 2017. By looking at this data you can see that "which country is using the most data communication" "which country's data communication is expensive".
(PDF file) Unlimited moves the needle but it's when mobile addresses slow fixed internet that something happens
https://tefficient.com/wp-content/uploads/2018/07/tefficient-industry-analysis-1-2018-mobile-data-usage-and-revenue-FY-2017-per-country-10-July- 2018. pdf
Canadian Telecoms Make the Most Money on Mobile Data in the World - Motherboard
https://motherboard.vice.com/en_us/article/7xq934/canadian-telecoms-make-the-most-money-on-mobile-data-in-the-world
The vertical axis of the graph below shows the monthly data traffic (GB) per SIM card, and the horizontal axis shows the monthly usage fee (Euro) per SIM card. The highest profitability is high in Canada, which is located in the lower right, and the data communication volume is also about 1 GB per month and it is also totally low value. There are only 36 countries with low data traffic from Canada, Portugal, Greece, the Czech Republic, Germany and Belgium.
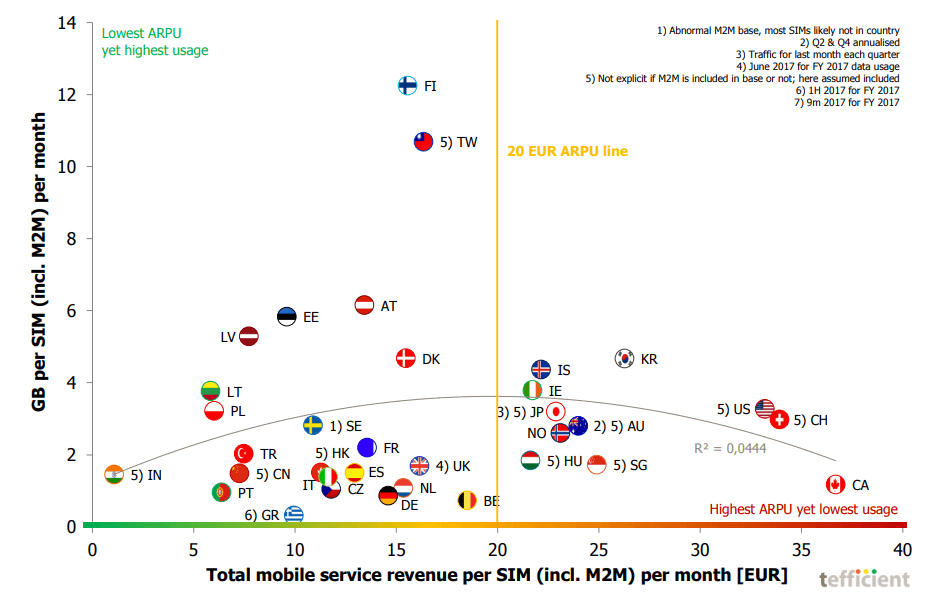
In countries with the largest data traffic per SIM card in the world, the number 1 is ranked more than 12 GB per month in Finland, the number 2 is Taiwan more than 10 GB per month. Japan is ranked 12th with Poland and Switzerland, with data traffic volume of about 3 GB per month, telecom operators earning 23 euros (about 3000 yen) per month.
It is America that has a data communication volume slightly larger than Japan. In the United States, the data traffic per month is about 3.3 GB, but it is about 34 euro (about 4500 yen) with high revenue from telecommunications carriers, which shows that it is a more expensive service than Japan . Conversely, India is the smallest income of telecom operators per month, which is about 35 times smaller than Canada, which is the highest among the 36 countries surveyed .
Next, let's see the trends in countries with large data traffic. In the graph below, the vertical axis shows the monthly data traffic (GB) per SIM card, and the horizontal axis shows the communication usage fee per 1 GB of data communication. Looking at this graph, there is a tendency that "data communication volume becomes larger in countries with lower income in units of GB" located on the left side of the graph, and that there is a relationship with the amount per GB and the data communication volume You can take a look.
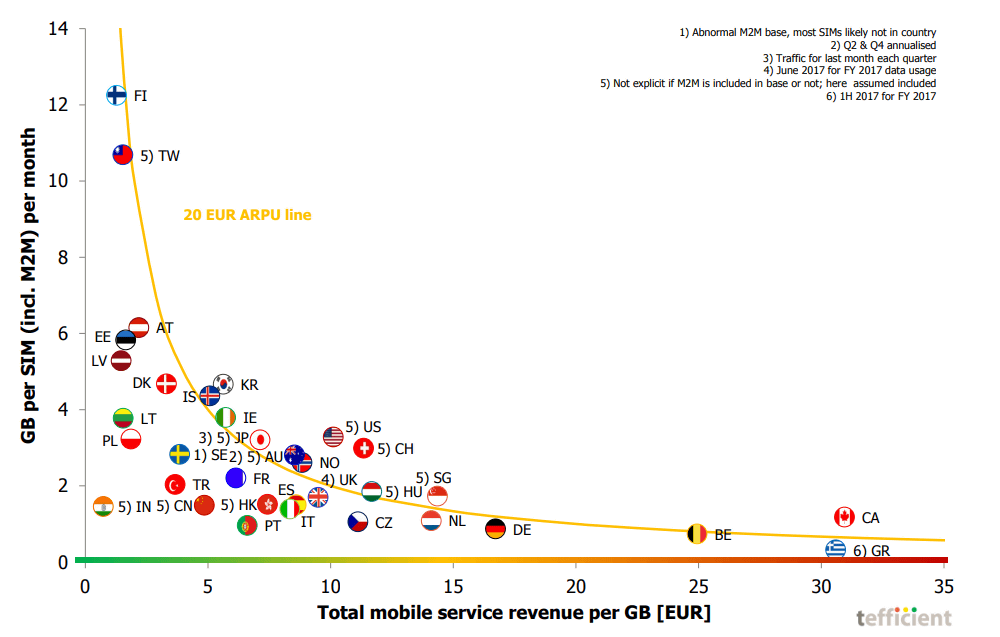
In India, which has the lowest revenue from telecom operators, the revenue per 1 GB is also the lowest in 36 countries, and the data traffic volume in 2017 has increased about threefold from the time of 2016, and this trend will continue in the future It is seen as continuing. In Canada, which has the highest income from the two graphs, this situation is expected to continue also, according to tefficient, "It is unlikely that data traffic will increase for a while."
Related Posts:


in Web Service, Smartphone, Posted by darkhorse_log