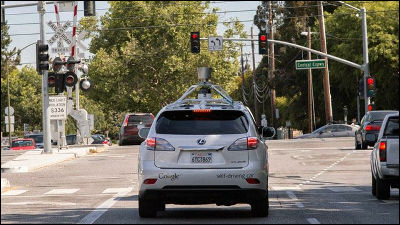
The potential accident verification result of the scene where "Driver unexpectedly grasped handle" with Google automatic driving car will be released
Going forward with the development of an automatic driving car (self driving car), Google has submitted a monthly report on accidents caused by automatic driving cars, but as an annual report in 2015 "Google Self-Driving Car Testing Report on Disengagements of Autonomous Mode December 2015(Google Self Driving Car Test Report on Automatic Operation Mode Cancellation December 2015) ". It is clear that self-driving cars are evolving steadily in this report.
Google Self-Driving Car Testing Report on Disengagements of Autonomous Mode December 2015.pdf
(PDF file)http://static.googleusercontent.com/media/www.google.com/en//selfdrivingcar/files/reports/report-annual-15.pdf
Google self-driving cars would have caused 10 accidents in 2015 without test drivers taking control | 9to5 Google
http://9to5google.com/2016/01/12/googles-self-driving-car-caused-10-accidents-test-drivers-control/
In "Google Self-Driving Car Testing Report on Disengagements of Autonomous Mode December 2015", the cause is considered based on the data on the situation where the driver gripped the handle due to some trouble while driving in the automatic driving mode I will.
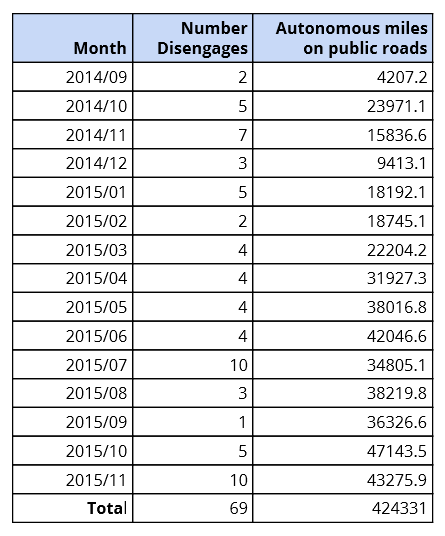
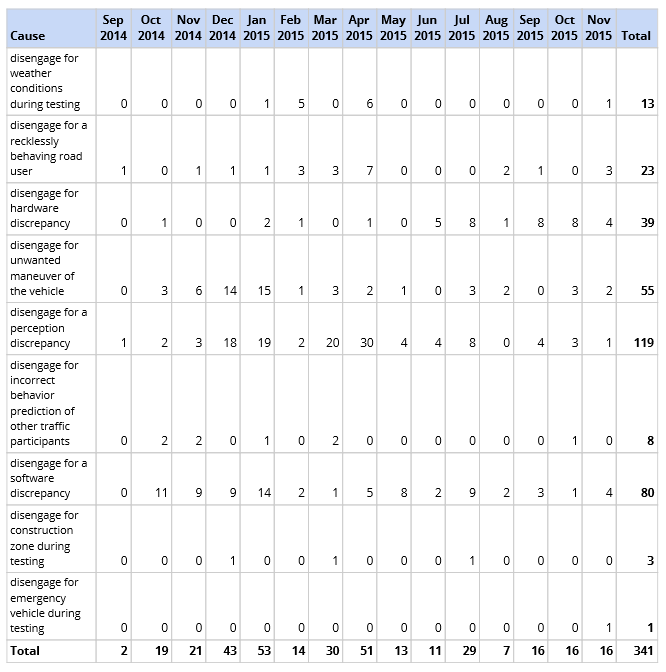
The table below summarizes the trouble occurrence situation during the 15 months from September 2014 to November 2015. "Number Disengages" describes how many times the driver's emergency operation has occurred in each month with automatic driving by a total of 424,331 miles (about 683,000 km) by November 2015. According to this, there seemed to be 69 cases in which the driver caught a handle in 15 months.
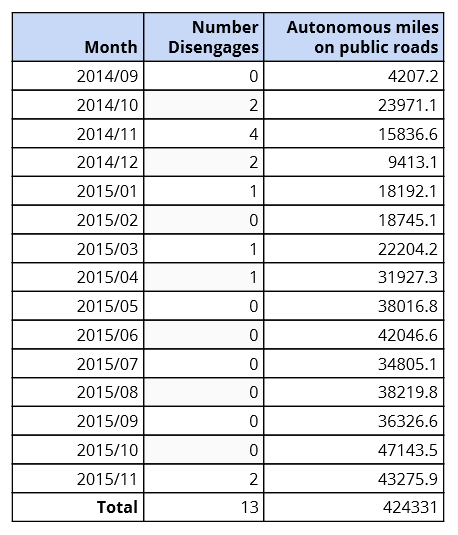
However, it seems that all of 69 cases were not troubles leading to accidents, Google said, "If the automatic operation mode was continued without driver's steering wheel operation at 69 cases ..." was simulated By the way, it concludes that 13 of 69 cases collided with some object including pedestrians. Two of these 13 cases were in contact with the cone, and 10 cases were cases in which the automatic driving car could cause an accident.
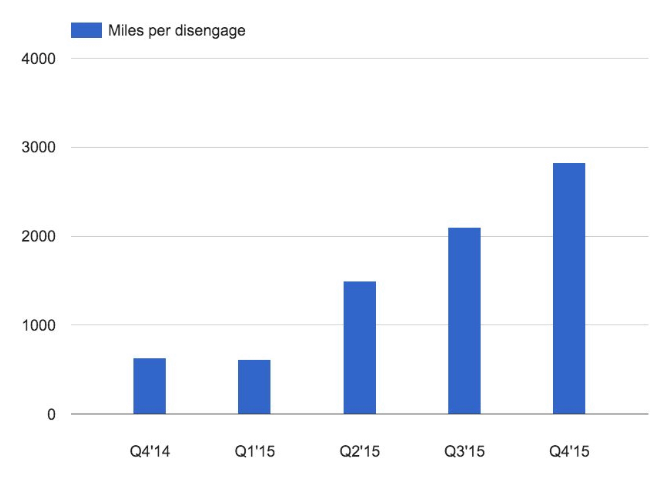
This is a graph showing the average distance that we were able to run until the safety trouble of one of the automatic driving cars quarterly. The distance has been steadily increasing from Q2 (April to June) in 2015, but after that, you can see that the distance is shrinking.
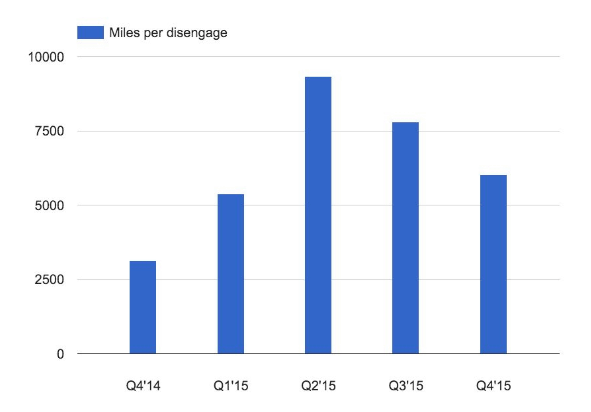
However, if it limits it to only those having a technical cause out of trouble one change. The distance that automatic travel can run without accidents has increased, and it can be seen that the level of technology steadily progresses.
Results of investigating all troubles by cause are also made public. From the top, the columns are "Weather" "Others 'Carelessness" on the Street "Hardware" "Unexpected Operation Mistakes" "Misrecognition" "Mispredictions of Others' Movement" "Software" "Construction" In "emergency vehicles", the most mistakes are recognized mistakes, the next most problems are software troubles.
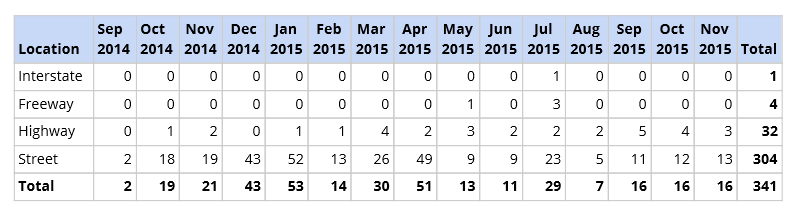
Data by driving scene. The rows are "interstate freeway" "freeway" "highway" "urban" from the top, it seems that there are overwhelming troubles in town.
Google intends to further enhance the safety of the automatic driving car by utilizing this simulation.
Related Posts: