The new coronavirus countermeasure may be fatal if `` one day of delay '', predicting the future with a graph like this
Information on the new type of coronavirus infection (COVID-19) is updated daily, but it is difficult to grasp the situation correctly until time has passed. In fact, the number of infected people in Hubei Province, China, was quite different between 'the data released by the authorities at the time of the outbreak' and 'the real figures you can look back on later.'
Coronavirus: Why You Must Act Now-Tomas Pueyo-Medium
https://medium.com/@tomaspueyo/coronavirus-act-today-or-people-will-die-f4d3d9cd99ca
'The number of infected people reported by the official' is different from the 'actual number of infected people'
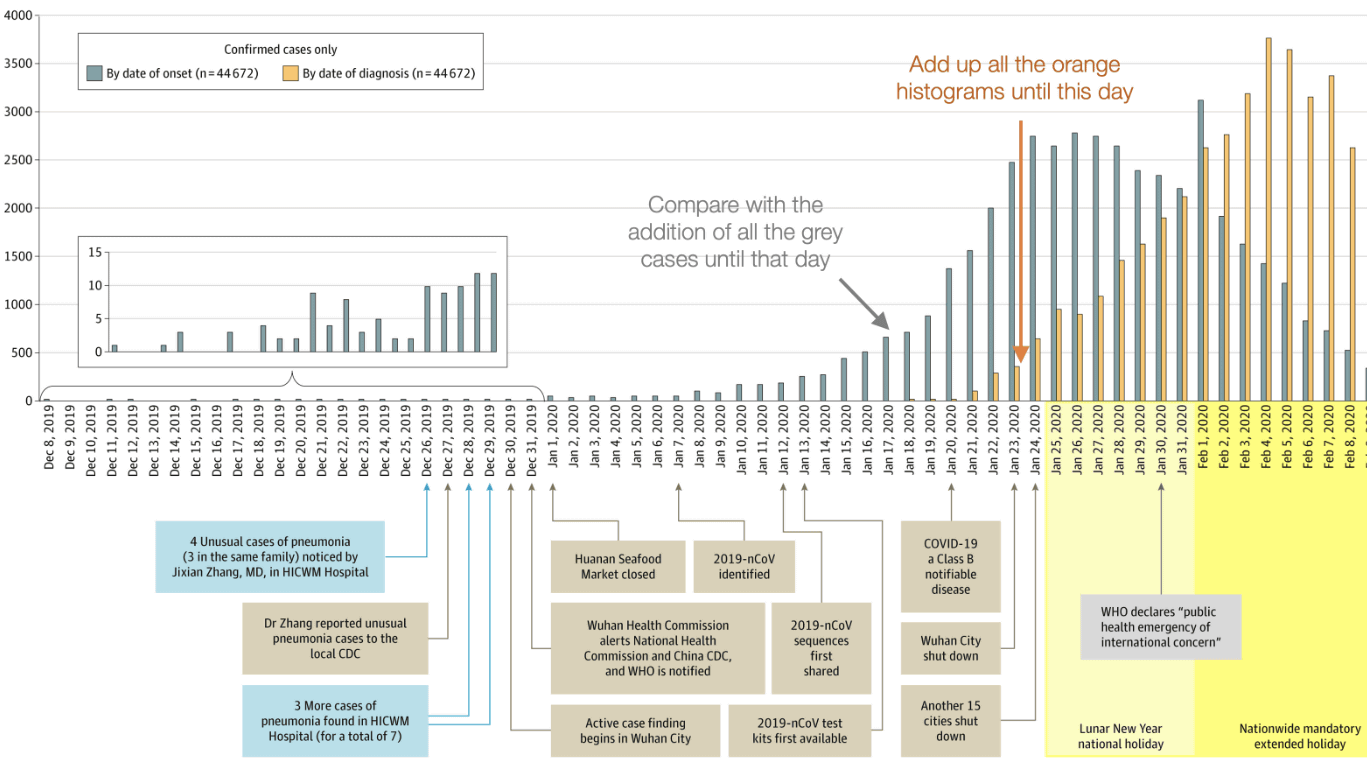
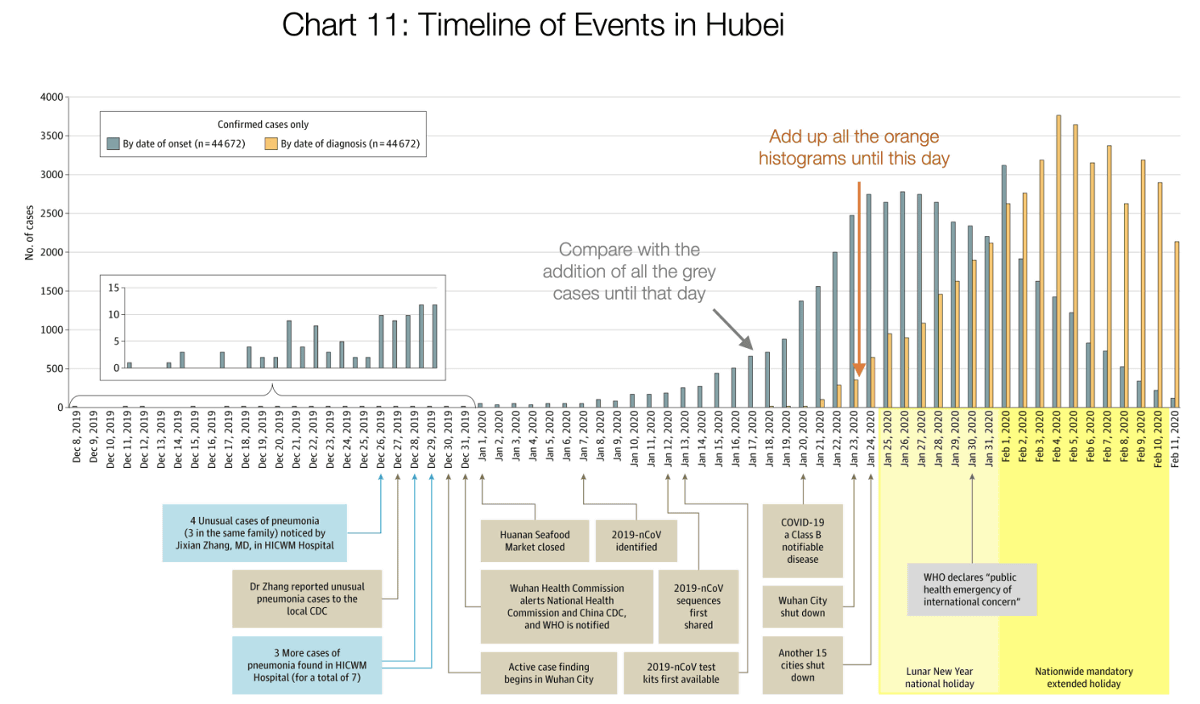
This is a graph created by Pueyo based on a February 24 report from the Journal of the American Medical Association (JMMA) based on case data from the National Center for Infectious Diseases Control in China. The orange graph shows the number of infected people reported daily by Hubei, and the gray graph shows the actual number of infected people. The difference between the two is because the National Center for Infectious Diseases Control asked the diagnosed person, 'When did you have the symptoms?' To confirm the timing of the infection. Looking at the two graphs, you can see that when Wuhan was closed, the official reported 400 infected people a day, but in fact there were already 2500 infected people a day.
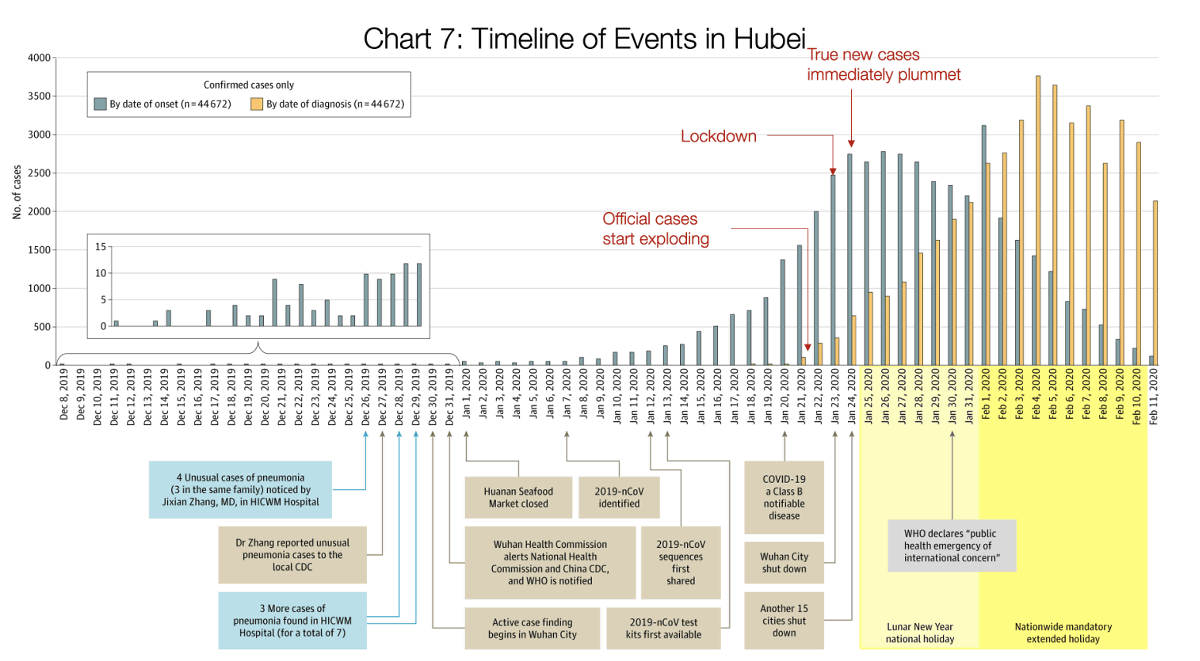
On January 24, the day after the closure of Wuhan, 15 other Hubei provinces were closed. The gray graph is a turning point, and the actual number of infected people is on a downward trend, but it has been increasing exponentially until then. On the other hand, the orange graph is increasing exponentially. This may seem at first glance to be an explosive increase in infection, but it does mean that the condition of the person originally infected has worsened and the number of visits to doctors has increased. Also relevant is the enhanced system for detecting infected people.
Looking outside China's Hubei Province, the graph shows a gradual curve as the government took drastic measures following the epidemic of Wuhan.
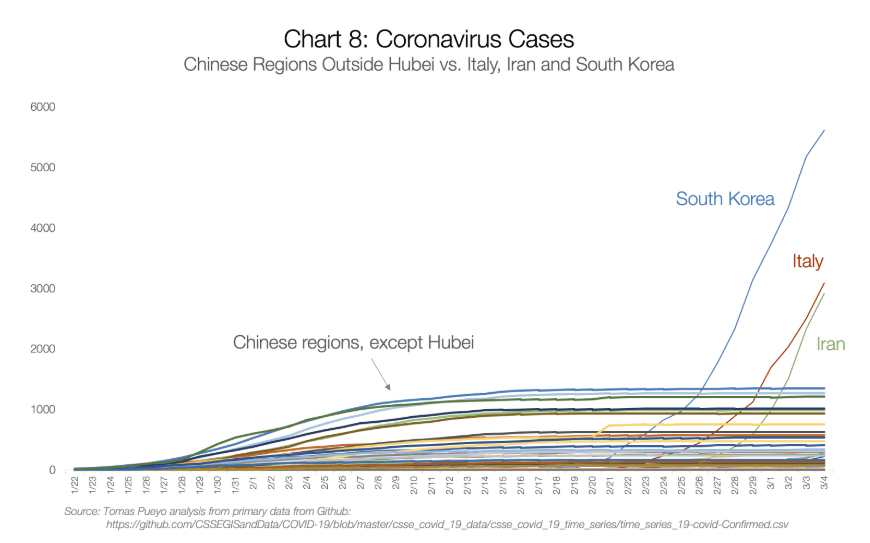
It is
The exception is Korea. The first case was confirmed in South Korea after a 35-year-old Chinese woman was quarantined on January 20. In the following four weeks, 30 people were infected and the situation was relatively mild, but the situation changed because the
Of the Western European countries, Washington is what Pueyo calls “American Wuhan”. The coronavirus fatality rate is said to be between 0.5% and 5%, but it is up to 33% in Washington. This is due to the fact that many people have been tested weeks after infection and the symptoms have worsened, and one out of every three people diagnosed with the new coronavirus infection has died. Is believed to be

Data show that the average time to death for an infected person is 17.3 days. The infection appears to have occurred around February 12, as Washington died on February 29. Assuming a 1% fatality rate, as of February 12, there are about 100 infected people. The doubling time of the new coronavirus is 6.2 days on average, so the number of infected people after 17 days will be calculated by multiplying 100 by 2 to the power of 17/6. As a result, the number of infected people as of February 29 is required to be 700-800.
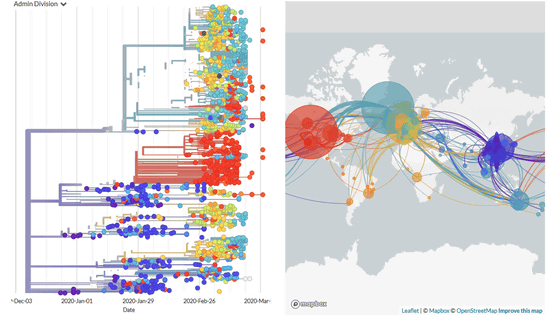
As of March 10, 22 people have died in Washington State, and according to calculations, the number of infected people will be 16,000. However, 19 deaths in Washington were due to one cluster. Considering that the virus is not widely spread, Pueyo says that if these 19 cases are considered one case, fewer than 3,000 people will be infected. As another approach, scientists looking at the virus itself and its mutations have calculated that Washington State has 1,100 infected people as of March 10.
An update about what we're able to infer about the Washington State # COVID19 outbreak from screening and viral sequencing by @UWVirology and @seattleflustudy .
— Trevor Bedford (@trvrb) March 10, 2020
Of course, neither approach is perfect, but 'the common thing is that the actual number of cases is much higher than the official number,' says Pueyo.
Returning to the opening graph again, the total number of infected people by January 22 is 444 in the orange graph, but the total number of gray graphs is about 12,000, which is 27 times the official announcement in reality It shows that there were too many infected people. Given the previous approach, for example, in France, where 1400 cases have been reported, it is estimated that there are 24,000 to 140,000 cases.
◆ Why is there a difference in fatality rate?
The WHO estimates that the fatality rate of the new coronavirus is 3.4%, but it should be noted that the figure of 3.4% changes depending on the situation. Looking at the fatality rate of each country, there is a large difference from 0.6% in Korea to 4.4% in Iran.
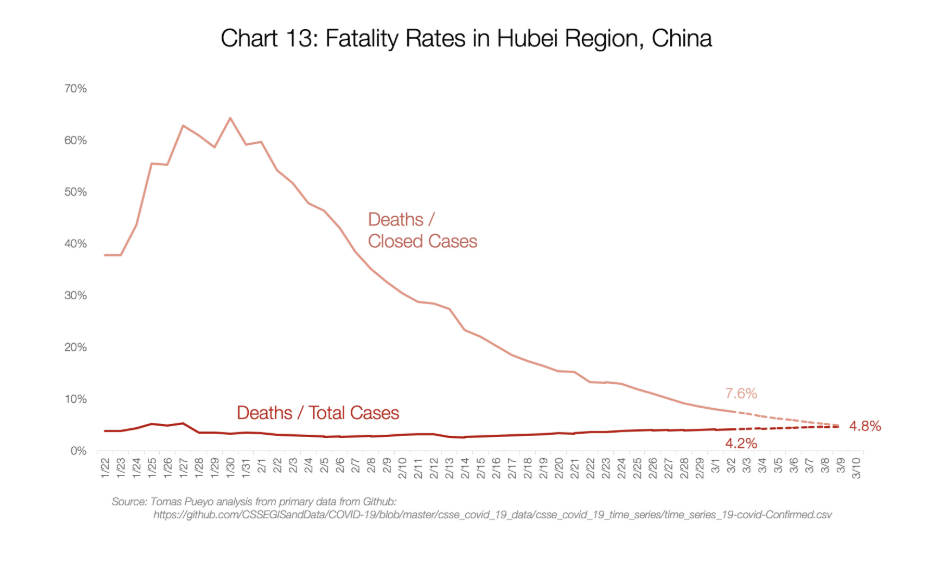
There are two ways to calculate the fatality rate: the number of deaths / infected people and the number of deaths / solved cases.The former is a relatively optimistic figure, but the dead are more likely to be recovered than the recovered ones. The latter tends to be pessimistic numbers, because they are treated first as resolved cases. If all cases are resolved, the number of both will be the same. Then, when Pueyo looked at the transition graph of the fatality rate in Hubei Province, it was predicted that the fatality rate would settle down to about 4.8%. Below, the vertical axis is the fatality rate, the horizontal axis is the date, the orange color is the number of deaths / solved cases, and the red color is the number of deaths / infected people.
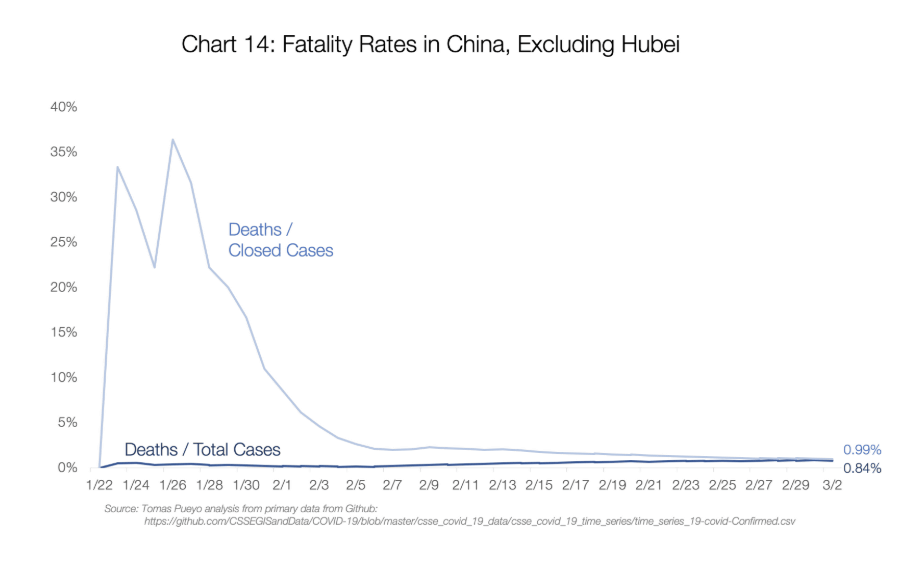
On the other hand, in regions other than China's Hubei Province, the fatality rate is expected to converge to about 0.9%.
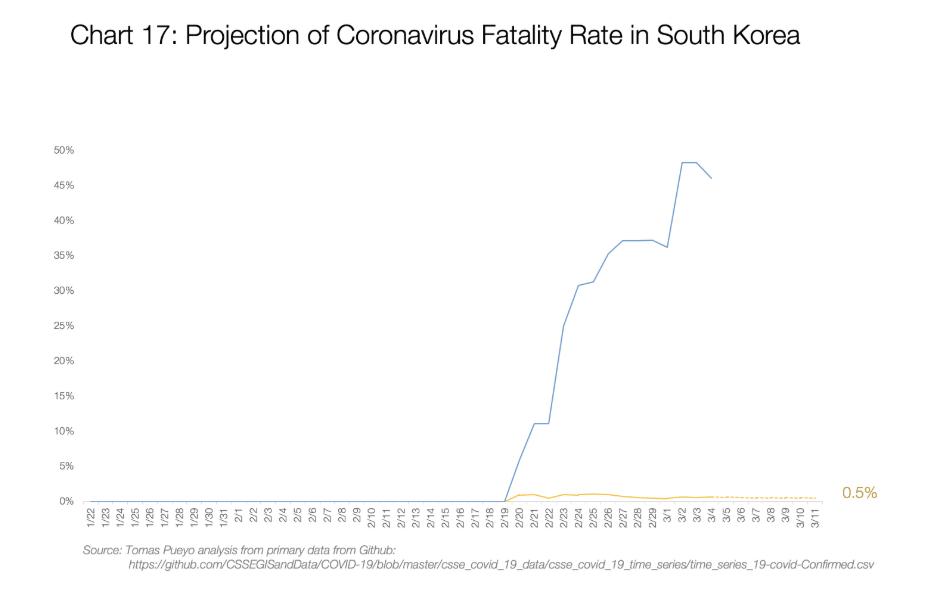
Looking at other countries, Iran and Italy are expected to converge around 3-4%. On the other hand, in Korea, the number of deaths / resolved cases is 48%, and the number of deaths / infected persons is 0.6%, which is a large difference between the two figures. This is related to the fact that Korea has expanded the scope of the examination and is examining many people, and that deaths can be resolved faster than recovery cases. However, looking at the graph, the fatality rate of 'deaths / infected persons' is consistently around 0.5%, and it is expected that this figure will eventually calm down.
What this means is that while ready countries can keep the fatality rate between 0.5% and 0.9%, in unprepared countries the jump rate can jump from 3% to 5%.
◆ What measures will affect the results
For COVID-19, 20% of cases require hospitalization, 5% require intensive care units (ICUs), and 1% require intensive care with ventilators and extracorporeal membrane oxygenators (ECMOs). Must do it. Assuming that 100,000 people were suddenly infected, only 20,000 would need to be hospitalized, 5,000 would need an ICU, and 1,000 would seek respirator and ECMO treatment. However, there are only 250 ECMOs in the United States, and respirators are not easily available items.
Pueyo points out that patients outside of Japan, Singapore, Hong Kong and Hubei Province in China are given the care they need, but not in Western Europe. Italy, in particular, was very similar to the case in Wuhan, where patients rushed to the hospital and treatment was performed in waiting rooms as well as in treatment rooms. As a result, healthcare workers are tired and infected with the virus, but are unable to receive quarantine on the 14th, and in the worst case, die. Pueyo says that this is one reason for raising the fatality rate to 4% instead of 0.5%.
On the other hand, Taiwan is said to be taking very good measures against COVID-19. Taiwan has taken early action with a focus on containment, with only 50 cases reported as of March 10. In Taiwan, quarantine began on direct flights from Wuhan on December 31, 2019, when the Wuhan authorities recognized an outbreak of unknown cause. We conducted an analysis that linked customs and other big data to the
Response to COVID-19 in Taiwan: Big Data Analytics, New Technology, and Proactive Testing | Global Health | JAMA | JAMA Network
https://jamanetwork.com/journals/jama/fullarticle/2762689

Taiwan is currently moving from containment to the mitigation phase. If infections are reduced as much as possible and the healthcare system is able to handle cases with plenty of time, the fatality rate will naturally decrease. By delaying the peak of infection and delaying the development of vaccines, the company will be able to eliminate risks. The more time you spend, the better your healthcare system will be, the lower the fatality rate, and the more people will be vaccinated.
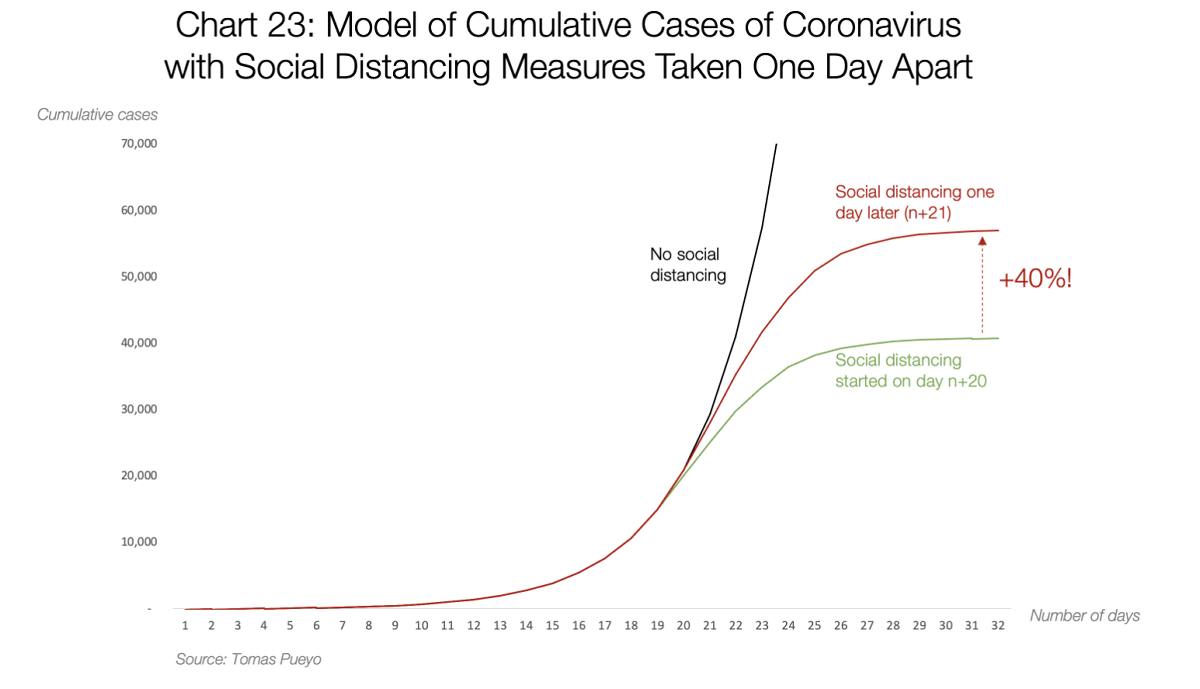
◆ What happens if the decision is delayed by one day?
Pueyo recommends that politicians be closed off and that corporate leaders be given a 'social distance' by directing them to restrict work from home or travel. Mr. Pueyo graphs the effects of a one-day delay in social distance policy from data from Wuhan and others, and suggests the risk of a 'one day delay in decisions' in an exponentially growing graph. The graph shows that just a one-day delay can increase the final number of infected cases by 40%. An increase in the number of infected cases means a higher mortality rate and a higher risk of disruption to the healthcare system, and when combined, Pueyo found that a day's delay caused a considerable number of deaths. Says.
Related Posts:


in Note, Posted by darkhorse_log