Cloudflare reports on how internet usage in various countries changed during the World Cup.
Cloudflare, which operates a global network with over 330 locations worldwide, has reported on how internet traffic changed during the FIFA World Cup 2026.
How the 2026 World Cup affected Internet traffic | The Cloudflare Blog
Cloudflare processes an average of 81 million HTTP requests and 67 million DNS requests per second, and the total number of unique IP addresses connected to Cloudflare's network reached 1 billion per day as of 2020. Thanks to this, Cloudflare can gain insights into internet traffic around the world. Cloudflare Radar is a service that aggregates, visualizes, and publishes this data. Using Cloudflare Radar, Cloudflare is investigating changes in internet traffic during the FIFA World Cup 2026.
One of the factors that influences changes in internet traffic is 'what time the match starts local time.' The biggest changes in activity occur when matches take place from late night to early morning (around 12:00 to 8:00). During this time, there are usually very few people online, so fans staying up late or getting up early to watch the match can cause internet traffic to far exceed normal levels, sometimes more than doubling. As the graph shows, traffic fluctuations peak during this time on both weekdays and weekends.
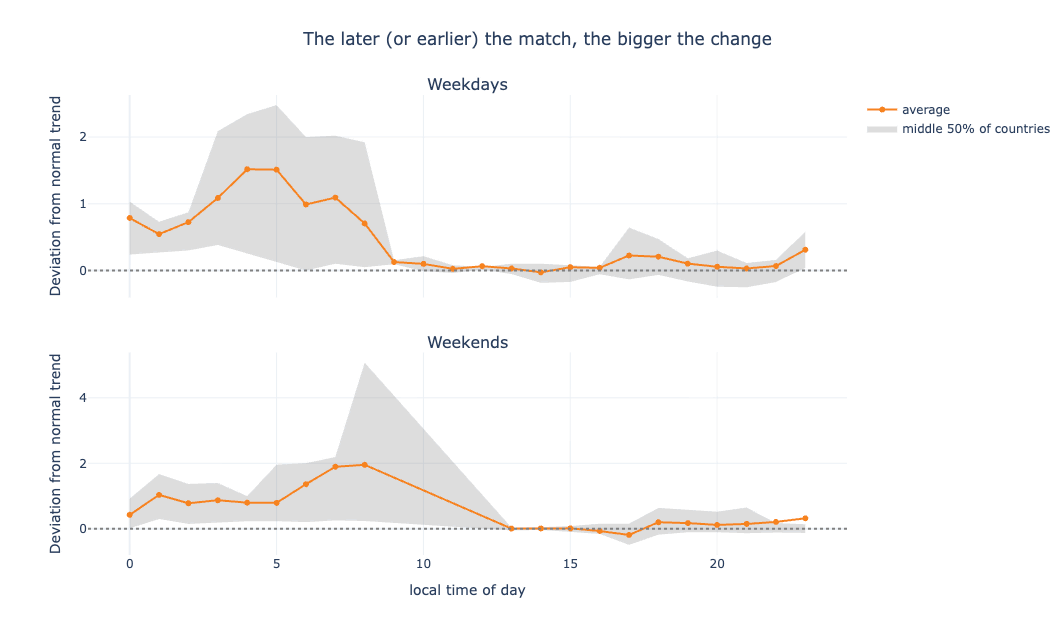
In contrast, there was no significant change in internet traffic for matches held during the daytime or working hours. Traffic remained close to normal levels, which Cloudflare attributed to 'people already being online.'
There was a smaller second surge in traffic in the evening. This is because the game is taking place during a time when traffic would normally be lower, causing people to stay connected to the internet. The same trend is observed over the weekend, with a surge in traffic in the early morning, but the evening surge is not as significant.
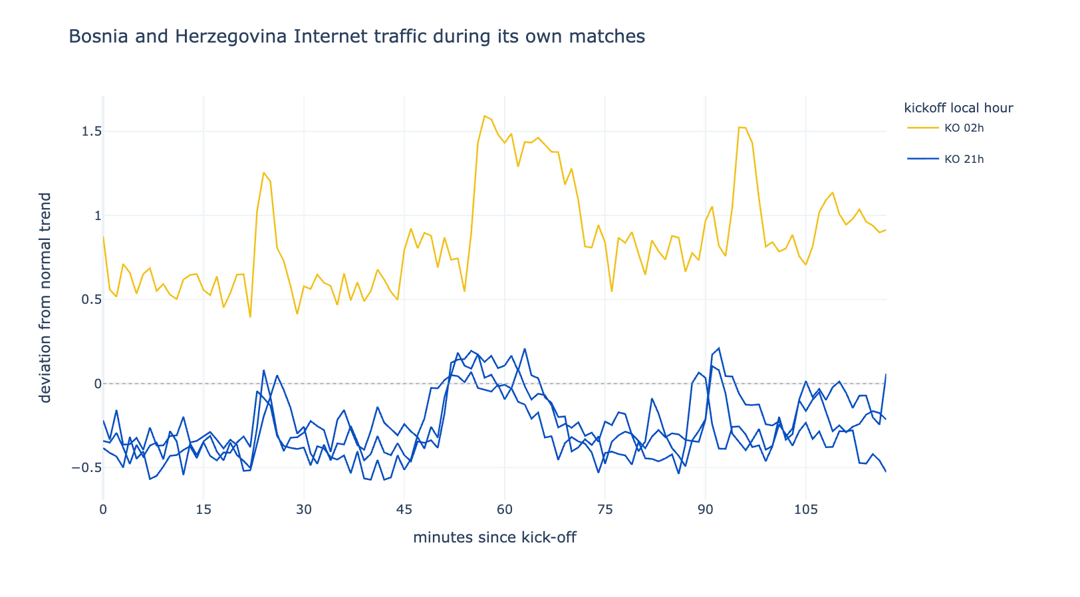
The impact of kick-off time is most clearly seen when comparing situations where matches are played at significantly different times within the same country. Bosnia and Herzegovina is a good example; the graph below shows the change in internet traffic when a match kicks off at 2:00 local time (yellow) and when a match kicks off at 21:00 local time (blue). When matches kick off in the middle of the night, internet traffic increases significantly compared to normal times, while when matches are played during prime time at night, traffic actually decreases compared to normal times.
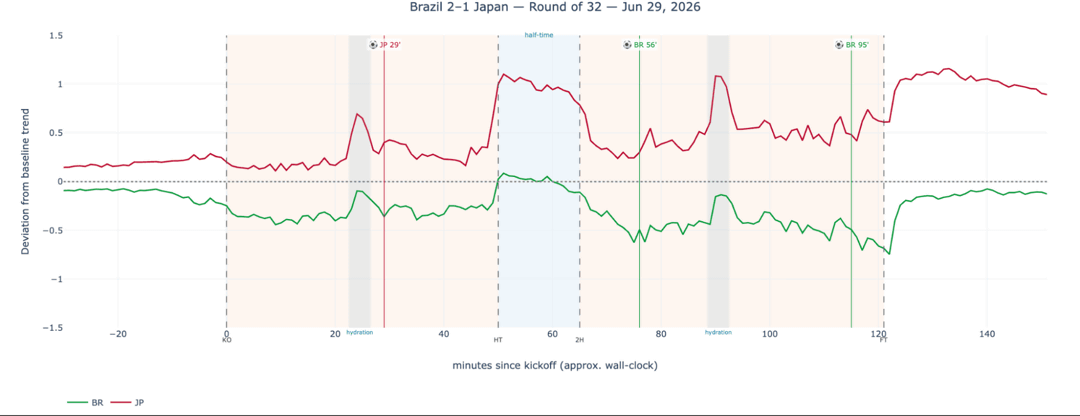
When Japan played Brazil in the Round of 32 of the knockout stage on June 30, 2026, there was a 12-hour time difference between Japan and Brazil. The match took place in the middle of the night in Japan and in the early afternoon in Brazil.
As a result, internet traffic in Japan (red) is higher than normal, while traffic in Brazil (green) is lower than normal. It's particularly clear that traffic surged during halftime in both Japan and Brazil.
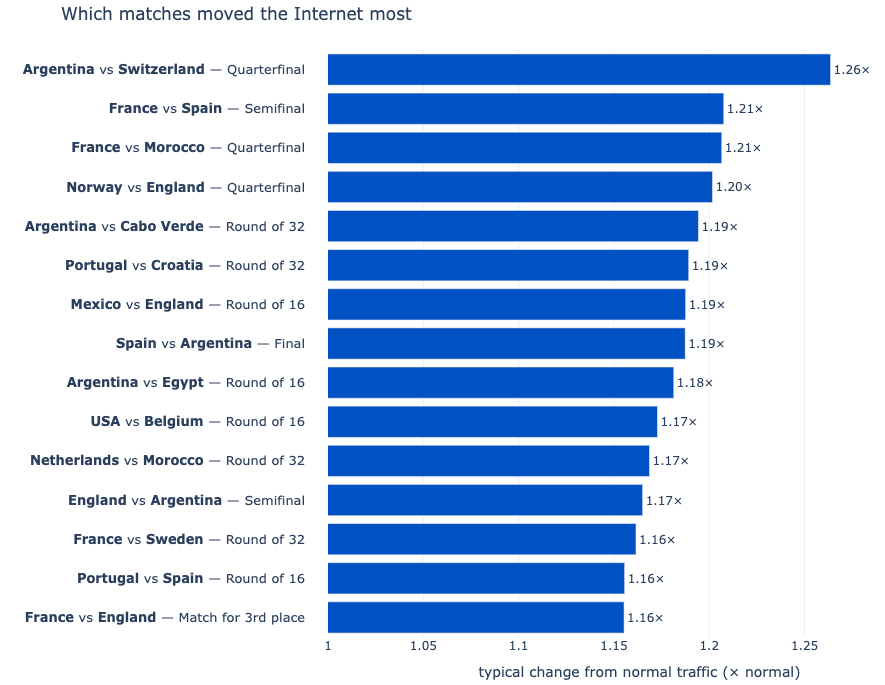
The match that had the biggest impact on internet traffic was the quarter-final match between Argentina and Switzerland. Internet traffic was 1.26 times higher than usual. The top 15 most talked-about matches on the internet are as follows: 5 matches involving Argentina, 4 involving France, 4 involving England, and 3 involving Spain, with a large number of matches involving teams that reached the semi-finals.
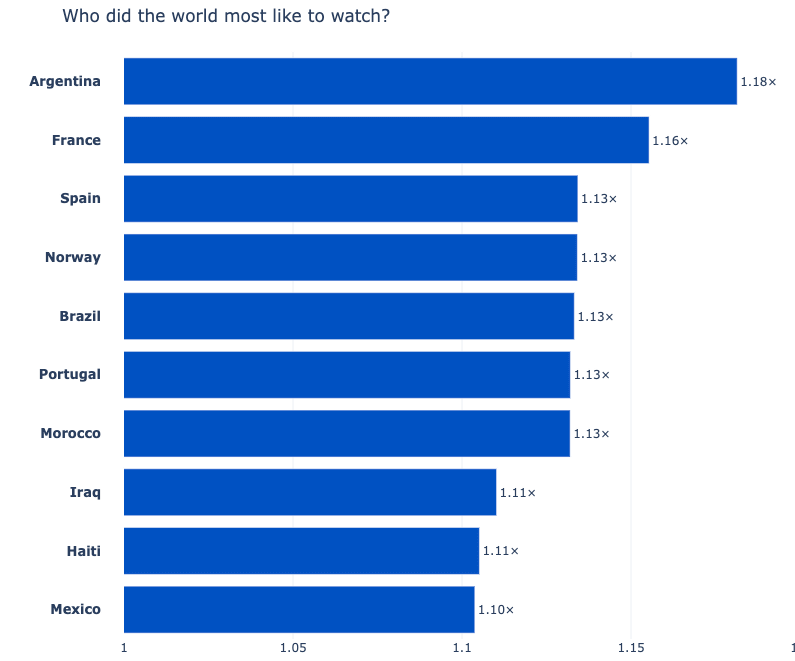
A comparison of changes in internet traffic during matches involving national teams revealed that Argentina was the team that generated the most internet traffic. Of the top four teams, only England did not make it into the top 10.
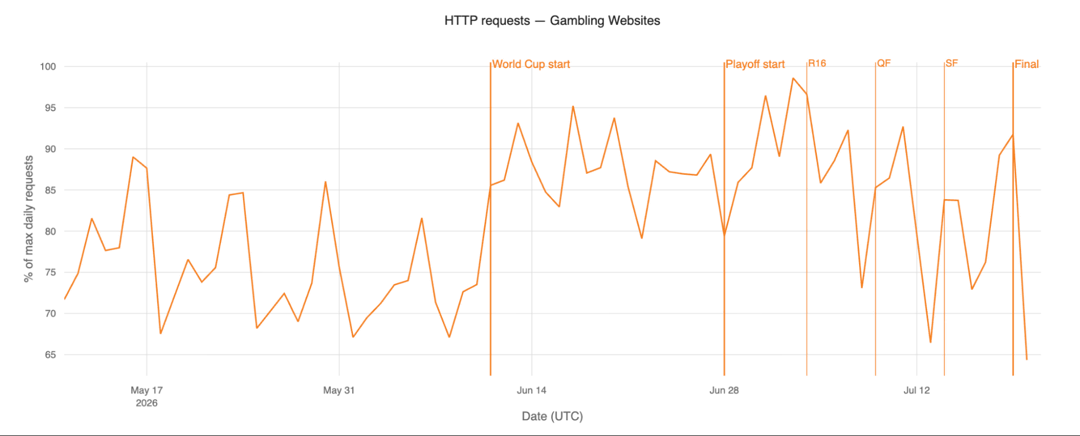
In addition, the number of visits to sports gambling sites also surges during the World Cup.
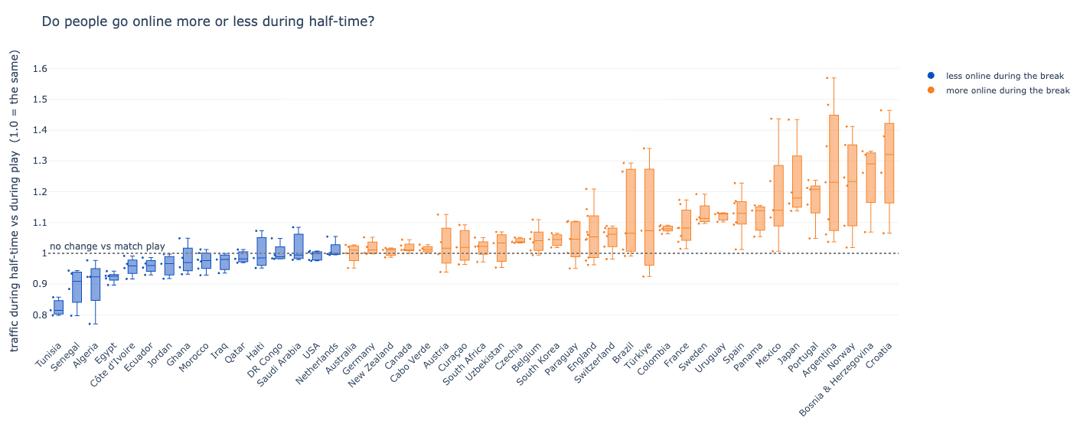
In most countries, traffic increases the moment the game is interrupted at halftime as people take out their mobile phones. This trend is most pronounced in Croatia and Bosnia and Herzegovina. In contrast, in some countries such as Tunisia and Algeria, traffic actually decreases during halftime.
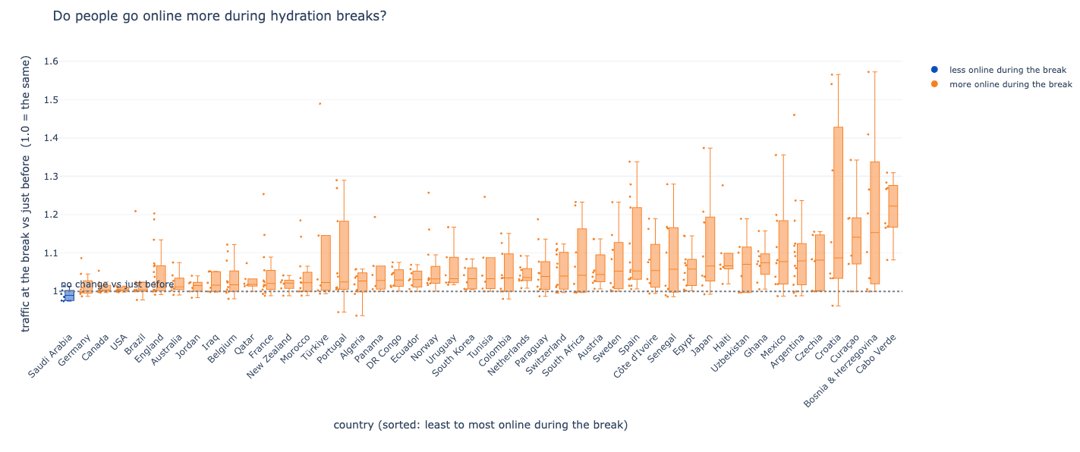
Similar to halftime, internet traffic also surges during the water breaks that occur around the 22-minute mark in each half. This increase in traffic during water breaks was observed in more countries than during halftime.
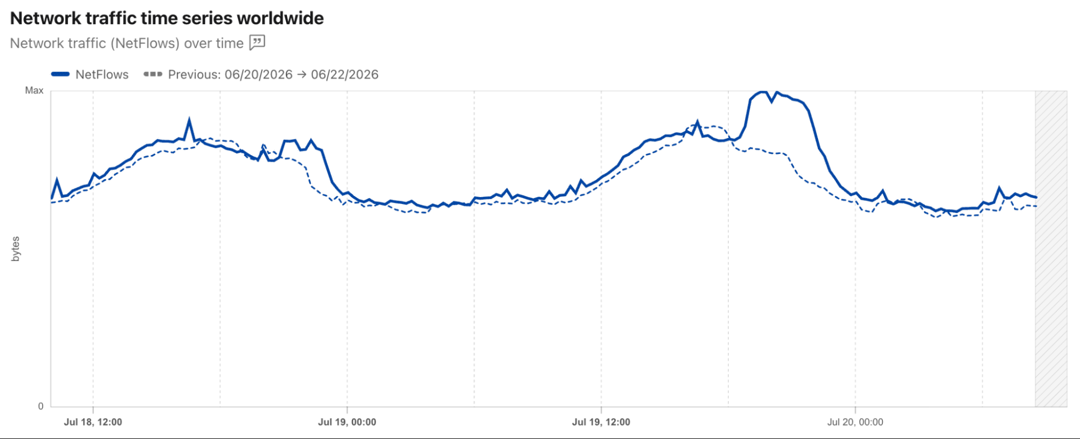
Cloudflare explains that 'given the scale of Cloudflare Radar's global HTTP requests, it's difficult for a single event to leave a visible trace.' Nevertheless, the final match between Argentina and Spain and the third-place match between England and France had a significant impact, enough to affect the internet footprint.
Looking at the HTTP byte count for the period from July 18th to July 20th, it's immediately clear when the final and third-place matches took place.
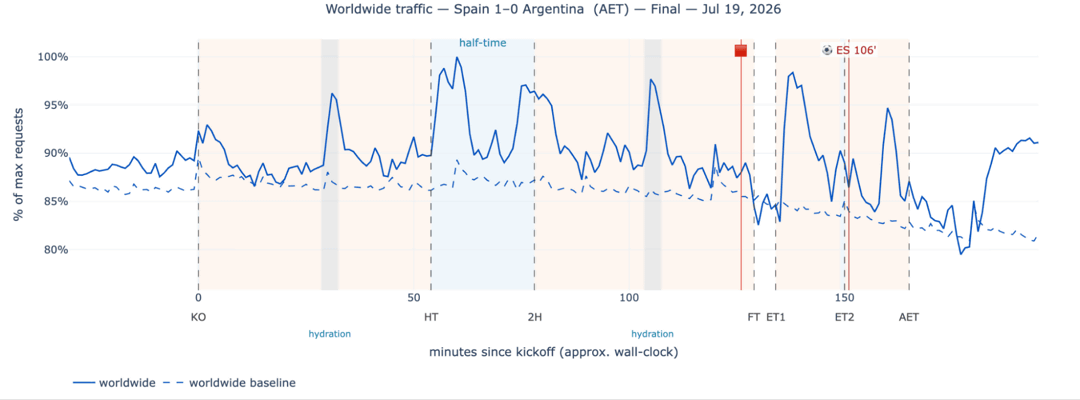
Internet traffic in Argentina and Spain during the final match increased by as much as 20 percentage points compared to normal levels. Traffic also increased during the third-place match, but not to the same extent as during the final.
Related Posts:








in Web Service, Posted by logu_ii