'Last name map' review that allows you to check the national distribution of all kinds of surnames such as 'Sato', 'Suzuki', and 'Ganaha'
It is believed that
Last name map
https://www.dmuchgis.com/myojimap/
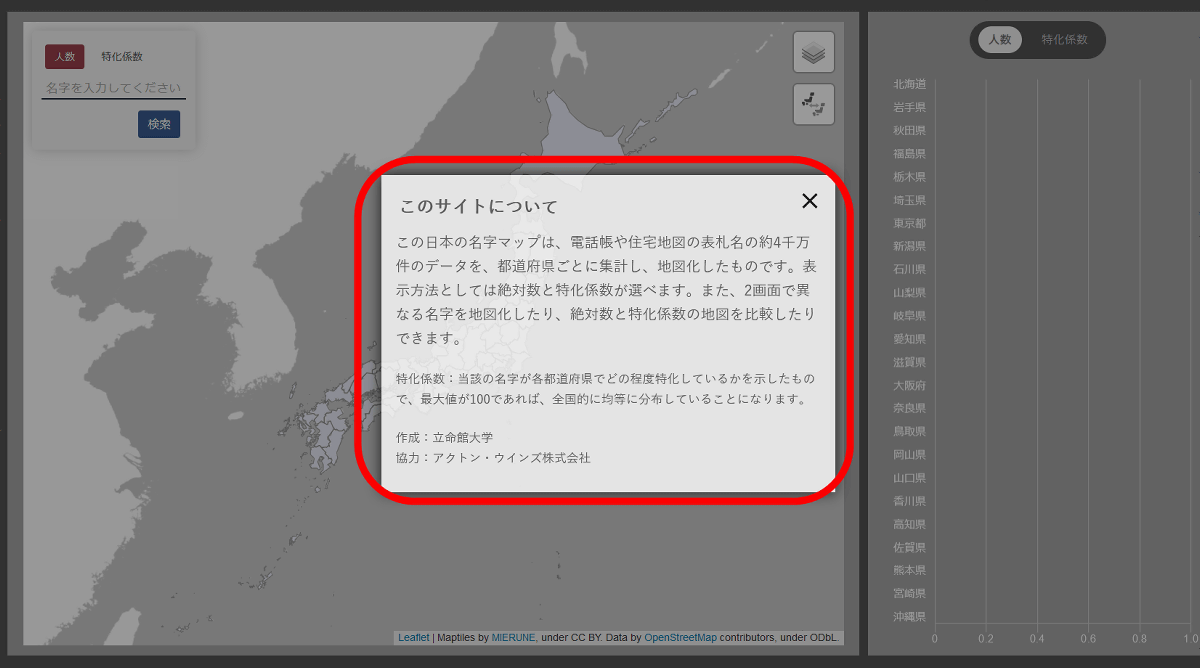
When you access the above URL, you will see the message 'About this site'. The 'Last Name Map' is a compilation and map of about 40 million nameplate names listed in telephone directories and residential maps for each prefecture, and shows not only the absolute number but also the relative degree of accumulation. It is possible to display the specialization coefficient as well. It was created by a team at Ritsumeikan University , with the cooperation of Acton Winds , which manages customer databases and provides data products.
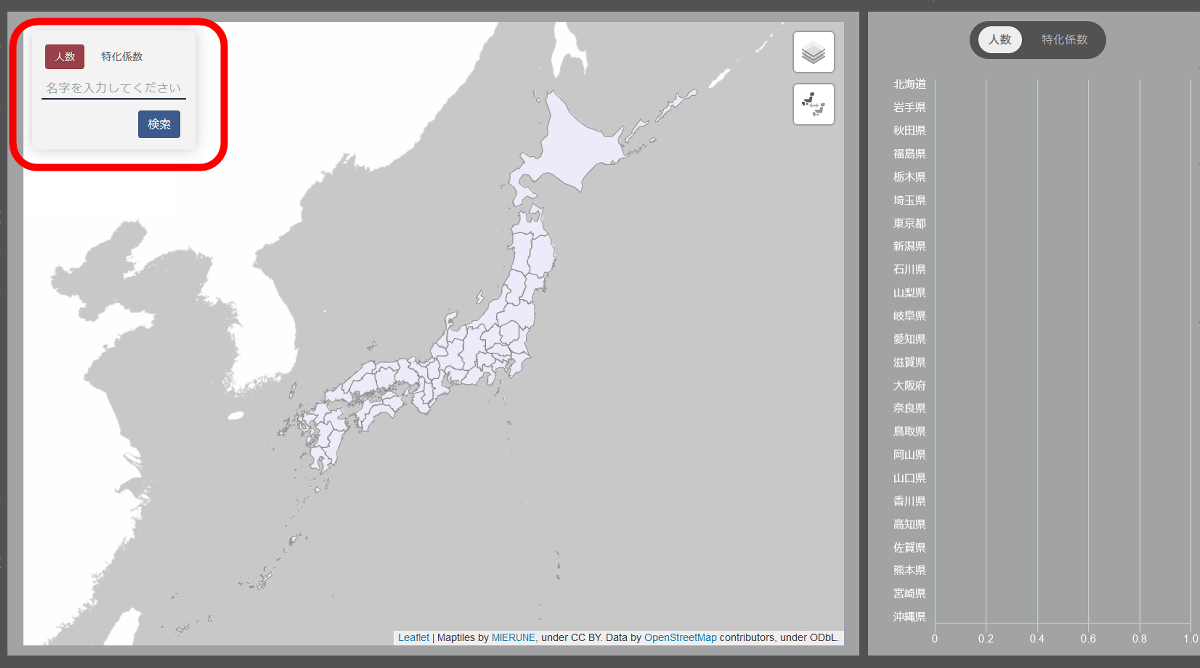
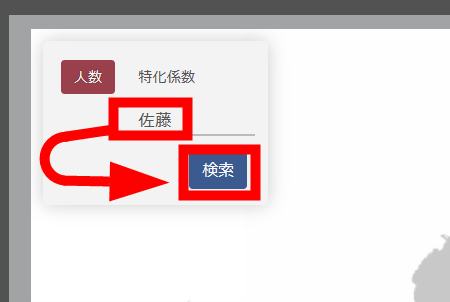
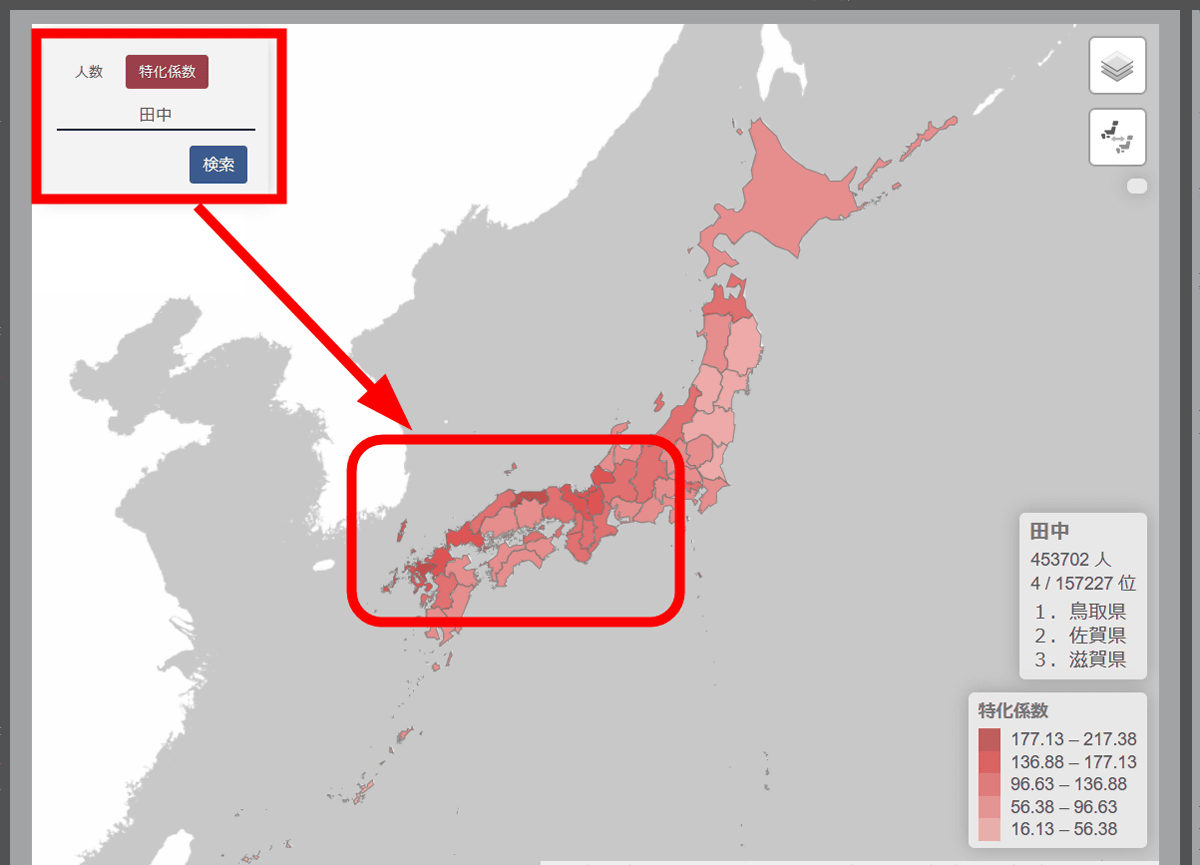
To check the distribution on the surname map, just fill in the last name you want to look up in the form on the upper left of the map.
The prefectures on the map of Japan are color-coded by the number of 'Sato'. The color of the map becomes darker as the number of 'Sato' increases, and it can be confirmed that the map is more distributed in the Kanto and Tohoku regions.
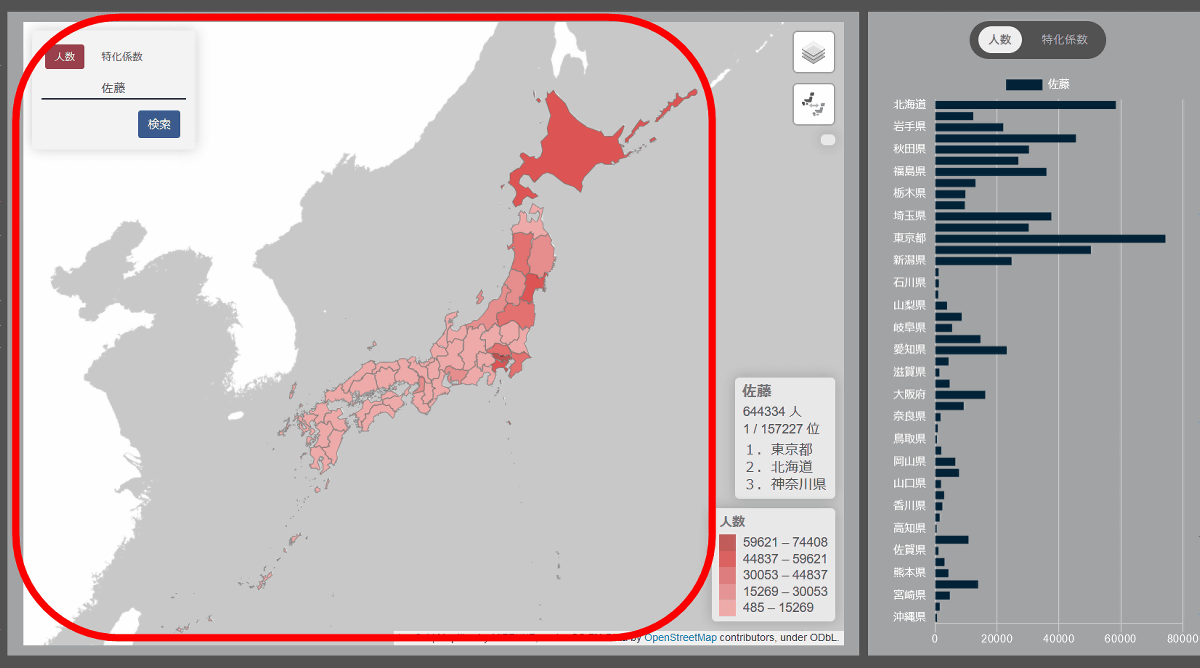
According to the surname map, there are 644,334 'Sato' nationwide, the largest number among all 157,227 surnames, with Tokyo in first place, Hokkaido in second place, and Kanagawa in third place. That thing.

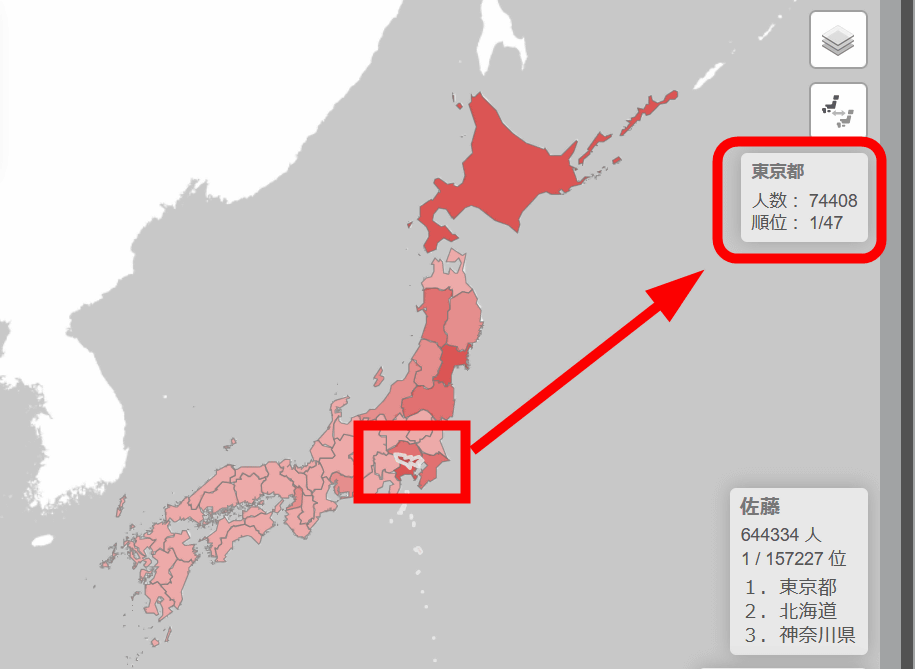
When you move the cursor to the prefecture, the breakdown of the number of people and the national ranking are displayed in the upper right of the map.
Kochi Prefecture has the smallest number of 'Sato' among all prefectures, and the number of people was 485.

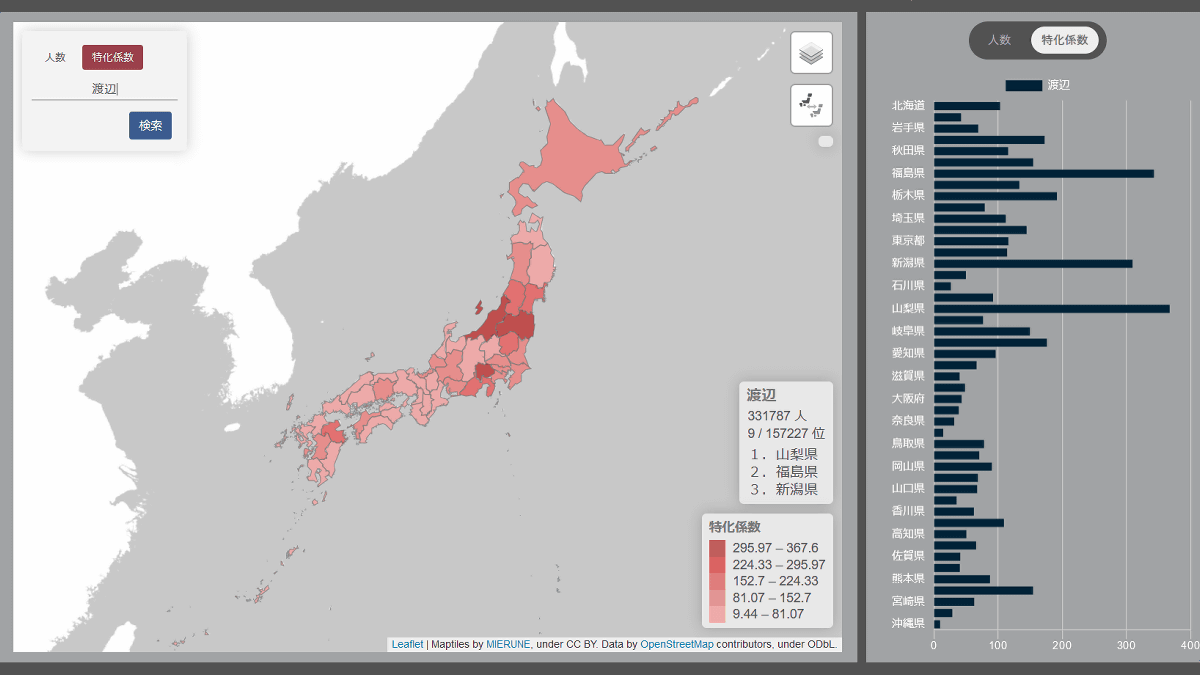
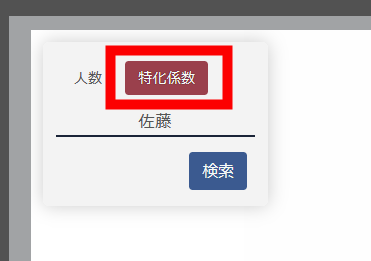
If you switch the display format from 'Number of people' to 'Specialization coefficient' from the form on the upper left ...
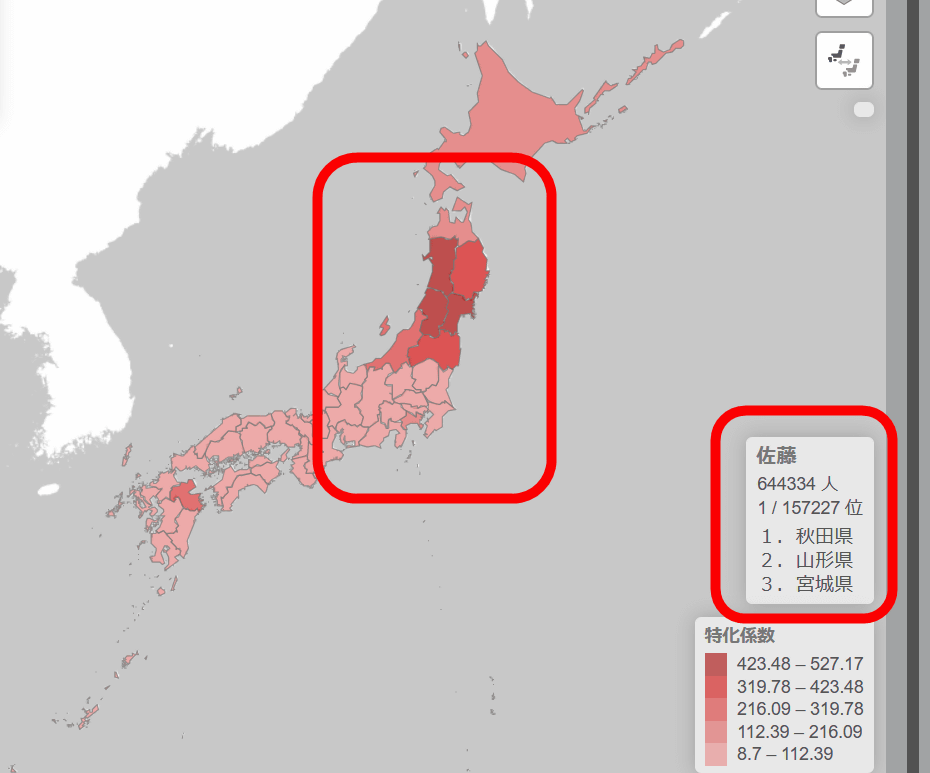
The color depth shows how specialized the surname is for each prefecture. If the maximum value of the specialization coefficient is 100, it means that it is evenly distributed nationwide, but prefectures with more than 100 have a relatively large number of surnames, and prefectures with less than 100 have a relatively large distribution. This means that the surnames are relatively few.

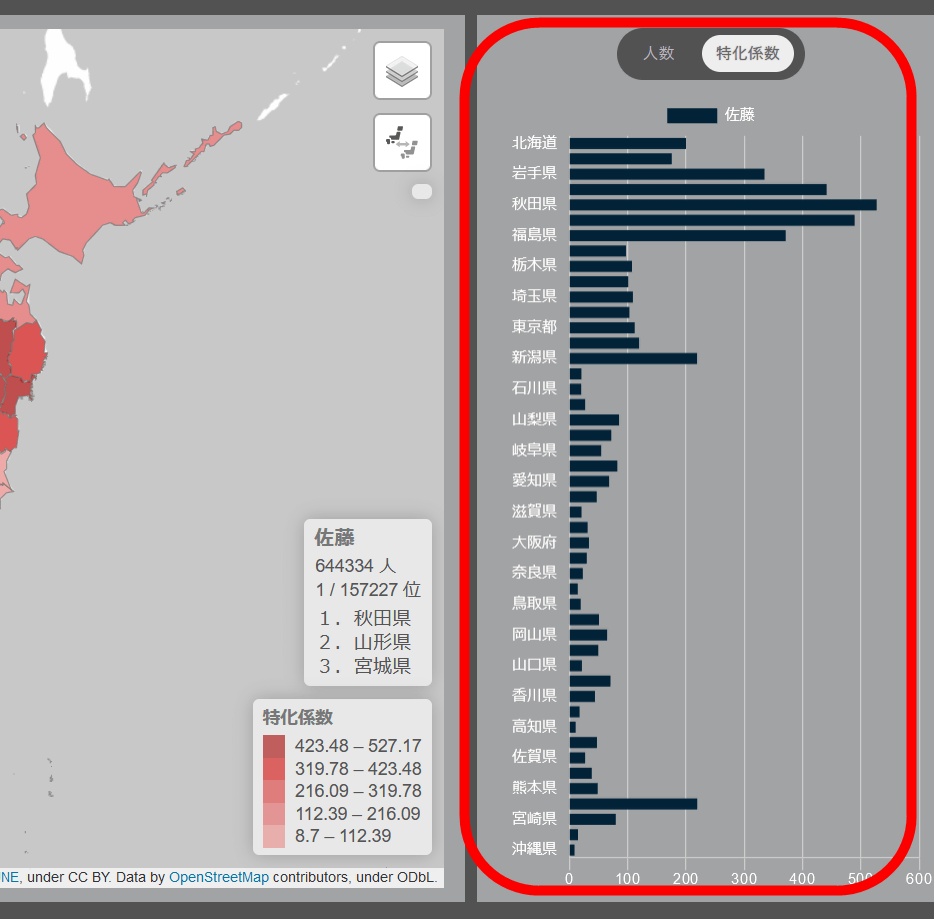
Looking at the ranking of the specialization coefficient of Mr. Sato, unlike the ranking of the number of people, Akita prefecture is ranked first, Yamagata prefecture is second, Miyagi prefecture is third, and the Tohoku region occupies the top position. .. This is because Tokyo and Kanagawa, which have a large population, are likely to be ranked in terms of the number of people, while prefectures, which have a large surname per population, are ranked in the specialization coefficient.
On the right side of the map, the number of people and specialization coefficient for each prefecture are displayed as a bar graph.
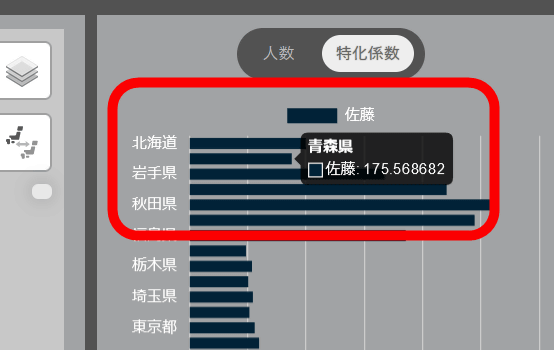
You can also check prefectures that do not have a name on the left side of the graph by hovering the cursor over the bar graph.
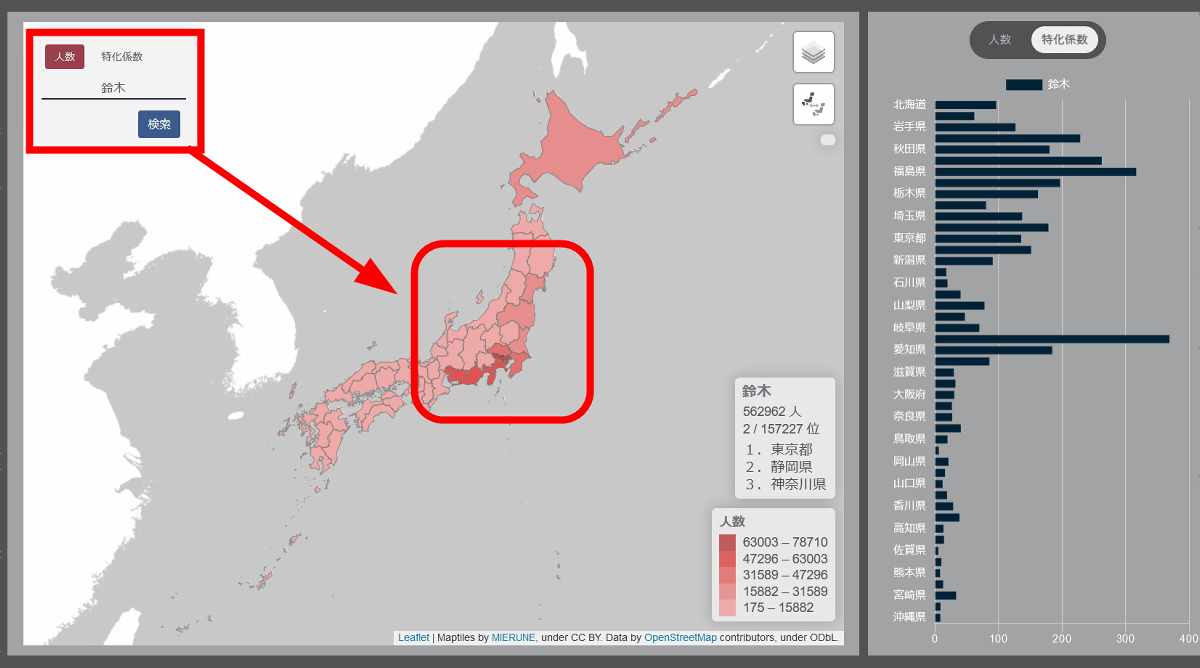
Next, when I searched for 'Suzuki' who was second in the Meiji Yasuda Life Insurance survey, it looked like this. There are many people along the Pacific Ocean from the Tokai region to the southern part of Tohoku ...
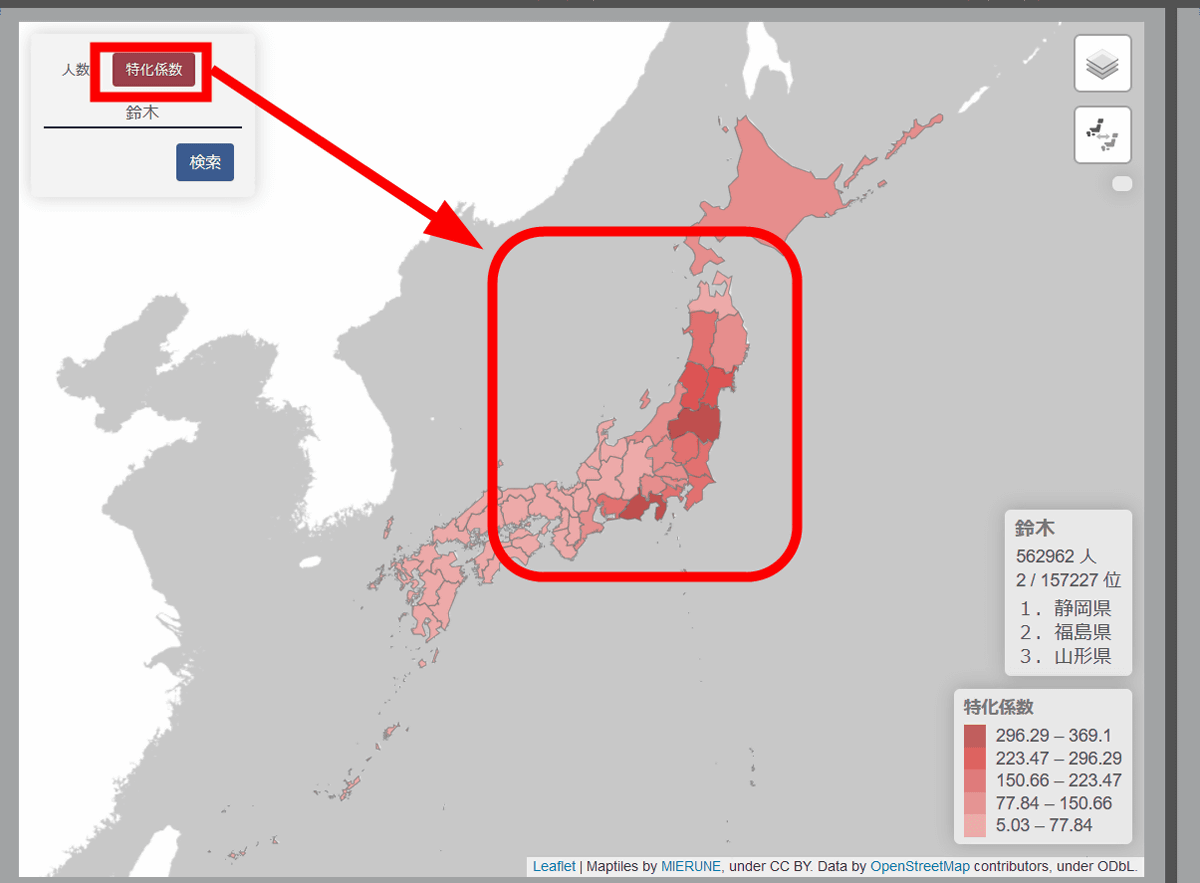
In terms of specialization coefficient, Shizuoka prefecture is ranked first, Fukushima prefecture is ranked second, and Yamagata prefecture is ranked third, showing a tendency that there are many in the Tohoku region.
'Takahashi', who boasts the third highest number in Japan, is also biased toward the Tohoku region in terms of specialization coefficient, while 'Tanaka', who is fourth in the ranking, is often along the Sea of Japan from Kyushu to Hokuriku as shown below. It tends to be different depending on the surname.
Click the layer icon at the top right of the map ...
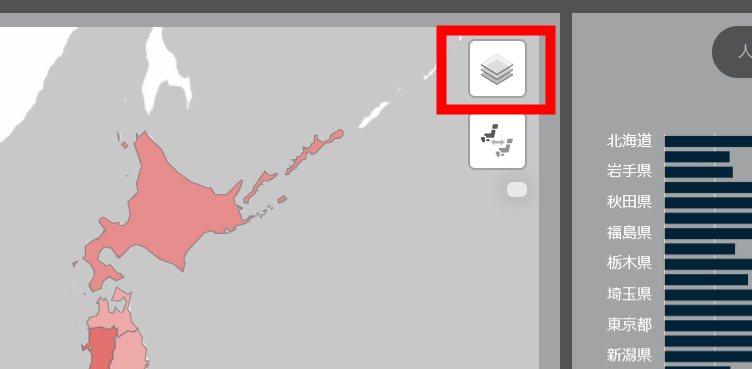
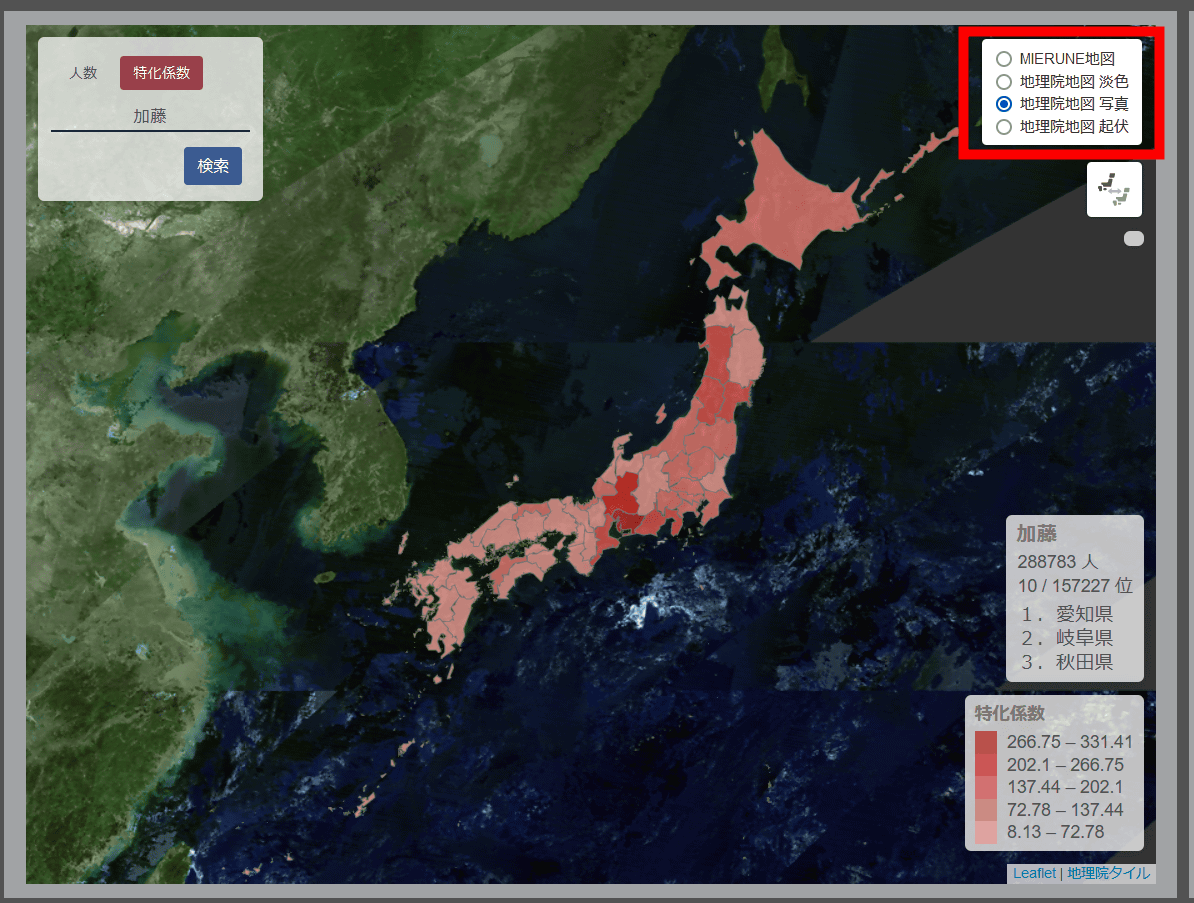
From the default 'MIERUNE map', 'GSI map light color' that shows the color of the sea in light blue, 'GSI map photo' that uses photos, and 'GSI map undulation' that shows the undulations of the terrain , You can change the map to be displayed.
Also, if you click the icon that displays two maps of Japan ...
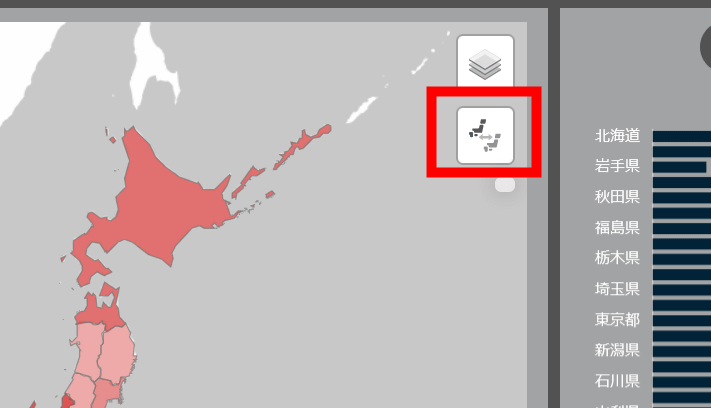
It is possible to display two maps side by side. One is displayed by the number of people and the other is displayed by the specialization coefficient for comparison.
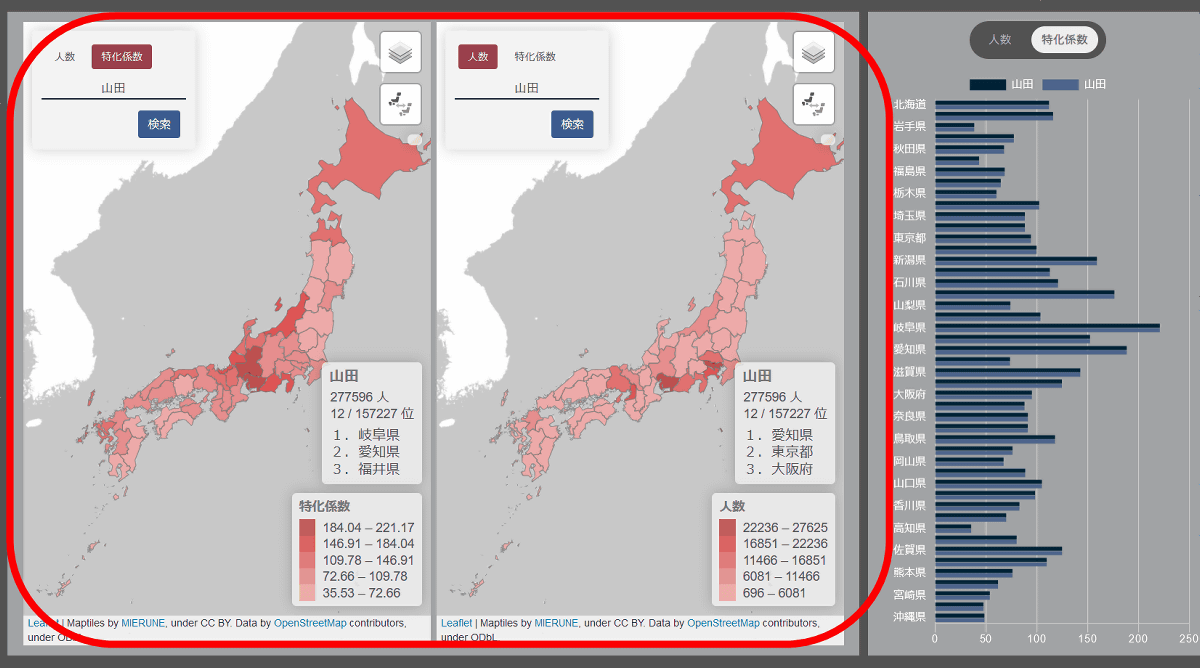
You can compare the distribution trends of two different surnames.
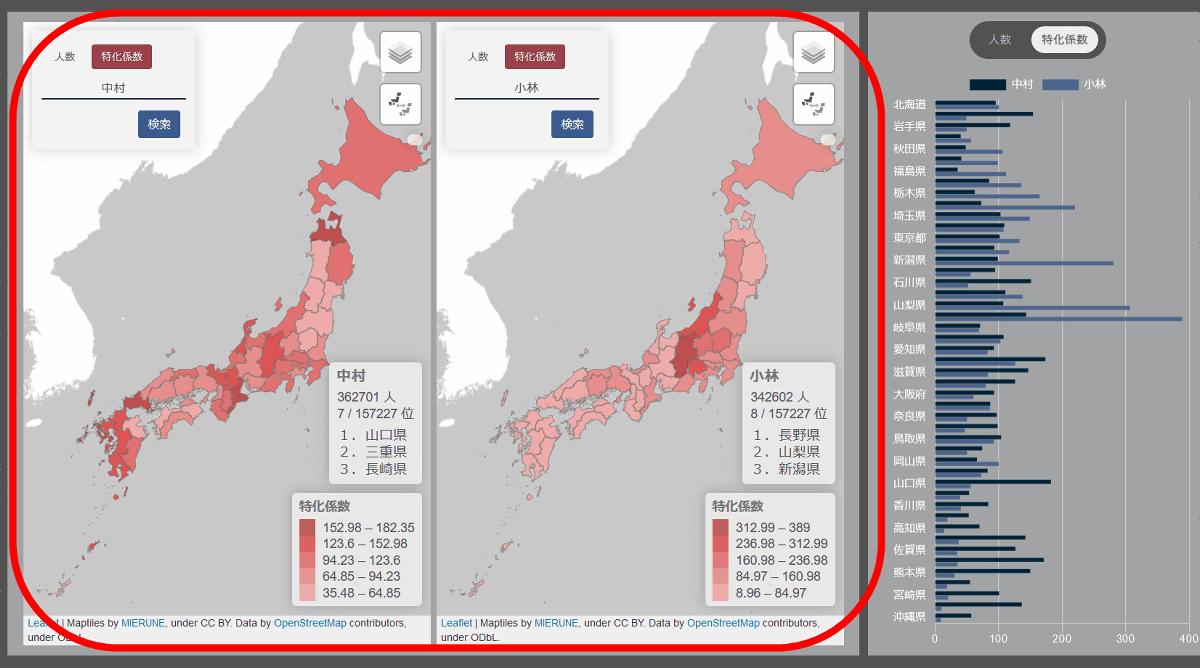
The graph on the right also showed the results of searching on the two maps overlapping each other.

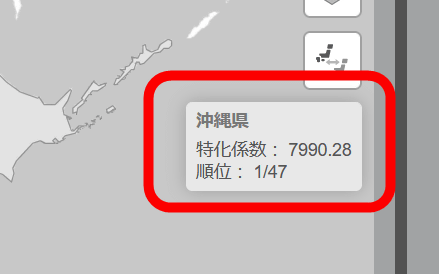
Of course, it is also possible to search for names that are likely to be concentrated in a particular region. For example, if you search for 'Ganaha', which is an image often found in Okinawa ...
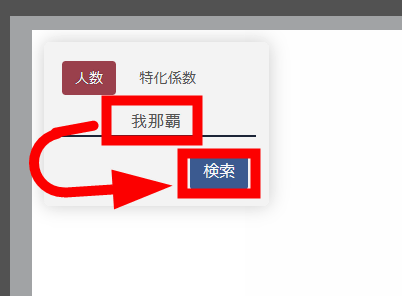
There are many prefectures where 'Ganaha' is 0, but only Okinawa is dyed red, and Okinawa is ranked first in the ranking of the number of people.

Of the 485 'Ganaha' nationwide, 434 live in Okinawa ...
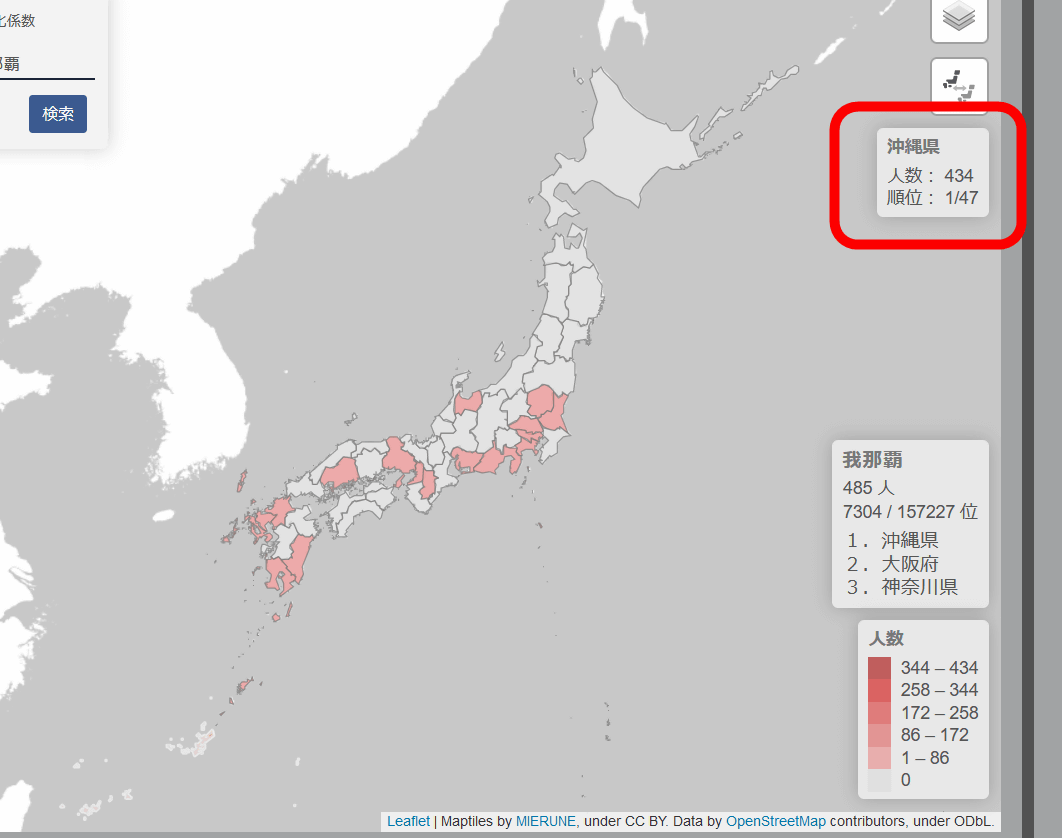
The specialization coefficient hit the amazing '7990.28'.
Related Posts:


in Review, Web Service, Posted by log1h_ik