'Git: An Interactive Development History' that visualizes how the version control system 'Git' has evolved
'
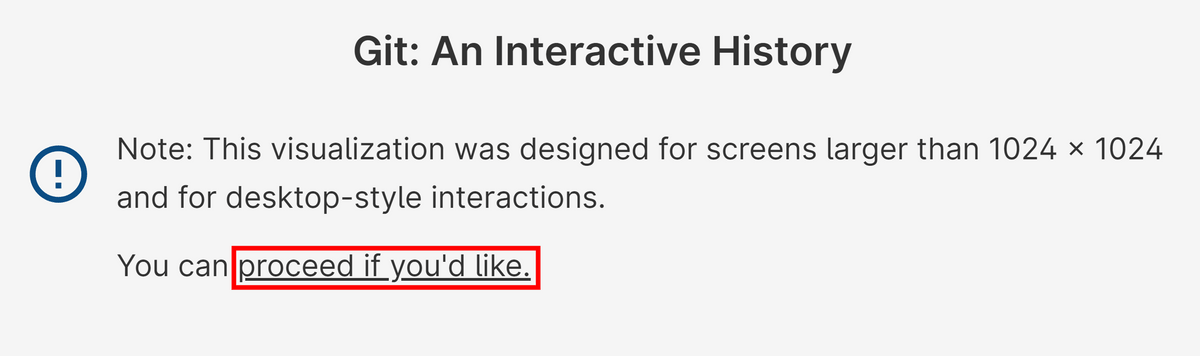
Git: An Interactive History
https://git-history.jpalmer.dev/
Git: An Interactive Development History | jpalmer.dev
https://jpalmer.dev/2021/05/interactive-git-history/
When I visit the website, it says that it needs a resolution of '1024x1024' or higher to display properly. Click 'proceed if you'd like'.
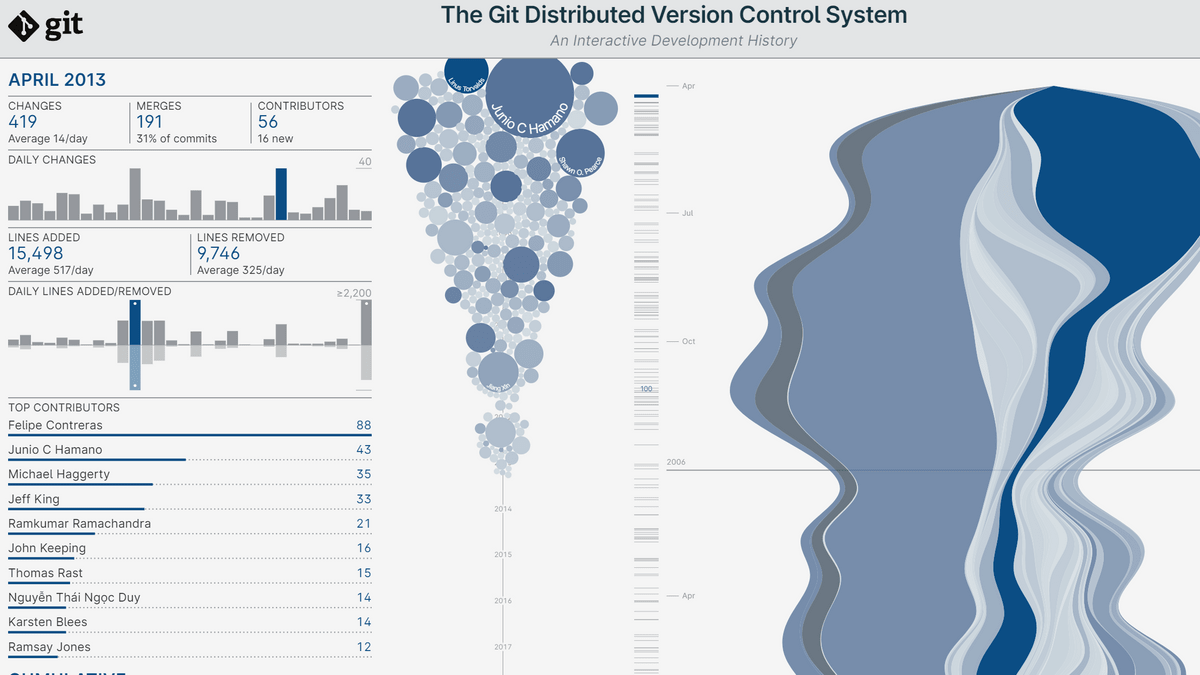
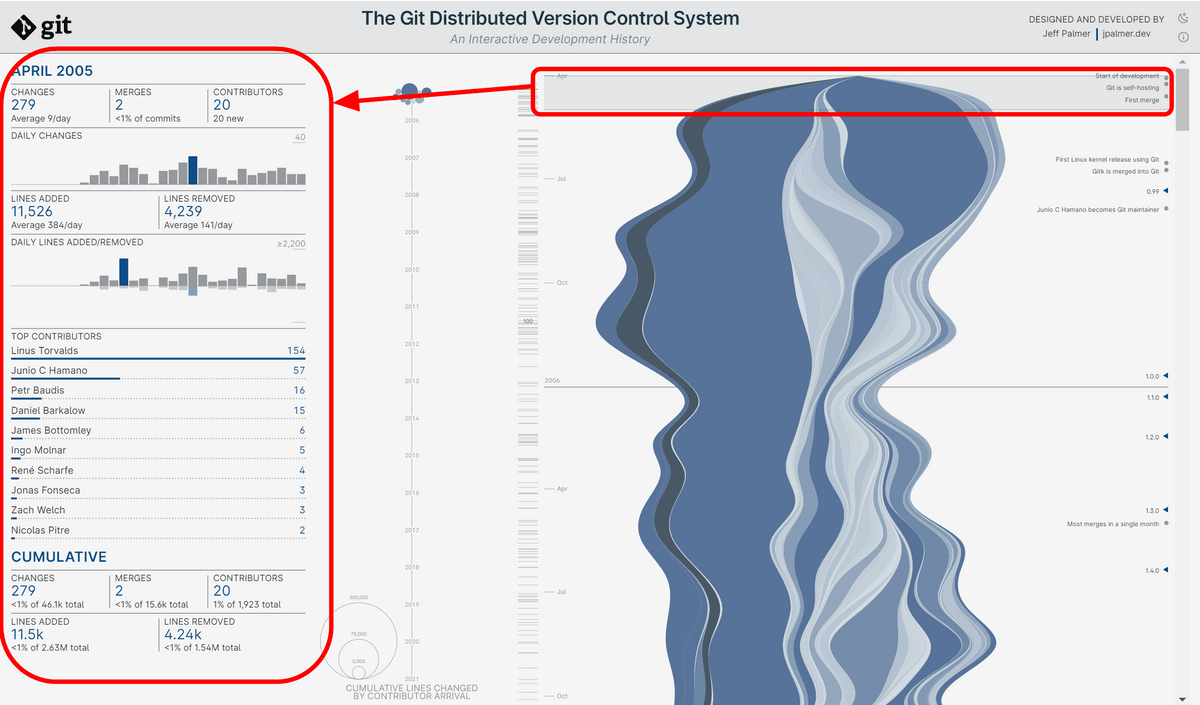
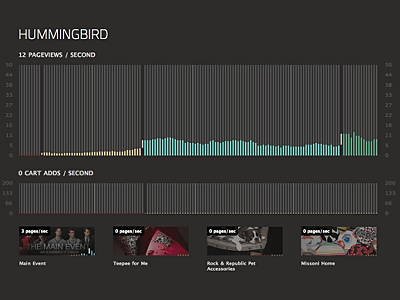
The website consists of a time series graph on the right and detailed data on the left. At the time of access, 'April 2005' is selected, and you can see the data for April 2005 on the left.
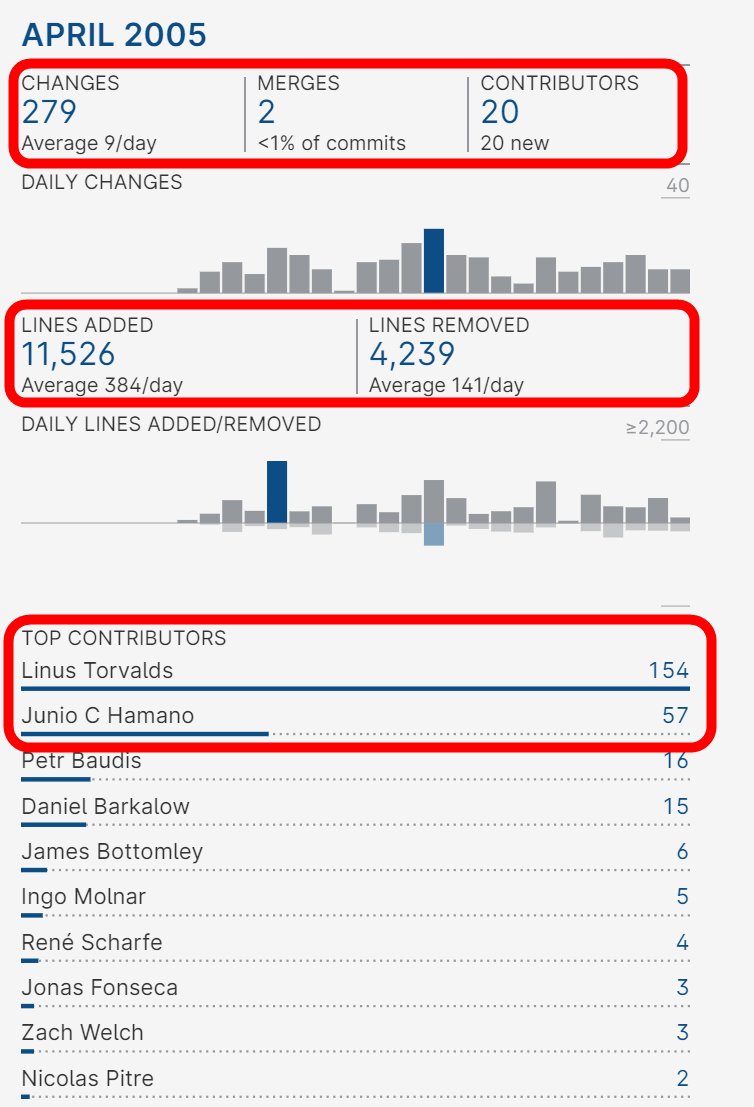
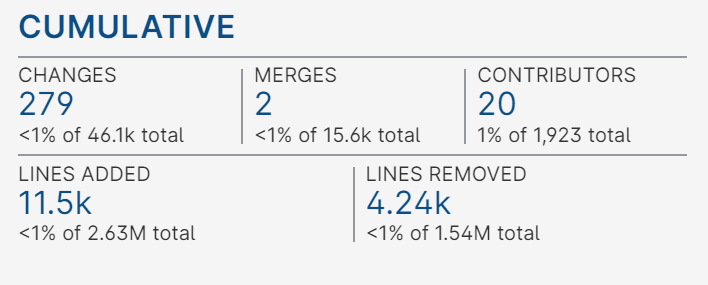
Looking closely at the data, a total of 279 changes were made in April 2005, with 20 developers participating in the merge twice. In a month, 11,526 lines of code were written and 4,239 lines were deleted. According to the list of developers who made the changes at the bottom of the screen, it was Git developer Linus Torvalds who made the most changes, followed by Git core maintainer Hamano. With Jun-san.
The bottom row is the cumulative data up to the selected month. Since we have selected April 2005, the starting point for the record, it is the same as the above display at this point. In addition, the total number up to January 2021 when Palmer saved Git data is displayed in small letters.
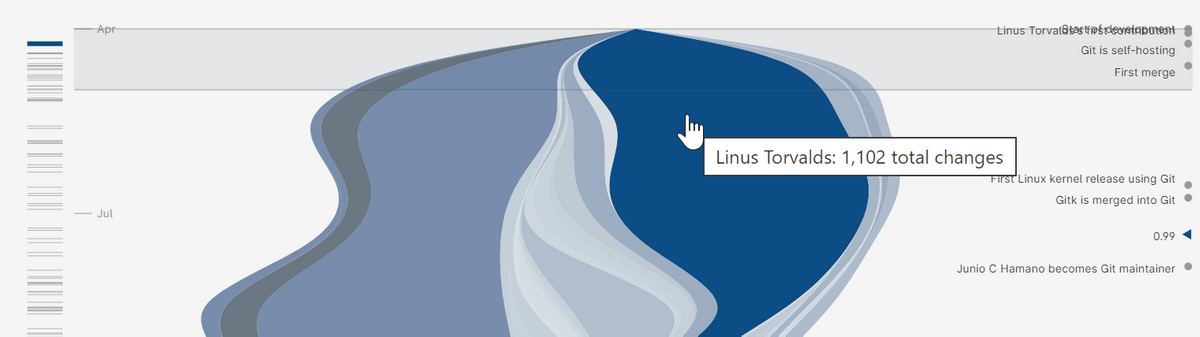
The time series graph on the right gives you a glimpse of which developers have made changes and how much. When I hovered over the big chunk, it showed who made the changes and how many times in total.
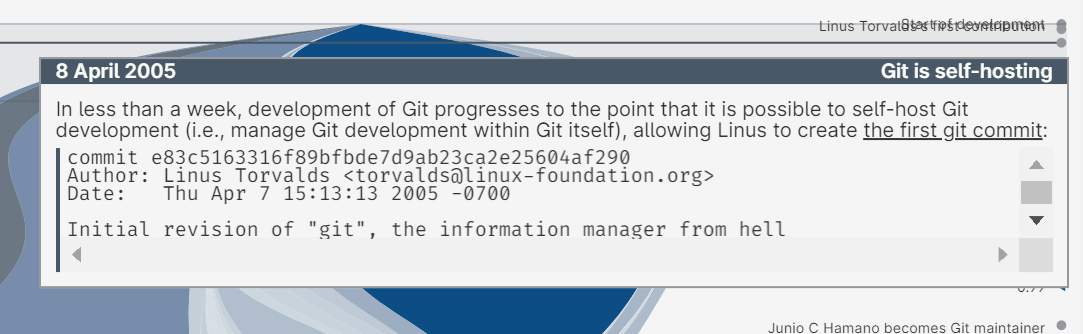
The events of Git are displayed at the right end of the time series graph. For example, on April 8, 2005, Git development came to be managed by Git.
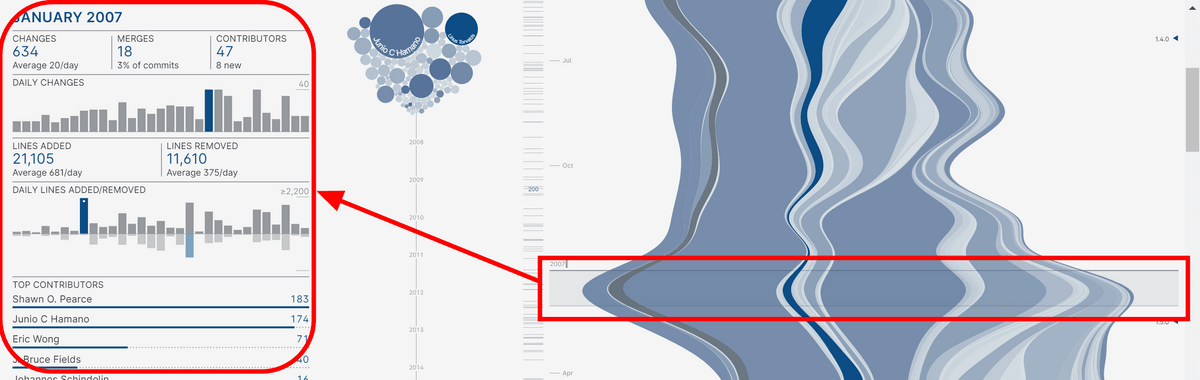
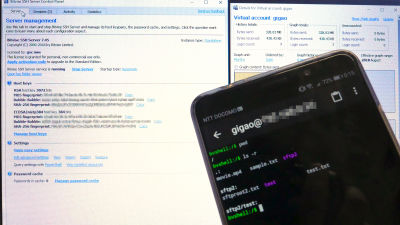
Click the time series graph to see the data for that month. When I clicked on January 2007, which seems to have a lot of changes, it showed that there were 634 changes in a month and more than 20,000 lines of code were added.
The author, Palmer, explains how he developed this interactive graph on his blog.
Related Posts:


in Review, Software, Web Application, Posted by log1d_ts