Google has released 'COVID-19 Infection Prediction (Japan Version)' that shows how the number of new coronavirus infections in Japan will change in the next 28 days, and the number of deaths, positives, hospitalization, medical treatment, etc. predicted in 28 days Numbers are also posted

In August 2020, Google Cloud released '
About the release of COVID-19 infection prediction (Japan version) | Google Cloud Blog
https://cloud.google.com/blog/ja/products/ai-machine-learning/google-and-harvard-improve-covid-19-forecasts
'COVID-19 Public Forecasts' predicts the number of COVID-19 positives and deaths in the United States for 14 days from the start date of the forecast. The Japanese version of this tool, 'COVID-19 Infection Prediction (Japan Version)' has been released. In addition, 'COVID-19 Infection Prediction (Japan Version)' makes it possible to predict the number of COVID-19 positives and deaths for 28 days from the start date of prediction.
'COVID-19 Infection Prediction (Japan Version)' can be accessed from the following. The usage of 'COVID-19 Infection Prediction (Japan Version)' is summarized in the (PDF) User Guide .
COVID-19 Infection Prediction (Japan Version)
https://datastudio.google.com/s/nXbF2P6La2M
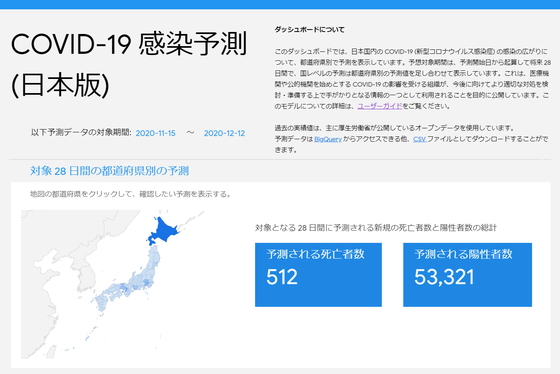
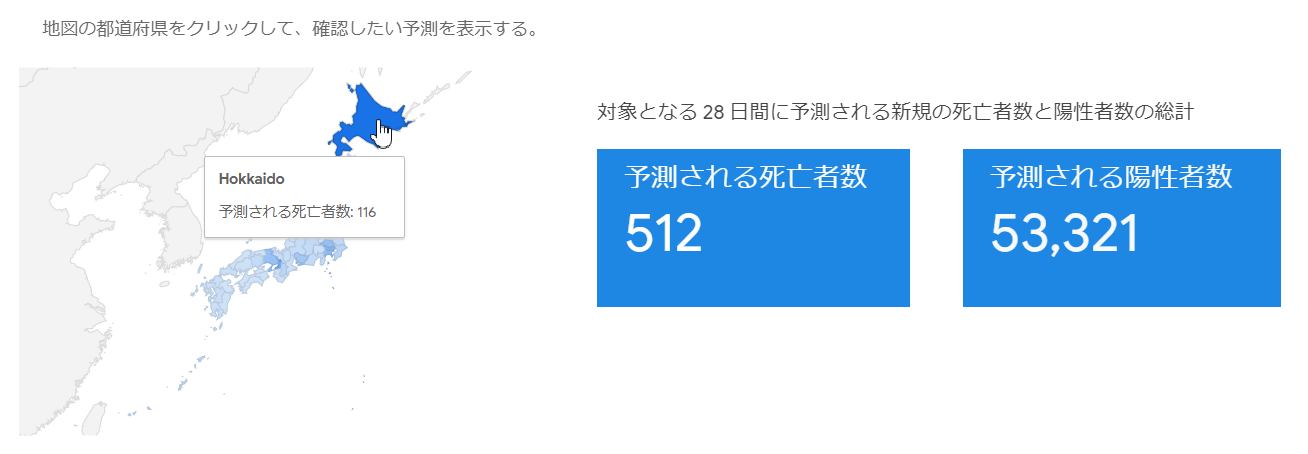
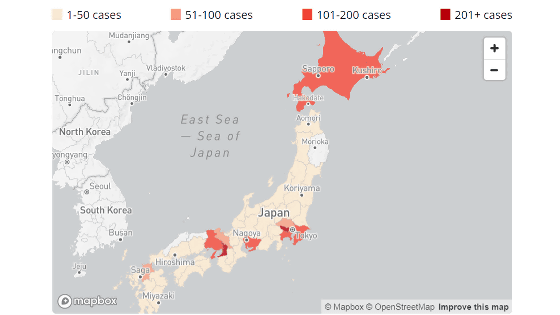
If you access 'COVID-19 Infection Prediction (Japan Version)' as of November 17, 2020, the forecast data will display the infection forecast for 28 days from November 15 to December 12, 2020. The first displayed is the estimated number of deaths in 28 days and the number of positives. The dark-colored places on the map are the prefectures with the highest number of deaths, and at the time of writing the article, Hokkaido has the highest number of '116 people'. You can check the estimated number of deaths by prefecture in 28 days by hovering the mouse cursor over the map, and clicking it will display only the forecast information by prefecture.
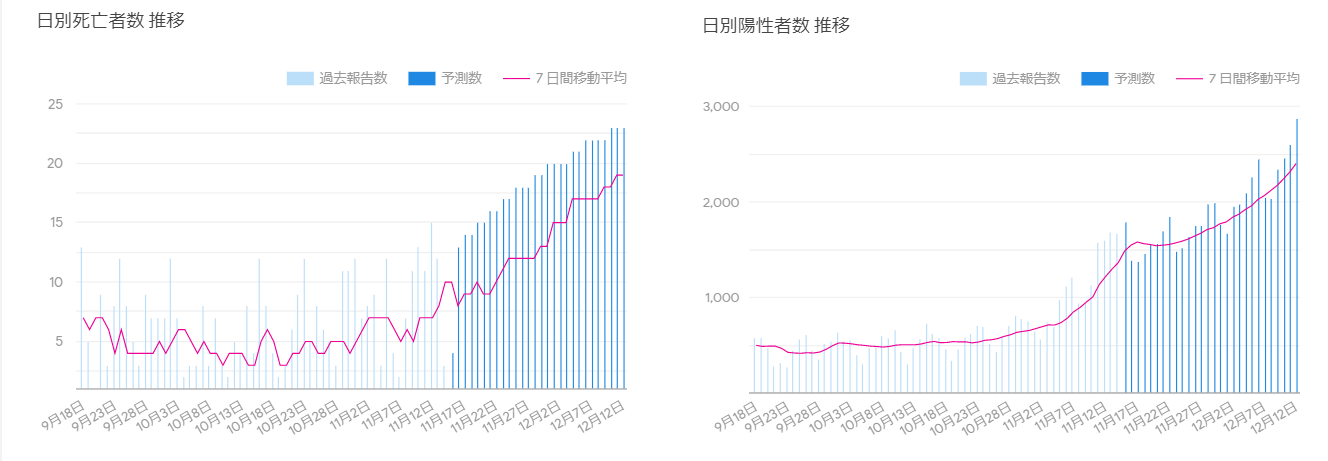
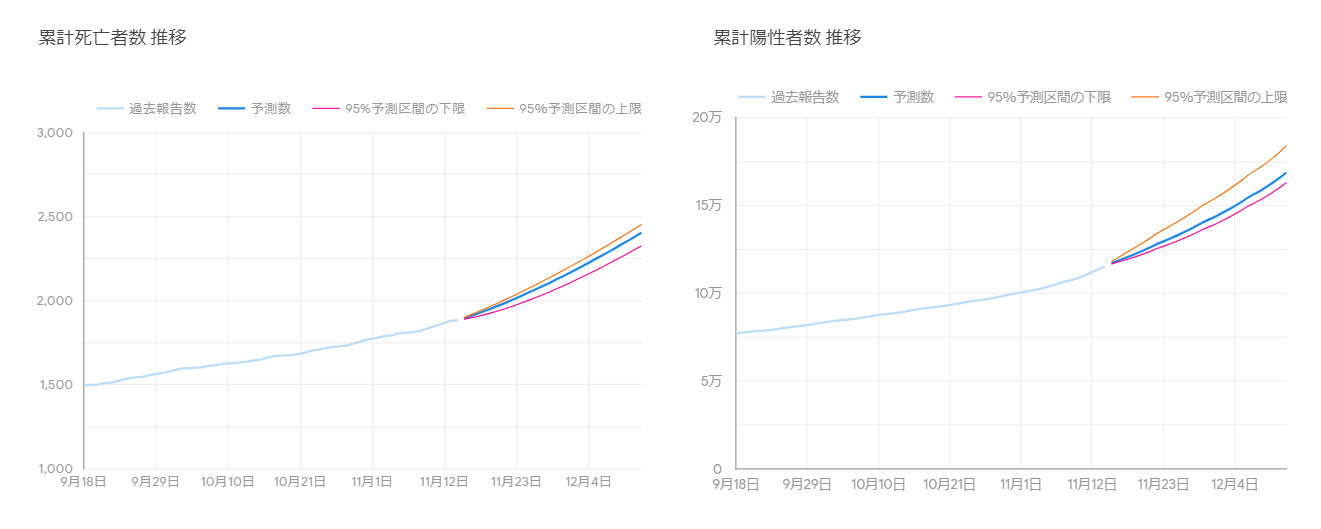
In addition, the graph on the left is a daily summary of the number of deaths for the past two months and the estimated number of deaths for the next 28 days. The right is a graph summarizing the number of predicted positives by day for the same period.
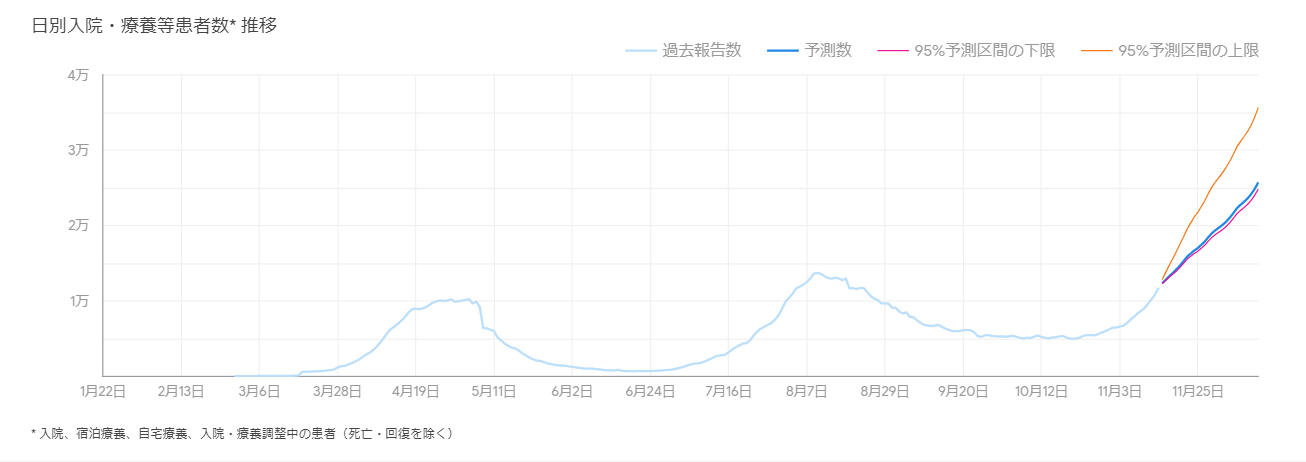
A graph summarizing changes in the number of patients such as hospitalization and medical treatment by day. The light blue line shows the number of past reports, the blue line shows the number of predictions, the pink line shows the lower limit of the 95% prediction interval, and the yellow line shows the upper limit of the 95% prediction interval. The number of patients undergoing hospitalization / medical treatment refers to patients who are undergoing hospitalization / accommodation treatment / home treatment and hospitalization / medical treatment adjustment, and excludes the number of deaths and recoverers.
The graph below shows the cumulative number of deaths on the left and the cumulative number of deaths on the right. If the forecast for the next 28 days is correct, the number of COVID-19 positives and the number of deaths will tend to increase in the future.
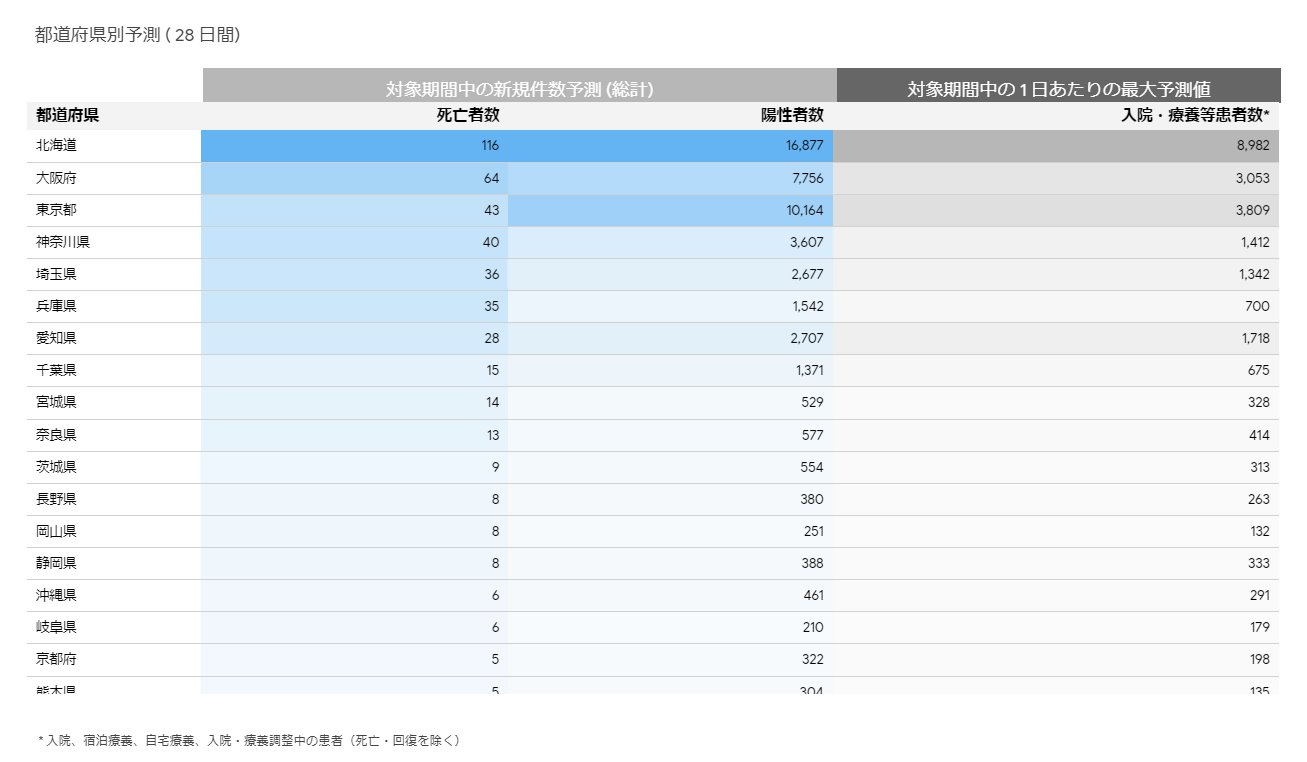
Forecast by prefecture that summarizes the number of new deaths and the number of positives during the target period. The prefectures with the highest number of deaths are listed from the top, with the largest number being Hokkaido (116), followed by Osaka (64), Tokyo (43), Kanagawa (40), and so on. Saitama prefecture (36 people), Hyogo prefecture (35 people), Aichi prefecture (28 people).
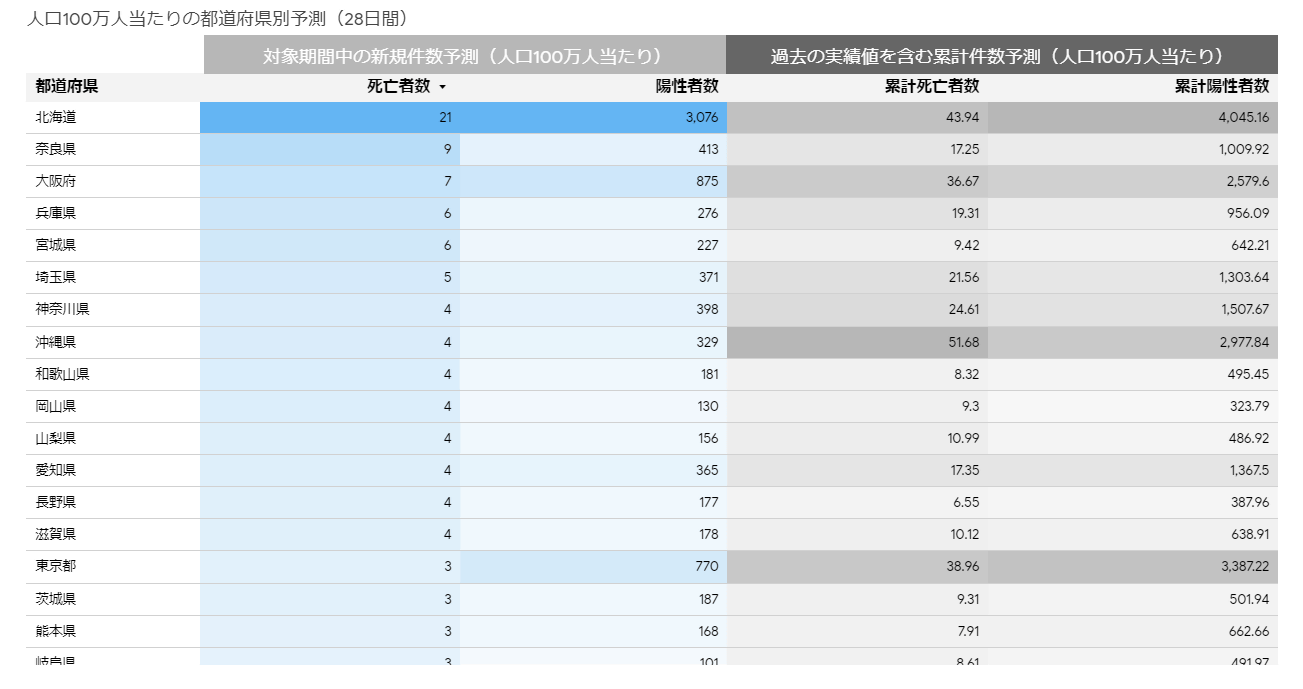
The last thing that is displayed is the forecast by prefecture per million people. Hokkaido (21 people) has the highest number of deaths per million people, but Nara prefecture (9 people) came in second. Tokyo, which has a high population density, has three deaths per million people.
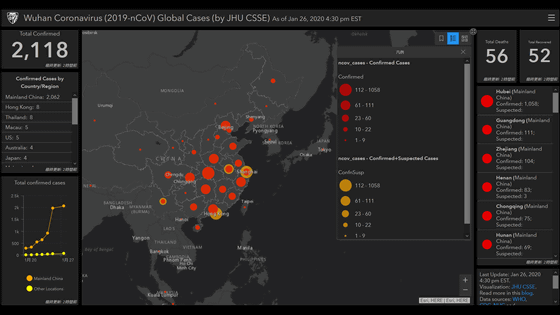
According to Google, COVID-19 Public Forecasts is made possible by combining artificial intelligence (AI) with vast amounts of epidemiological data, and by adopting a novel machine learning approach that deals with time-series prediction. COVID-19 Public Forecasts for the United States is based on data released to the public by Johns Hopkins University, Descartes Lab , the United States Census Bureau, etc., and continues to be updated under the supervision of Harvard Global Health Institute. It seems that it has been done.
In order to expand this tool for Japan, 'COVID-19 Infection Prediction (Japan Version)' adds a new 95% prediction interval and data set, extends the prediction target period, and improves prediction accuracy by strengthening the model. Google explains that it did. Specifically, the basic conditions such as the mode of infection and how to spread are the same as the American version model, but the Japanese version model trains the model using only the Japanese data set. The data used for the training are open data such as the number of COVID-19 positives and deaths released by the Ministry of Health, Labor and Welfare, Google's community mobility report , and the 2015 national census . Since the data used in the Japanese model uses data on the number of positive people in Japan and data on the movement status of people, the prediction results include Japan's infection status, people's reactions to it, and living environment. It reflects your own situation.
In addition, 'COVID-19 Infection Prediction (Japan Version)' can not only check the predicted value on the dashboard, but also output it as a BigQuery or CSV file.
・ Continued
What is the mechanism and basis for Google's 'COVID-19 Infection Prediction (Japan Version)', which shows the number of new corona infections and deaths over the next 28 days? --GIGAZINE
Related Posts:


in Web Service, Science, Posted by logu_ii