What did you learn by investigating whether the price of used clothing is soaring since 2014?
Designer and developer
Goodwill Hunting
https://goodwill.awardwinninghuman.com/
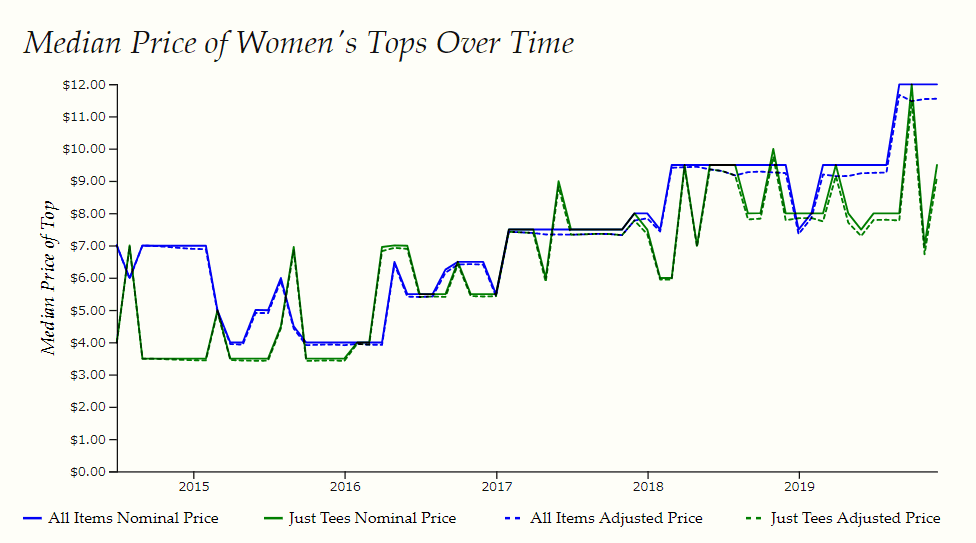
First, as a result of the analysis, Mr. Peter thinks that the price is “up”. The median price of overall items was almost doubled from July 2014 to December 2019. Looking at the changes in the median price of women by focusing on the tops of women of general brands such as GAP, NIKE, and UNDER ARMOUR, it seems that the price had almost doubled from 2014 to 2019.
Below is a graph showing the median tops for women. Blue is the median price for all items and green is the median price for tops. The wavy line graph is inflation-adjusted, but the results are almost unchanged.
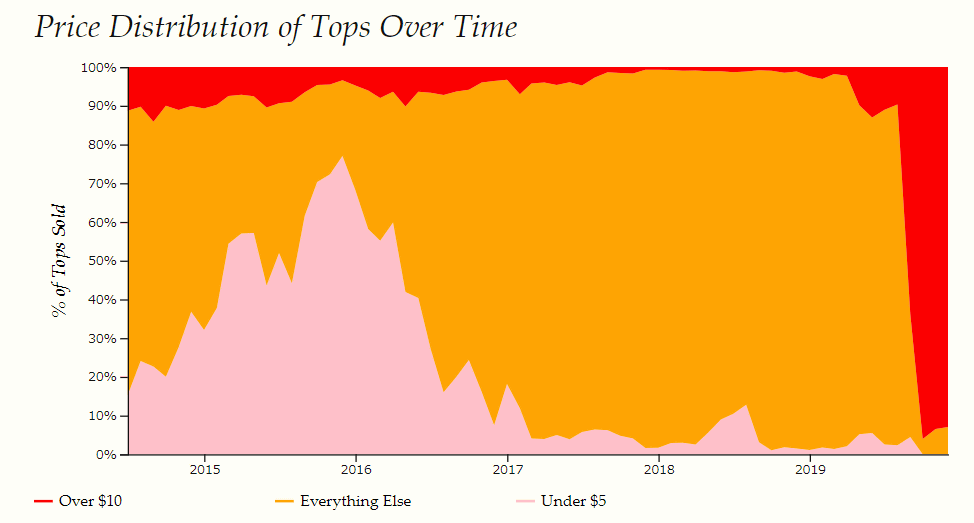
You can see why the median price went up by looking at the tops price distribution. The following shows items where red is over $ 10 (about 1100 yen), orange is all items, pink is under $ 5 (about 540 yen), and by 2016, cheap items under $ 5 are on the rise. However, you can see that the number of cheap items has decreased since then. However, the number of items over $10 has not increased, and the number is almost stable. There will be a surge in items over $10 in late 2019, which is seen as a 'data collection issue.'
The following is a transition of the popularity of fashion brands.

In addition, the price and assortment of goods at the second hand clothing store vary depending on the location, but the following map was investigated to see if there are similar trends in online shops. The closer the color is to yellow, the lower the median price of items, and the red the higher the median price.
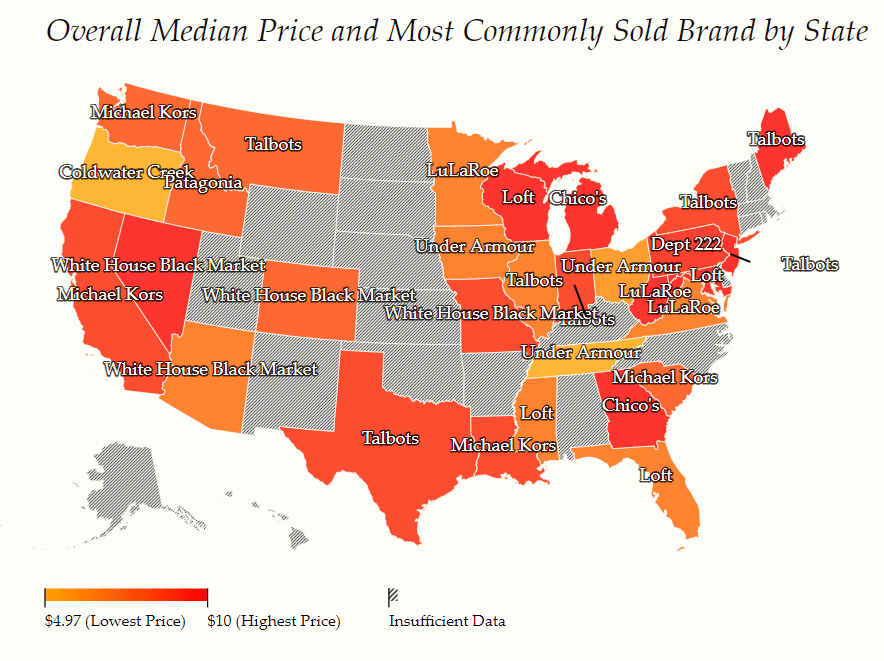
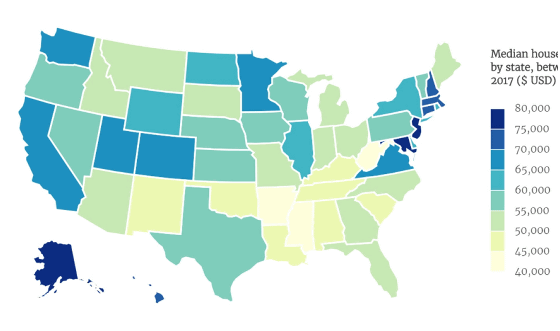
On the other hand, the following map shows the colors of each state by household income. The closer to yellow, the lower the median household income, and the closer to dark blue, the higher the median income. Overall, household incomes tend to be higher in northern states, but this trend was not seen in second-hand clothing online shops.
Although Peter admitted that the extracted data was not perfect, he said that it was 'enough to do some analysis'.
Related Posts:


in Note, Posted by darkhorse_log