'Test timing' and 'test type' are important for accurate PCR testing
PCR tests are mainly used for the diagnosis of new-type coronavirus infection (COVID-19), but from the scientific reports so far, the virus detection rate differs depending on the “type” and “timing” of PCR tests. I know it will come. And a new research report has emerged that it is important to perform appropriate tests according to the number of days since the onset in order to make a correct diagnosis by PCR.
Interpreting Diagnostic Tests for SARS-CoV-2 | Infectious Diseases | JAMA | JAMA Network
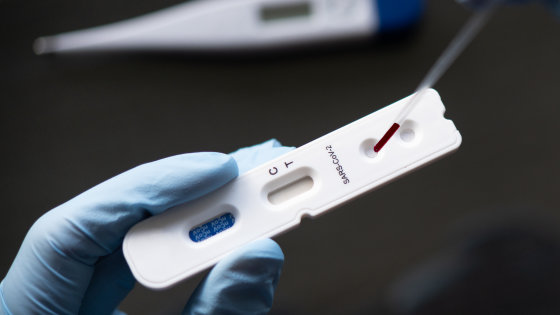
As of May 2020, COVID-19 was tested by the reverse transcription polymerase chain reaction (RT-PCR) and enzyme-linked immunosorbent assay (ELISA) using immunoglobulin G and immunoglobulin M. I am told. The most common PCR tests are nasopharyngeal swabs and pharyngeal swabs, which target the test for envelope glycoproteins , nucleocapsids , spikes , RNA-dependent RNA polymerase (RdRp), etc. Are expected to be about the same except for some.
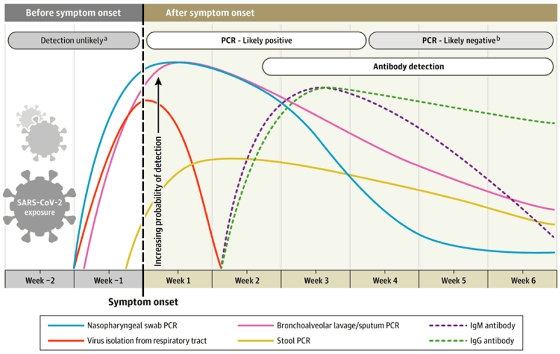
The graphs below are 'PCR test with nasopharyngeal swab' (light blue), 'PCR test with saliva and pharyngeal swab' (red), 'PCR test with bronchoalveolar lavage fluid' (pink), 'PCR test with stool' (yellow) ), 'Immunoglobulin M antibody test' (purple wavy line), 'immunoglobulin G antibody test' (green wavy line). The vertical axis is the virus detection rate, the horizontal axis is the time axis, and the point where the vertical axis and the horizontal axis intersect is the 'day when symptoms appeared.' The red graph, that is, the PCR test that collects a sample from the upper part of the respiratory organs, the detection rate increases if it is performed immediately after the onset of symptoms, but the detection rate decreases drastically in about a week. On the other hand, in the light blue or pink graph, that is, the PCR test using the nasopharynx and bronchoalveolar lavage fluid has a high initial detection rate, and the decrease in the detection rate is relatively gradual. In addition, although the detection rate of PCR by feces is not high, it can be seen that the virus is detected even after 7 weeks.
Whether the PCR test is positive (PDF file) is judged by the
Some infected people may show positive again 6 weeks after the first test was positive, but at the time of writing the article was whether this was a test error, reinfection or reactivation. I'm not sure. In an experiment targeting 9 infected individuals, the virus failed to be isolated and cultured 8 days or more after the onset, and the result shows that the virus decreases with the passage of time. This is why the Preventive Control Center (CDC) states that 'healthcare professionals can return to the site at least 3 days (72 hours) after recovery.'
In addition, in a study of 205 infected individuals, bronchoalveolar lavage fluids had the highest PCR positive rate of 93%, followed by 72% of saliva, 63% of nasal swabs, and pharyngeal swabs. It is shown to continue at 32%. The false negatives were mainly due to the timing of sample collection and the lack of sample collection technology, especially for the nasopharynx. Also, due to the design of the test, if a false positive occurs, it may be due to a technical error or reagent contamination.
In the graph, antibody tests are shown by purple and green wavy lines, but such serological diagnosis is such as diagnosis of patients who come to the hospital two weeks after the onset and how much COVID-19 is community It is believed that it can also be used to understand what has spread to and to determine who is protected by immunity. Immunoglobulin M antibody and immunoglobulin G antibody may already be detected on the 4th day after the onset of symptoms, but a marked increase is seen at 2 weeks after the onset.
There is also a difference in the detection of immunoglobulin M antibody and immunoglobulin G antibody, both of which peak at 3 weeks after the onset, but immunoglobulin M antibody decreases sharply from there, and by the 7th week It almost disappears. On the other hand, immunoglobulin G antibody lasts for more than 7 weeks.
The data used in the above analysis is for adults who are not immunocompromised. It is said that the change in the graph over time may change depending on children, elderly people, asymptomatic patients, etc.
Related Posts:


in Science, Posted by darkhorse_log