A simulator that can intuitively understand the spread of the new coronavirus while changing the `` infection rate '', `` number of people met in a day '', `` movement restrictions '', etc.
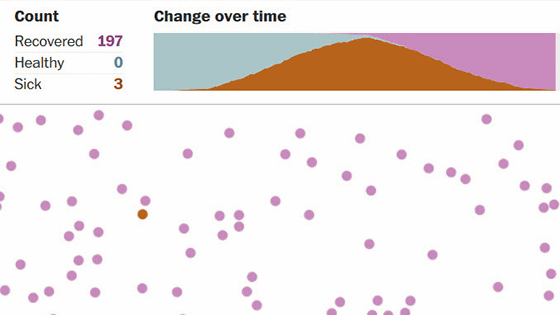
Kevin Shimla, who was interested in `` simulation of the spread of the new coronavirus infection (COVID-19) ' ' published in the Washington Post , has been spreading the spread of the new coronavirus on his blog `` Melting Asphalt '' The version has been upgraded to a more interactive simulation. Mr. Shimla has a degree in Computer Science from the University of California, Berkeley, a Ph.D. in Computational Linguistics from the Massachusetts Institute of Technology (MIT), and has since worked as an engineer and product designer.
Outbreak — Melting Asphalt
https://meltingasphalt.com/interactive/outbreak/
Mr. Shimla described his new coronavirus infectious simulator, 'This is only a simplification of the disease transmission process, with the goal being' How do infections generally evolve? ' Therefore, this is not an attempt to model a new type of coronavirus infection, and since I am not an epidemiologist, there may be some mistakes, since the fix as soon as possible, it pointed out that you wrote and please '.
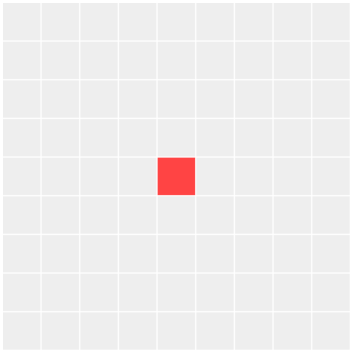
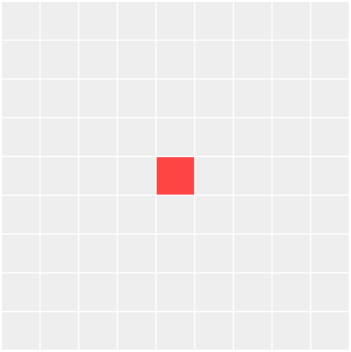
The first thing the illness needs is the 'potentially ill number of people'. The following 9 x 9 frames indicate each person is a single person, red cells in the center indicate infected people, other white cells indicate non-infected people.
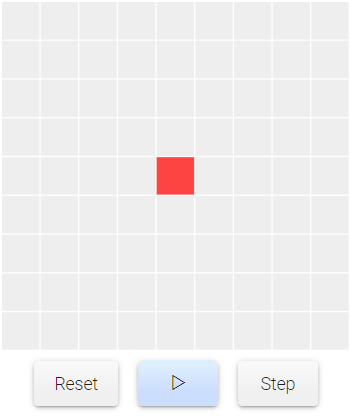
Next we will add the concept of time to this 9x9 square. Click the play button to visually check the spread of infection every day.
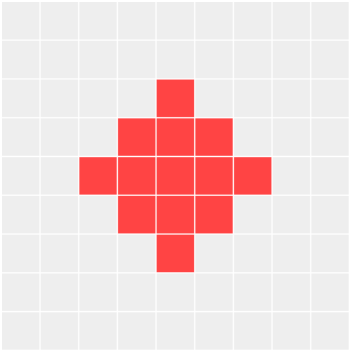
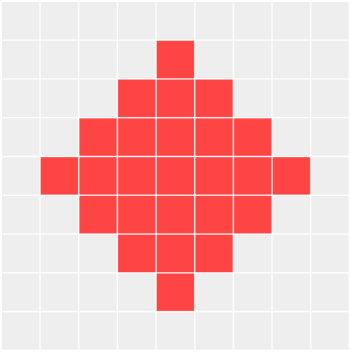
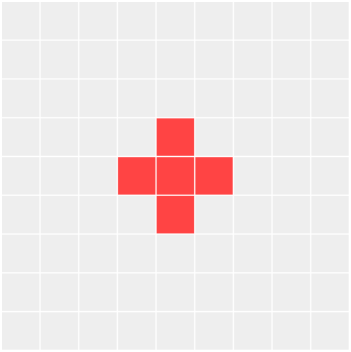
Click 'Step' to check the spread of infection every day. If the first day is one infected person, the following is the second day. The number of infected people increased to five.

Third day. The trout existing at the top, bottom, left and right of the infected person will be infected with the new coronavirus one after another.
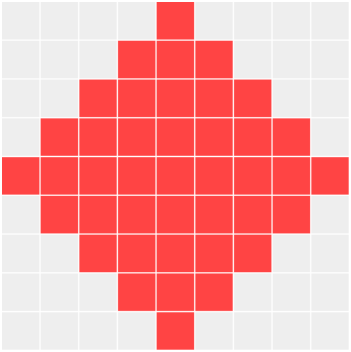
Day four. As the number of infected people increases, the number of infected people daily increases exponentially .
Day 5. Finally, the infected person reached the end of 9 x 9 squares.
Day 6
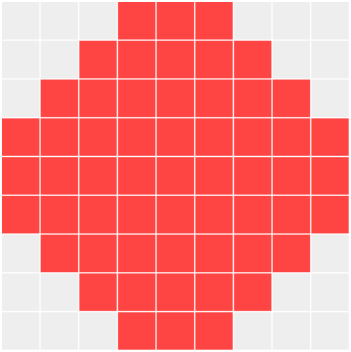
Day 7
Day 8
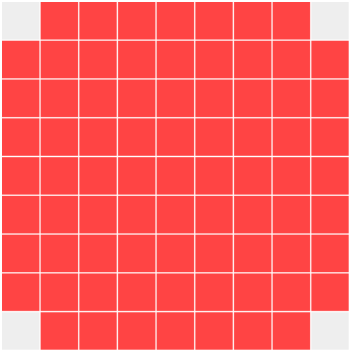
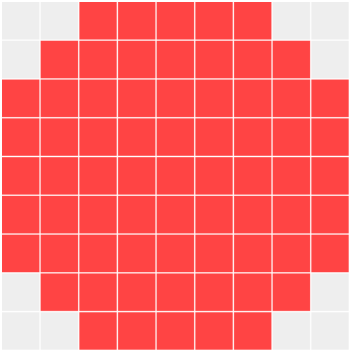
By day 9, all 81 squares had been infected.

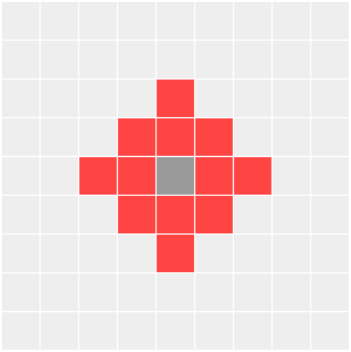
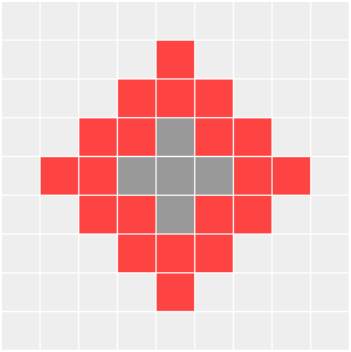
The above image is a simulation focusing solely on 'increase in infected people.' The mortality rate of the new coronavirus is relatively high, although it varies greatly from country to country . However, it is true that many infected people are recovering without dying. Therefore, a simulation of the spread of the infection, including the recovery of the infected person, is as follows. In addition, 'one who has been infected but recovered' is assumed to recover on the second day after infection, and the recovered patient is represented by gray cells.
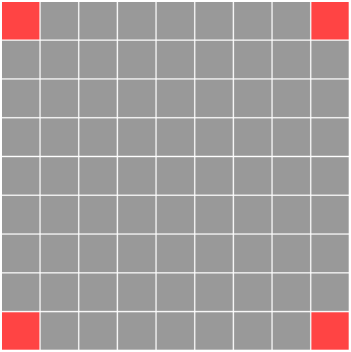
On the first day, the first infected person also occurred in 9 × 9 squares.
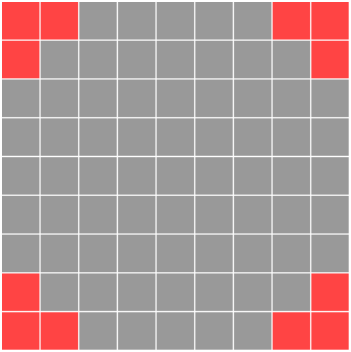
After the second day, the infected person spreads up, down, left, and right as before.
On the third day, the infected people on the first day recover. The center square has turned gray.
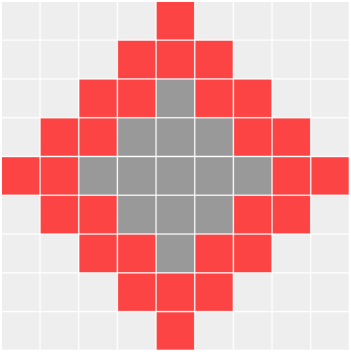
After the fourth day, the number of infected persons and the number of recovered persons increased.
Day 5
Day 6
Day 7
Day 8
On the ninth day, all 9x9 cells were infected with the new coronavirus.
Day 10
However, on day 11, all 9 x 9 squares had recovered from the new coronavirus infection.

Discussions about the new coronavirus infection whisper that the 'latency' between the infection and the first appearance of the virus is long. According to reports, the new coronavirus infection can transmit the virus to others during this incubation period. Therefore, there is a possibility that the virus may be transmitted to others without being aware of the new coronavirus infection.
Adding the element of incubation period to the simulation so far is as follows. However, as noted at the beginning of the article, the following simulation is not a correct model of the spread of the new coronavirus infection, so the incubation period (incubation) and the number of symptomatic days (symptoms) can be said to be correct. not.
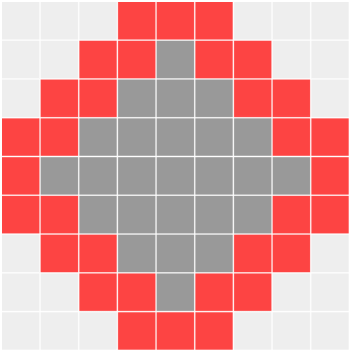
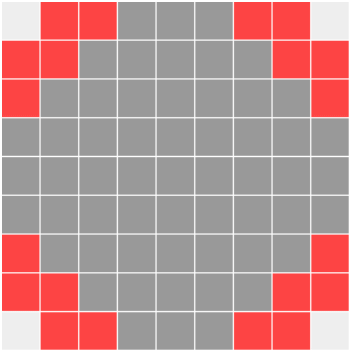
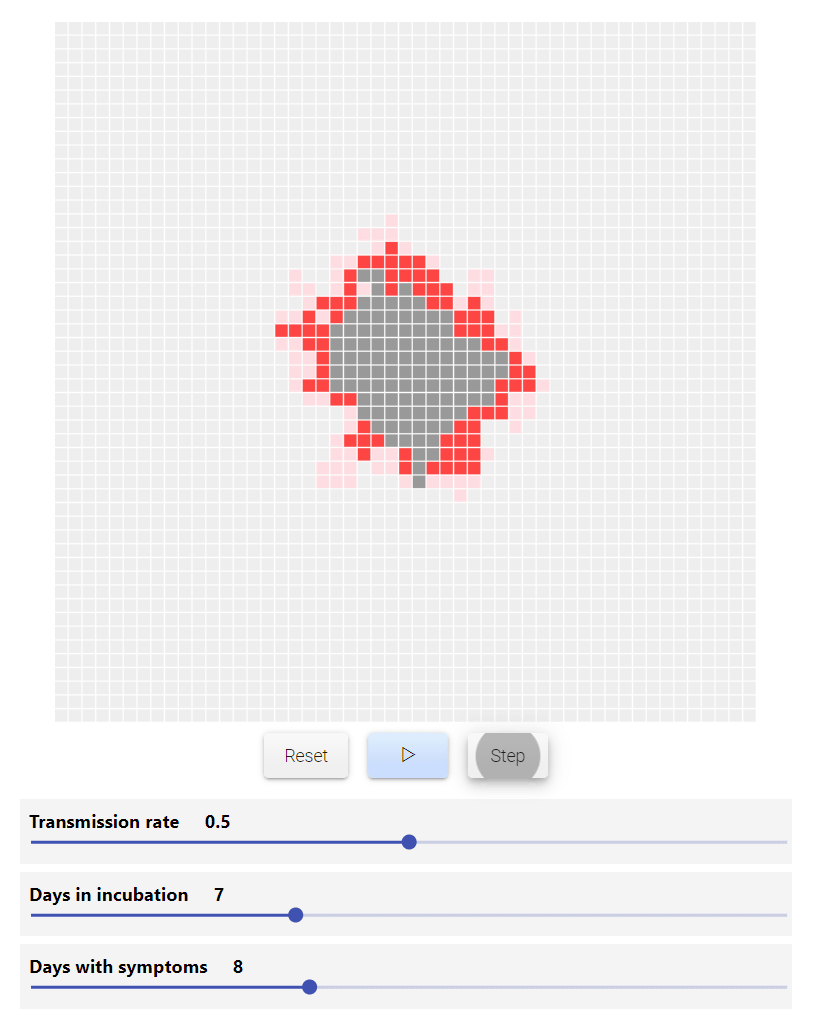
The image below shows the case where the incubation period is set to '7 days' and the number of days with symptoms is set to '8 days', and the element 'People in the incubation period' (light red) is added. In addition, the slider for both the incubation period and the number of days with symptoms can be freely changed.

The next step is to add a probability factor to the infection, because the actual disease is not transmitted with 100% certainty.
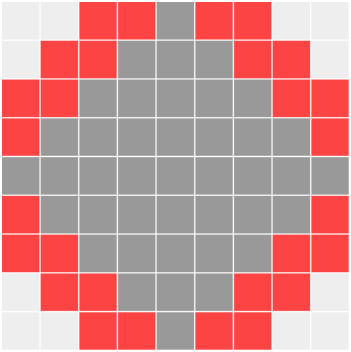
The newly added simulation is the transmission rate (Transmission rate), which is set to '0.5 (50%)' by default. With the addition of the infection rate factor, the number of infected people has been randomized, and the number of infected people no longer increases to a clean diamond shape.
In the simulations so far, only '4 squares (4 people)' could cause the infected person to transmit the new coronavirus. However, the actual number of people you meet each day varies from person to person. In addition, the chances of getting infected between those who just sit next to the bus and those who eat a single ice cream together should be very different. However, in the above simulation, the number of infected people who meet each day is '4 (4 squares)', and the infection rate is fixed at '0.5 (50%)'. This is, as we have said many times, 'to make the simulation easier.'
Next, Shimla added a parameter called the Travel radius of the infected person. This means that a latent infected person could transmit a new type of coronavirus infection to an opponent who is separated by a parameter number. This parameter is set in consideration of the movement of infected people. The lower the number, the closer to the state where severe movement restrictions are set. However, the number of people encountered in a day remains fixed at '4'.
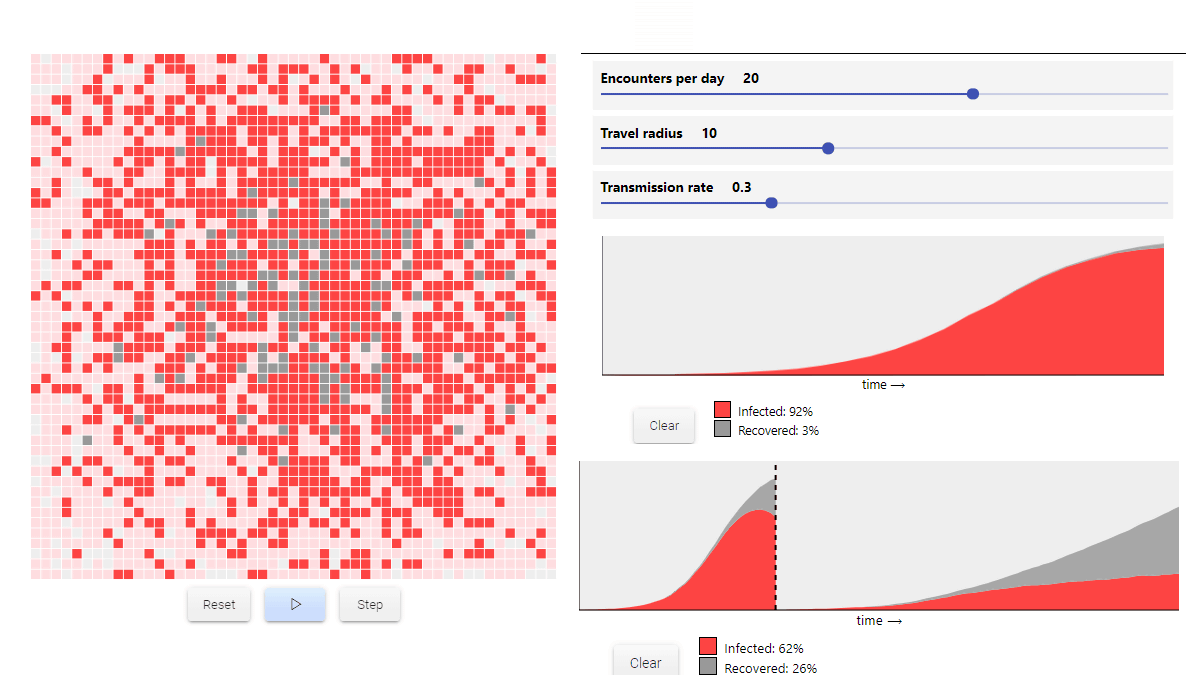
With the addition of the moving radius, the number of infected people increases considerably in grid cells. In the red and gray graphs below the cells, the horizontal axis indicates the passage of time, and the vertical axis indicates the number of infected (red) and recovered (grey) people per day.

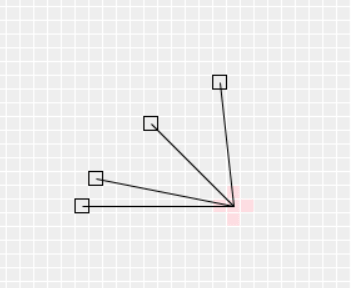
If you want to know how the infection spreads when you restrict movement, you can set a smaller value for this movement radius. For example, the graph below shows the change in the number of infected and recovered people at a moving radius of '15' (left) and '2' (right), and clearly that the increase in infected people has been suppressed by movement restrictions. I understand.
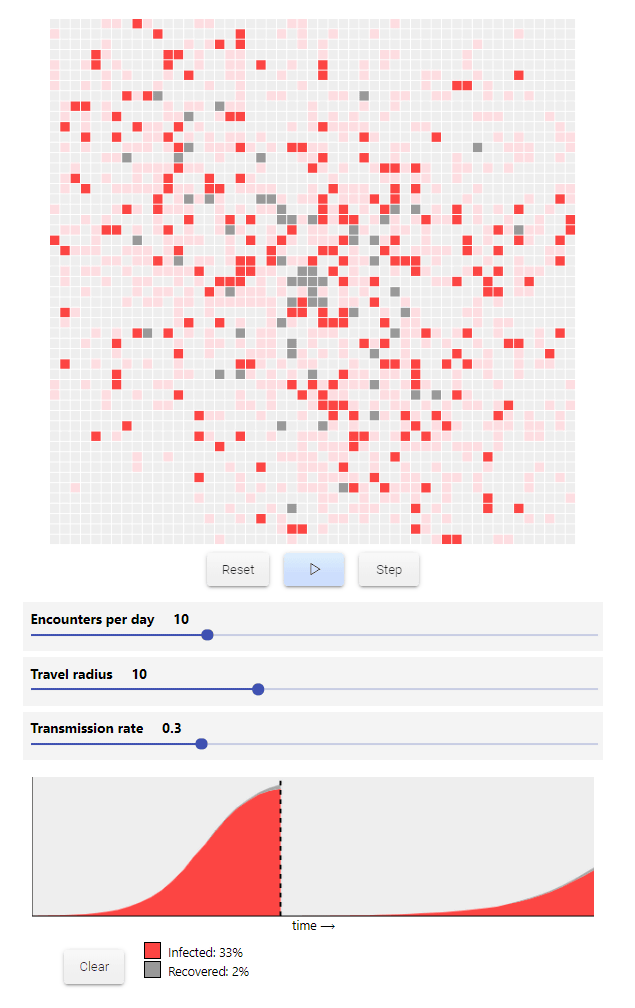
In addition, if the number of infected people can be changed up to 'Encounters per day', it will be as follows. Assuming that the number of people who meet each day is '20', the radius of movement is '10', and the infection rate is '0.3 (30%)', infection spreads explosively, with 3% of the total recovering The infection rate reached 92% at this stage.

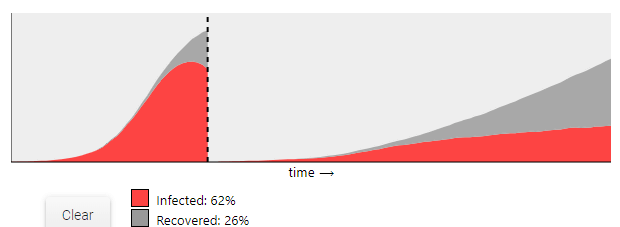
If the number of encounters a day is halved to '10', it is clear at a glance from the following images that even if the moving radius and infection rate are the same, the infection rate can be reduced dramatically. Even over the same number of days, halving the number of encounters a day can dramatically slow the spread of infection.
This 'meeting number per day' can be reduced by taking measures such as closing schools, banning large-scale meetings in public places, and recommending telecommuting. That's why Shimla wrote, `` You should cancel any appointment following the NBA seasonal suspension, '' `` I understand that this is the most important step in fighting the spread of the new coronavirus infection. '' .
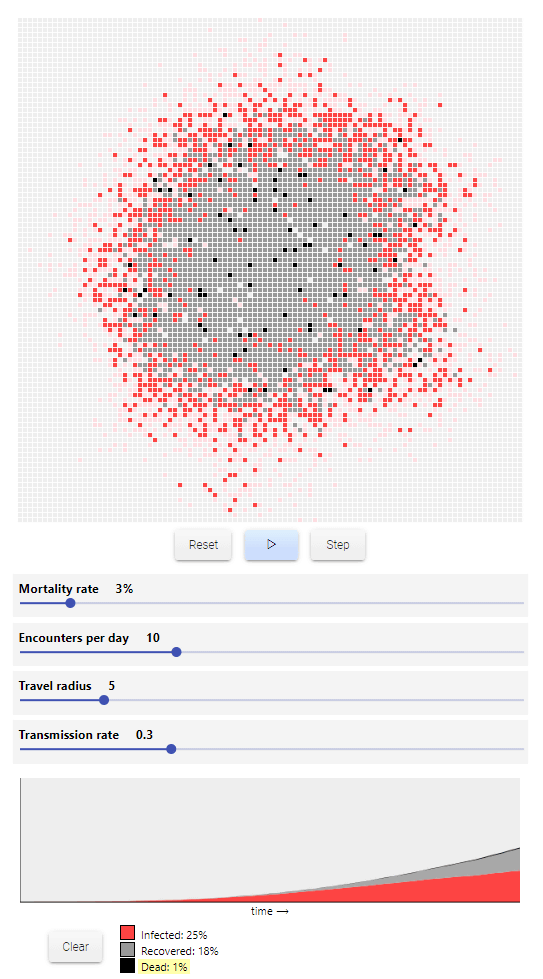
Up to this point, patients with the new coronavirus infection have always recovered, but there are cases where they die. Assuming that the mortality rate (Mortality rate) of the new coronavirus infection is '3%', the number of people who meet in one day is '10', the moving radius is '5', and the infection rate is '0.3 (30%)' And the simulation is as follows. The black color indicates the patient who died, and the final mortality rate is 1%.
And the last parameter to add is the hospital capacity. This is the number of patients that can be treated at a medical institution at one time as a percentage of the population. Poor capacities in this hospital prevent patients from receiving treatment and increase mortality from infected individuals. 'If the number of infected people exceeds the capacity of the hospital, the mortality rate will double,' Shimla said.
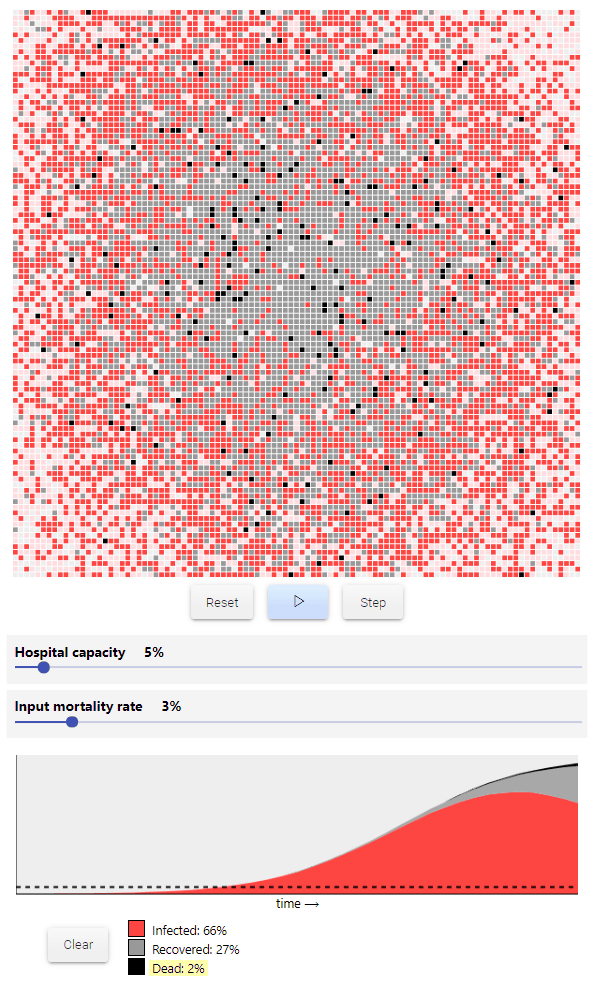
According to Shimla, who ran various simulations, 'probably the worst case scenario will not lose as many lives. People will not die in hospital corridors, but the virus continues to spread Unless we can do the right thing today, a difficult future awaits, so stop travel, stop going out, and leave parents and friends Stop visiting the original, stop eating at the restaurant and cancel any appointments wherever possible. '
Related Posts:


in Note, Posted by logu_ii