6 steps to improve with GitLab caused by “cutting time”

By
Craig Miskel, an engineer at GitLab.com, found out that the `` error that occurred when pulling from a git repository '' reported by a customer was due to a human nature that tends to be caught in a good time The procedure to improve the error is divided into 6 steps.
6 Lessons we learned when debugging a scaling problem on GitLab.com | GitLab
https://about.gitlab.com/2019/08/27/tyranny-of-the-clock/
Mskel received a report from a GitLab.com customer that 'Git pull errors are seen intermittently.' The reported error messages are:
[code] ssh_exchange_identification: connection closed by remote host
fatal: Could not read from remote repository [/ code]
Because this error message was intermittent and unpredictable, Miskel's team was unable to reproduce the error on demand or clearly show what was happening in the graphs and logs . Similarly, there were reports that the SSH client was lost, but it seems that the client or the virtual machine is unstable, the firewall is out of control, ISP changes, or application problems, It was considered a separate issue from the reported error.
As an initial clue, Mskel's team contacted a customer who had reported errors several times a day and used it as a starting point. I asked the customer to provide the relevant public IP address, and did a packet capture on the frontend HAproxy node to try to isolate the problem from a smaller data set than all SSH traffic. Fortunately, the customer was using an alternate-ssh port and only two HAProxy servers to check.
Despite the constraints, there was about 500MB of packet capture per 6.5 hours and Miskel's team found a short connection where the client sent a version string identifier after the TCP connection was established . Later, HAProxy immediately disconnected with the proper TCP FIN sequence, and it turned out that it was GitLab.com.
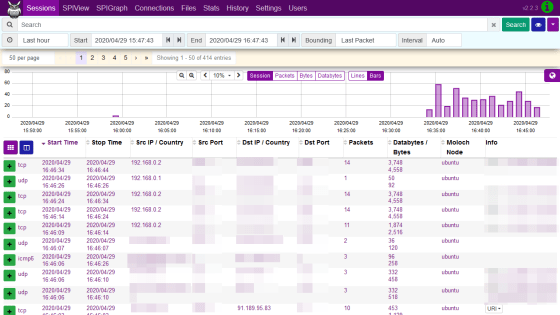
◆ 1: Survey by Wireshark
Wireshark 'Conversations' displays the basic breakdown of the time, packet, and byte of each TCP connection in the capture and can be sorted. You can easily find the connection with the few packets you were looking for in the Conversations view. Using this feature, we searched for other instances and found that the first instance found was not an outlier.
Miskel's team first investigated packet captures based on time and TCP port, and identified one of the incident log entries to see why HAProxy disconnected the client. This was a big discovery, and the most interesting in the details of that entry was the SD t_state attribute
From the HAProxy document:
[code] S: aborted by the server, or the server explicitly refused it
D: the session was in the DATA phase. [/ Code]
D was fairly clear and matched the packet capture because the data was sent after the TCP connection was properly established. S means that HAProxy has received an RST or ICMP error message from the backend. Everything can be considered, from network problems such as glitches and congestion to application-level problems, so there was no direct clue as to which case occurred. Aggregating the Git backend using BigQuery was not an error specific to any virtual machine. The SD log turned out not to be specific to the problem that Miskel's team was looking into.
When capturing traffic between HAProxy and Git server and using Wireshark, we found that the SSHD on Git server was disconnected from TCP FIN-ACK immediately after the TCP 3-way handshake. HAProxy has not yet sent the first data packet, and the Git server's TCP RST responded immediately after it was sent. It became clear that SSH intentionally closed the connection because HAProxy recorded a connection error with SD. RST is an artifact of the SSH server that receives the packet after the FIN-ACK and does not mean anything here.
When monitoring and analyzing SD logs with BigQuery, a considerable amount of clustering is progressing on the time axis, with a peak in the first 10 seconds every minute, reaching a peak in about 5-6 seconds It became clear that
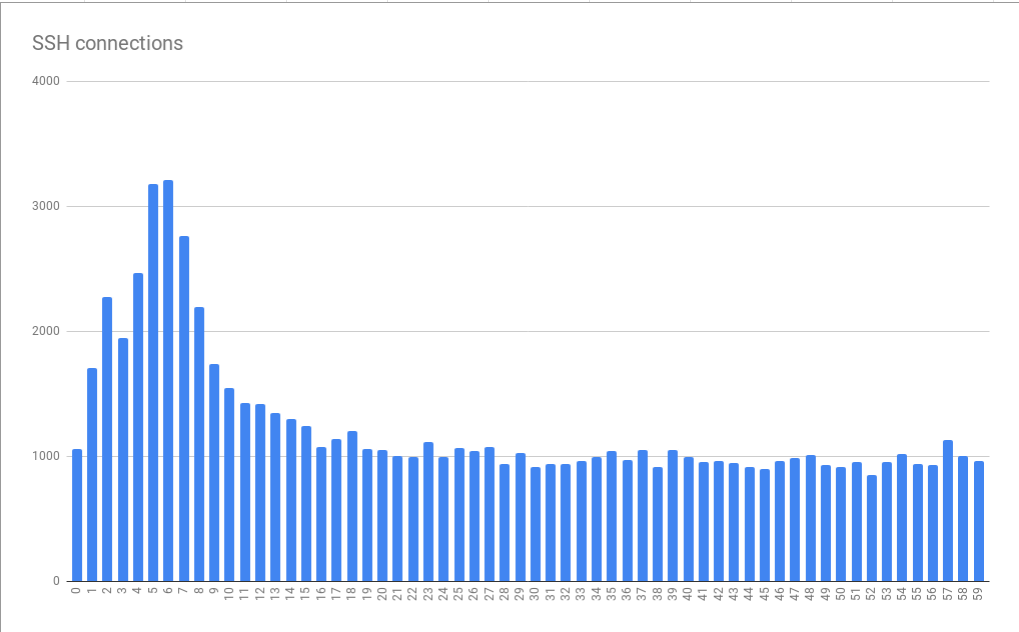
The graph above is created from data that has been collated over several hours. The pattern of the graph is consistent over minutes to hours and has been suggested to worsen at certain times of the day. Interestingly, the average spike is three times the base load and there are scaling issues, so simply providing “more resources” for the virtual machine to accommodate the peak load can be very expensive. It meant to be. This was the first clue to the systematic problem that Mr. Miskel calls “clock rule”.
Because humans prefer to think about things in a crisp time, jobs run in crisp times, such as at the start of a minute or an hour. If preparation takes a few seconds before running git fetch from GitLab.com, the connection pattern will increase by a few seconds per minute, which means that errors will increase during that time.
◆ 2: Many people set the time appropriately via NTP
Mskel says that this error would not have been apparent unless many people set the time properly via NTP or similar. So what causes SSH to disconnect?
When Mskel's team looked at the SSHD documentation, MaxStartups was found to control the maximum number of connections that can be pre-authenticated. It seems that at the peak of the first 10 seconds, the job or connection limit scheduled on the Internet was exceeded. MaxStartups includes three numbers: the low water mark (number of connections to begin dropping), the percentage of connections that randomly drop over connections that exceed the low water mark, and the absolute maximum at which all new connections are dropped there is. The default value is 10: 30: 100, and the setting at this point was 100: 30: 200, so there was evidence of apparently increased connections in the past.
Annoyingly, the only way to verify that MaxStartups was compromised in openssh version 7.2 on the server was to enable debug level logging. Since this would leave all data running, it was turned on for a short time on only one server. The results revealed that MaxStartups was compromised within a few minutes and the connection was lost early.
In OpenSSH 7.6 (the version that comes with Ubuntu 18.04), we found that the MaxStartups log was correct. I had to get verbose logs to see it
◆ 3: Log recording at the default level
Now that the cause of the problem is known, Misskel's team has examined how to deal with it. Even if you can increase MaxStartups, there is a problem such as how much it costs, but even if there is a small amount of memory, there is no adverse effect on the downstream, so it did not go out of speculation, so the value of MaxStartups is set to 150: 30: 300 (50% increase) and tested. As a result, there was a big improvement effect, and there was no visible negative effect such as an increase in CPU load.
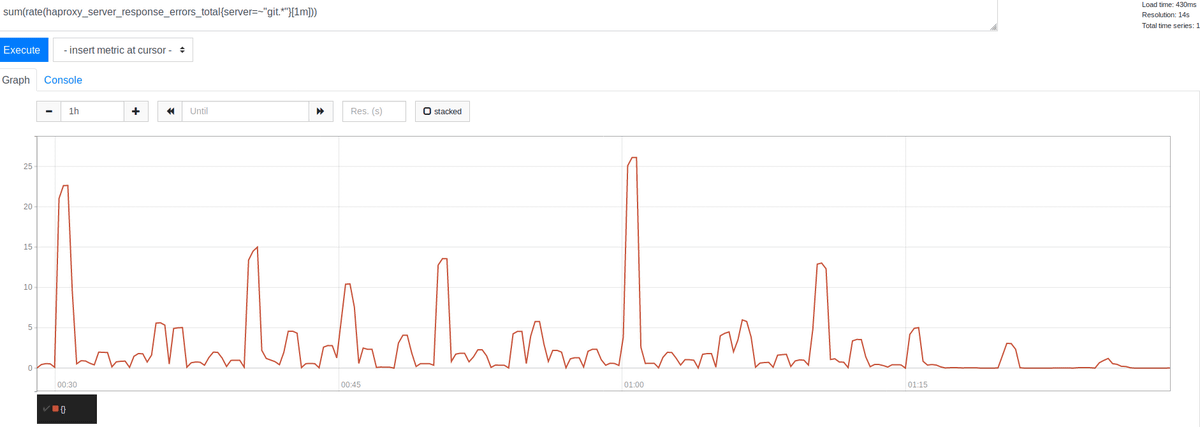
Focusing on the significant decrease since 01:15, we were able to clearly eliminate most of the errors. Interestingly, these are clustered at the beginning of the time, every 30 minutes, every 15 minutes, and every 10 minutes, at the best time. The largest peak was seen at the beginning of the time, and the result seems reasonable. Many people schedule jobs to run every hour, so this result is evidence to support the theory that scheduled jobs cause spikes, and errors due to numerical limitations have occurred. Shows that.
There was no obvious negative impact of increasing MaxStartups, the CPU usage of the SSH server remained approximately the same, and no significant load increase occurred. Even in a busy state, the connection was not interrupted and was considered a promising means.
Mskel's team not only increased MaxStartups but also sought other improvements. Focusing on the HAProxy layer in front of the SSH server, we examined the 'rate limiting session' option provided for the HAProxy front-end listener. If set, the front end will limit new TCP connections per second to communicate to the back end, leaving additional incoming connections on the TCP socket. If the incoming rate measured every millisecond exceeds the limit, the new connection will be delayed, and the TCP client (in this case SSH) will check the delay before the TCP connection is established, I thought it would be fine as long as the overall rate was over the limit and there was no overly high spike.
The next problem was the number to use. There are 27 SSH backends and 18 HAproxy frontends (16 mains, 2 alt-ssh), which is complicated by the fact that the frontends do not coordinate with each other due to rate limiting. You must also consider the time it takes for a new SSH session to pass authentication. Assuming MaxStartups of 150, if the authentication phase took 2 seconds, only 75 new sessions per second could be sent to each backend.
This change did not have a noticeable effect on the error rate, and Mskel suffered a lot. Returning to the log, and finally the HAProxy metric survey, confirmed that the rate limit was working to the specified number, and confirmed that a high percentage of records were sent in record but measured It was not close enough to the possible numbers. An excerpt of the backend recorded by HAproxy showed a strange point. At the beginning of the hour, the backend connections were not evenly distributed across all SSH servers, and the sample time taken varied from 30 to 121 in one second, and the load balancing was not balanced. . I checked the configuration and found that the balance source was used so that a specific client IP address always connected to the same backend. So we tried to change to the load balancing algorithm leastconn, which distributes new incoming connections to the backend with a minimum number of connections. This is a result of CPU usage for the SSH (Git) fleet.
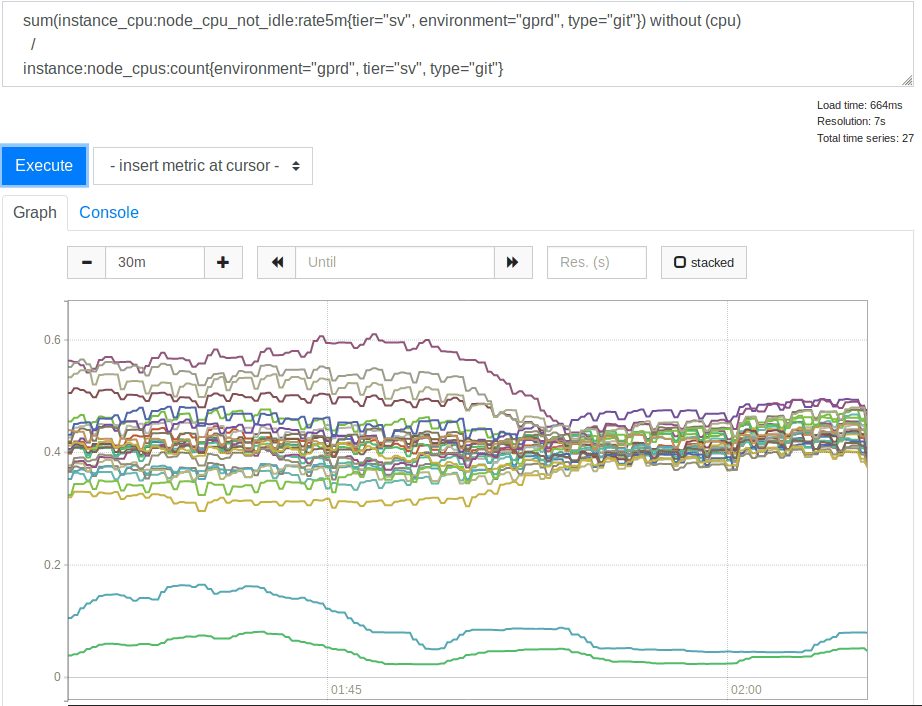
It was a good idea to use leastconn. Since the two low usage lines are canary servers, they are ignored and the other spreads before the change were 2: 1 (30% to 60%). The load was much higher than the backend.
◆ 4: If you want to change the default settings, you should leave a comment or provide a link to the reason / document / issue
Mskel says transparency is one of GitLab's core values . Since turning on leastconn reduced the error rate, I decided to use this method. As part of the experiment, reducing the rate limit to 100 further reduced the error rate, suggesting that the initial estimate of T may have been incorrect. Since the initial estimate of T was too small and rate limiting was too high, and even 100 / s was felt low, Misskel was not going to drop any more. For operational reasons, unfortunately the above two changes were just an experiment and had to be rolled back to balance source and rate limit 100. Since leastconn is not enough, I tried to make rate limit as low as possible and increase MaxStartups. First increased to 200 and then to 250. As a result, there were almost no errors and no adverse effects occurred.
◆ 5: Even if MaxStartups is much higher than the default, there is almost no impact on performance.
Mistkel says MaxStartups is a powerful lever that can be pulled as needed. For T estimation, the time to establish and authenticate an SSH session, 200 is not enough for MaxStartups and 250 is enough, so if you reverse-engineer the equation, T is probably 2.7-3.4 seconds Can be calculated. I checked the log again and found that if t_state is SD and b_read (number of bytes read by the client) is 0, a specific failure is caused. Approximately 26 to 28 million SSH connections are processed per day. In the worst case, I discovered that about 1.5% of connections were dropped.
◆ 6: Measure actual error rate as soon as possible
If you were aware of the scope of the problem, you might have prioritized resolution, but depended on knowing the identity characteristics. On the plus side, after reaching MaxStartups and rate limits, the error rate dropped to 0.001%, or thousands of a day. It was an excellent improvement, but the error rate was still higher than Misskel thought. After unblocking other operational issues, the minimum connectivity changes could be formally deployed, and the error was completely eliminated.
The SSH authentication phase will probably take up to 3.4 seconds. GitLab can use AuthorizedKeysCommand to look up SSH keys directly in the database. This is important for quick operation when a large number of users are connected, otherwise SSHD needs to read very large authorized_keys file in order to find the user's public key and cannot scale well . Implement a lookup in Ruby that calls the internal HTTP API. Stan Fel, an engineering fellow, has identified that Unicorn instances on Git / SSH servers recognize many queues.
This can contribute significantly to the pre-authentication phase of about 3 seconds, so further investigation is needed. There is always a worker available in SSH because these nodes can increase the number of Unicorn (or puma) workers, but this method is risky and requires proper measurements . Work continues toward resolution, but the speed has been reduced due to the mitigation of core user issues. Eventually, MaxStartups may be reduced, but it is rarely needed as there is no negative impact. You should also warn if you see a HAProxy log indicating that a problem is occurring, in which case you need to increase MaxStartups further. If resources are constrained, you need to add a Git / SSH node.
◆ Conclusion
Complex systems have complex interactions and often have multiple levers that can be used to control different bottlenecks. Since there are often trade-offs, it is good to know what tools are available, and the assumptions and assumptions are dangerous, and as a result we tried to get measurements that took a short time to authenticate, T estimate is better.
The biggest lesson is that scheduling a job on a 24-hour basis can lead to very interesting scaling issues for central service providers like GitLab, if you are one of them, Mr. Mskel said he would consider taking a 30-second random sleep at the start, or choosing a random time of the day to enter random sleep and fighting “clock domination”.
Related Posts:


in Software, Web Service, Posted by darkhorse_log