A valuable report 'Internet Trends 2019' that shows 'what happens to the Internet from now on' with 333 slides
Finally, the internet users exceed the majority of the world's population, the time spent on mobile is the first to exceed the time to watch TV, and the situation related to the game industry and the advertising industry is also changing dramatically. The next report ' Internet Trends 2019 ' has been published. Anyway, because there is a lot of data, I tried to put together a particularly interesting graph from 333 slides.
INTERNET TRENDS-190611_Internet_Trends_2009.pdf
(PDF file)
You can see all of 333 slides in INTERNET TRENDS from the following.
·table of contents
◆ Global Trends of Internet Users in the World
◆ Top 10 companies in the world by market capitalization
◆ E-commerce sales slow down
◆ Trends in Internet Advertising
◆ The Internet usage of people
◆ The role of 'image' in the growth of technology
◆ Trends in the game industry
◆ Concern over Internet use
◆ Privacy is a selling point
◆ Digitization of healthcare
◆ Internet situation in China
◆ Global Trends of Internet Users in the World
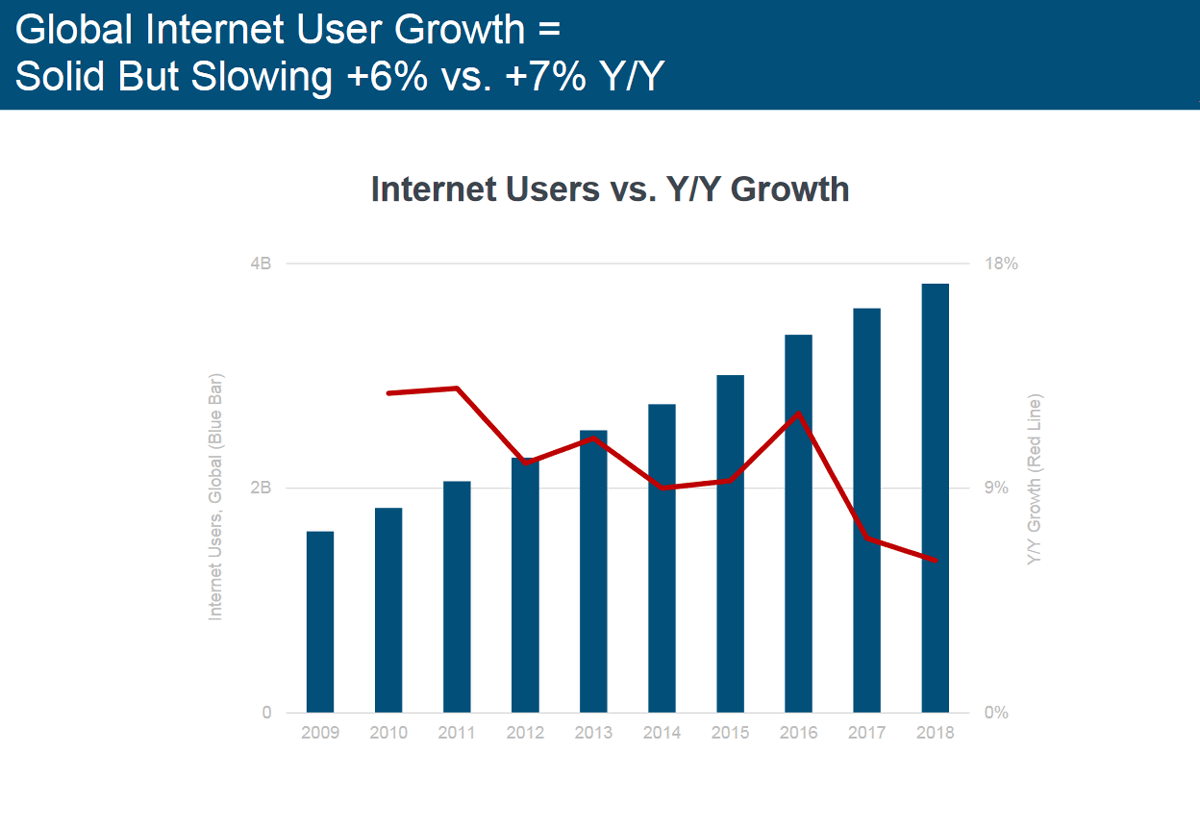
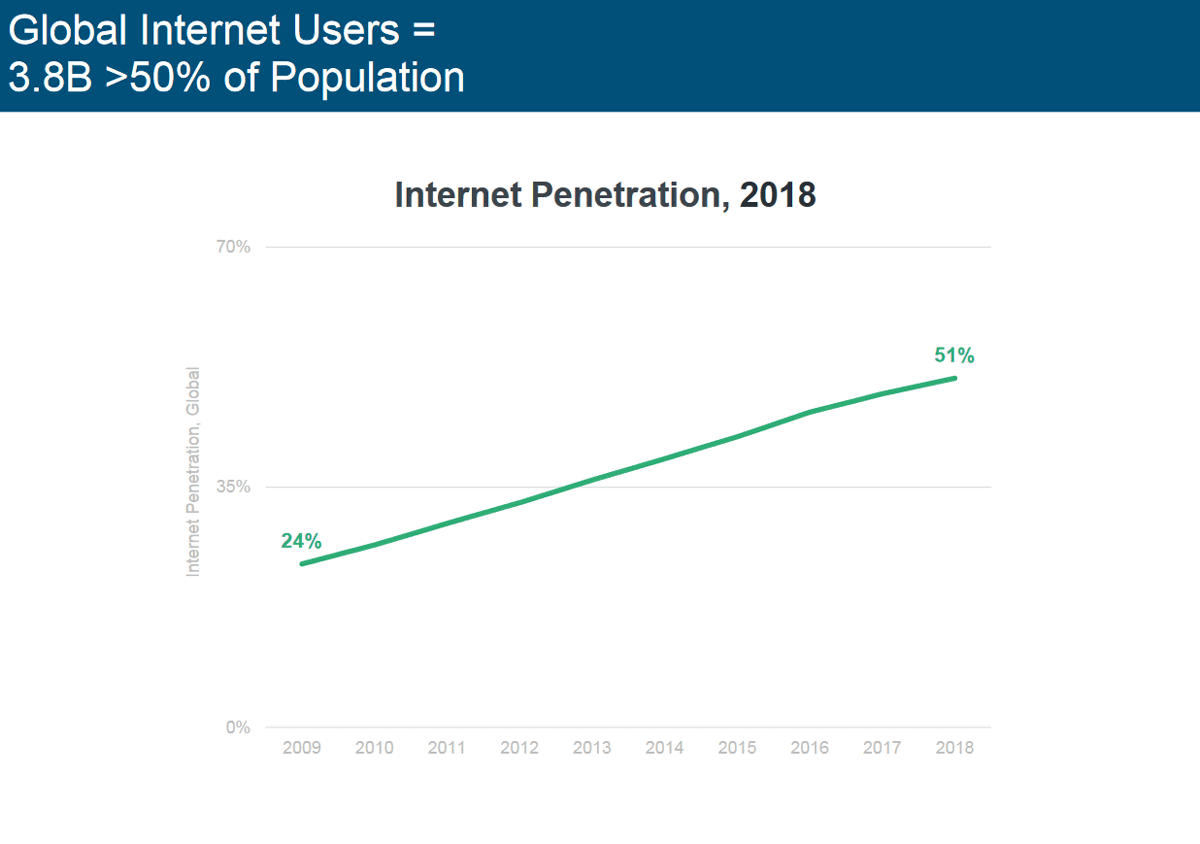
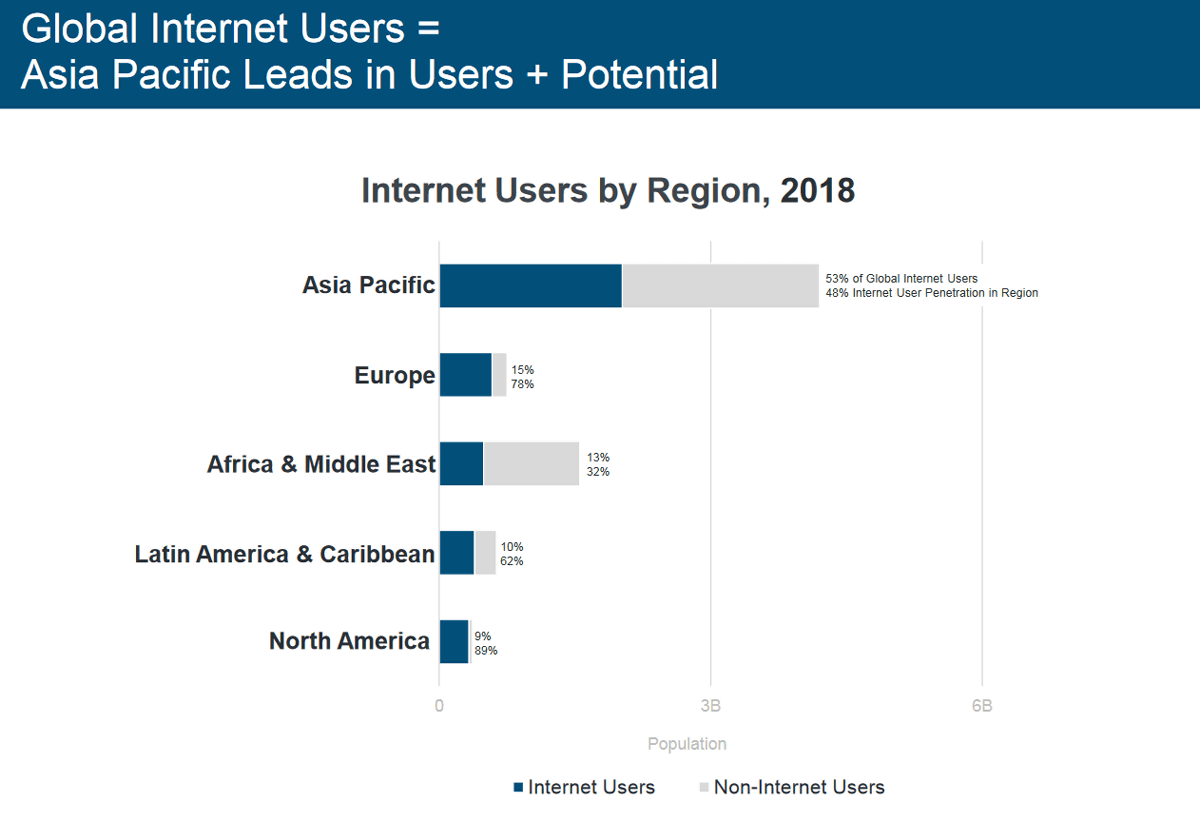
First of all, looking at the entire Internet, its growth tends to slow down as the size of the Internet grows. The number of Internet users in 2018 was 3.8 billion, 51% of the world's population. In 2017, Internet users accounted for 36% of the world's population, or 49% of the world's population. On the other hand, 'people who start using the Internet' are decreasing year by year as the number of Internet users increases, and the year-on-year growth rate shown by the red graph is falling.
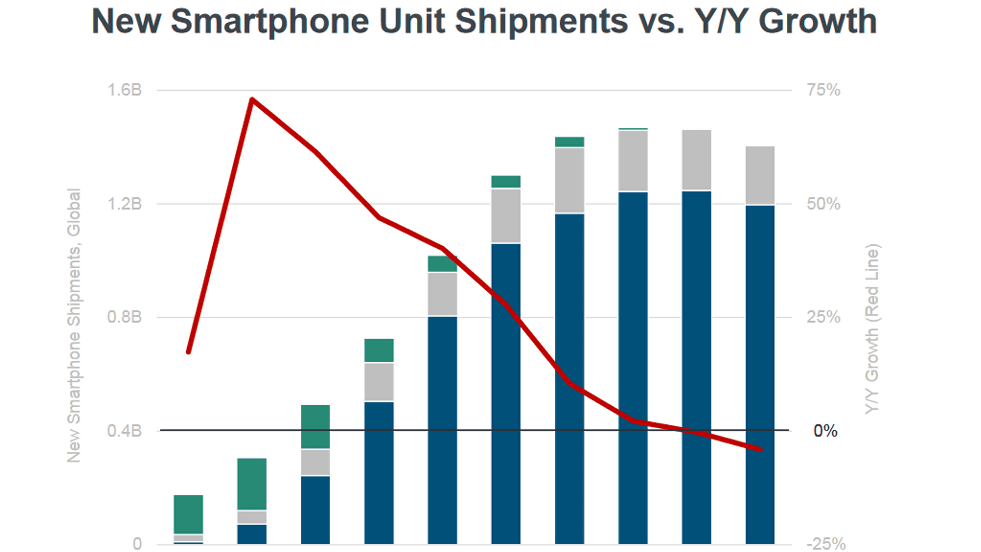
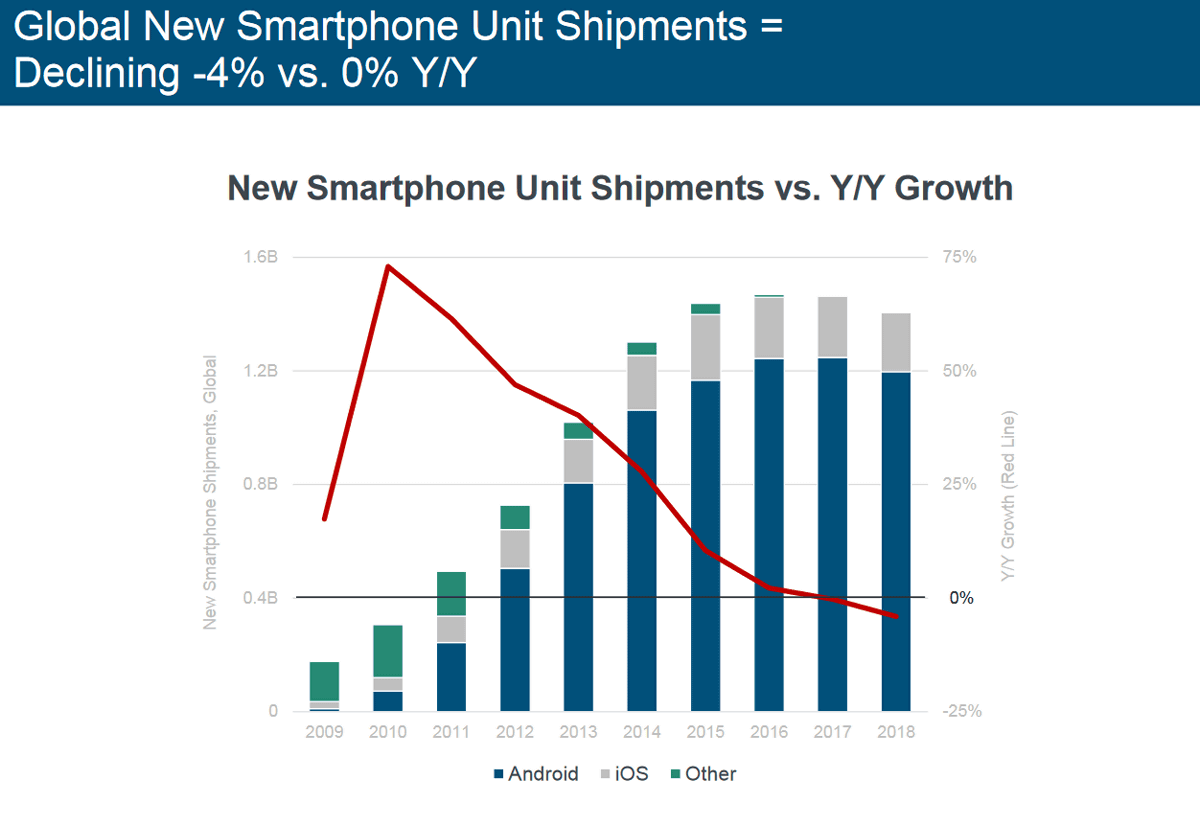
Worldwide shipments of smartphones decreased 4% compared to 2017. From here too, I can feel the tendency for the Internet to go through a period of 'growth'.
Just 10 years ago, the Internet population in 2009 was 24%, so that ratio is doubled in 2018.
Nevertheless, the Asia-Pacific region is still named as a region where new internet users can be expected. Although the United States is almost flat and the absolute population is small, there are many users in Africa and the Middle East who are not yet using the Internet.
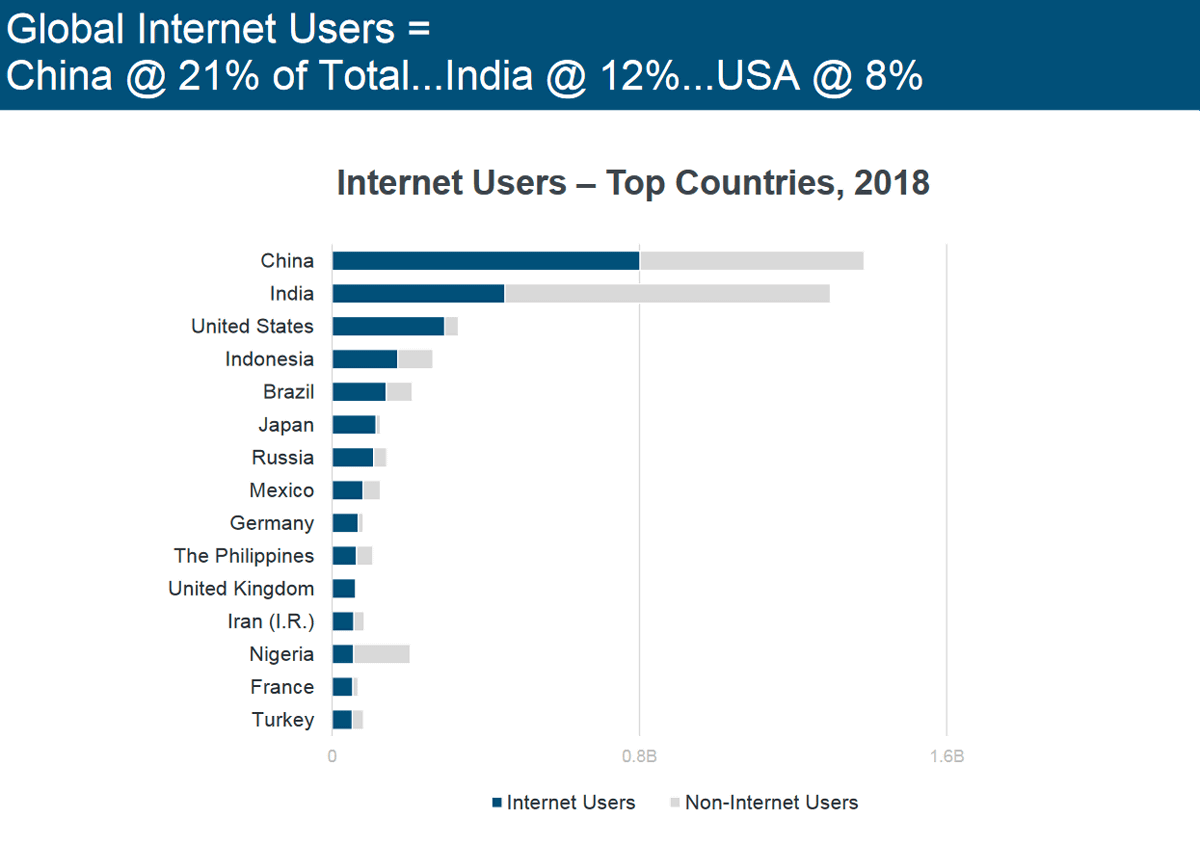
China, India, the United States, Indonesia, Brazil, Japan, and so on rank the countries with the largest number of Internet users. India and China have many Internet users, but also many non-Internet users.
◆ Top 10 companies in the world by market capitalization
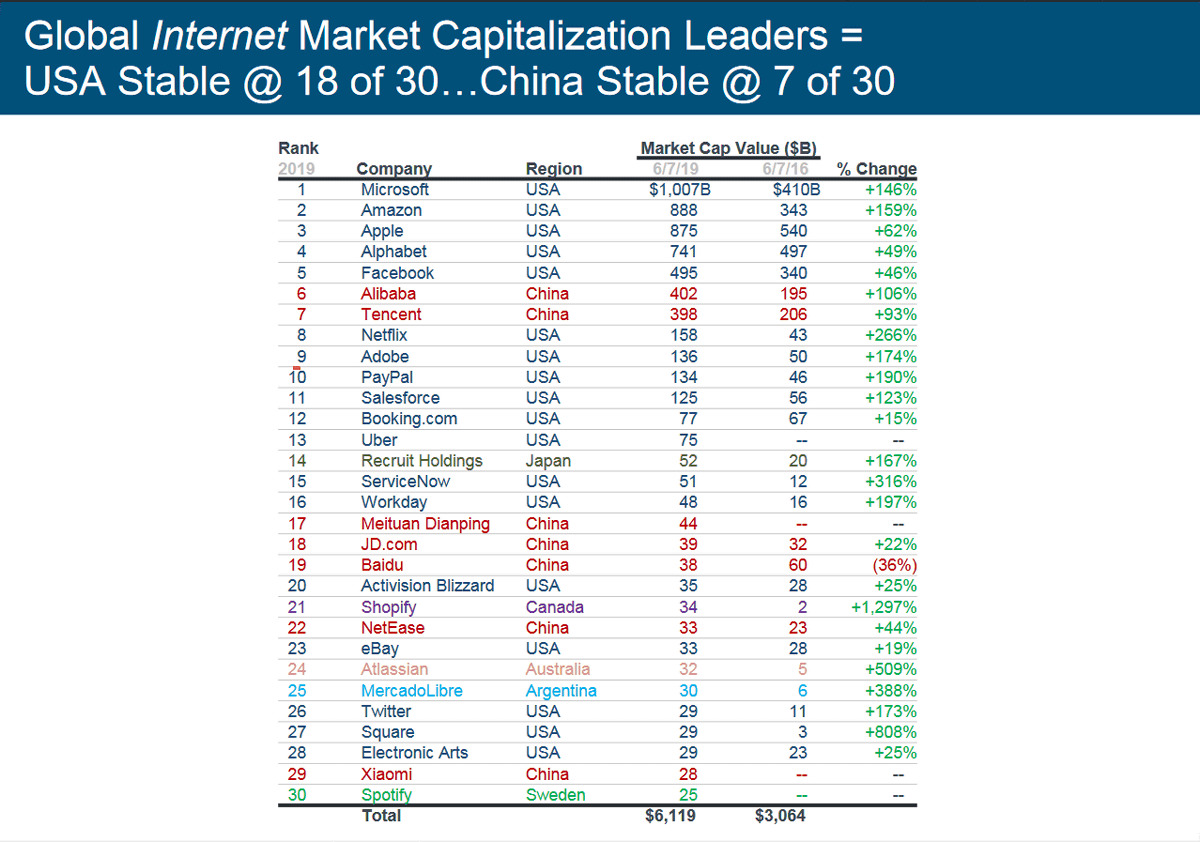
It looks like this when ranking the market capitalization of Internet companies. The top 10 are Microsoft, Amazon, Apple, Alphabet (the parent company of Google), Facebook, Alibaba (Ari 巴巴), Tencent (腾讯), Netflix, Adobe, PayPal, of which 8 are US companies and 2 are Chinese companies. In terms of 'Top 30', 18 companies are American companies and 7 are Chinese companies.
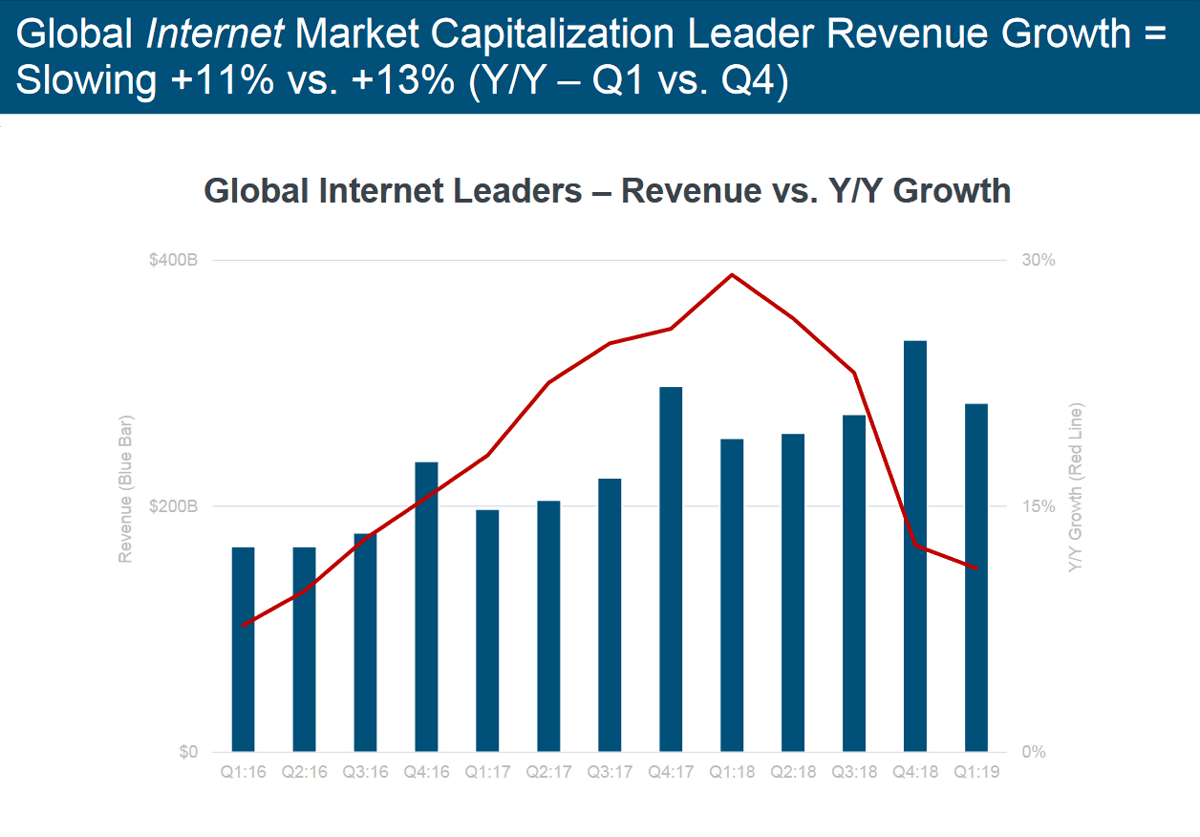
If you look at the transition of earnings of these “Global Internet Leaders” in the top of the market capitalization ranking from 2016, you can see that the overall earnings slowed down to a peak in the first quarter of 2018.
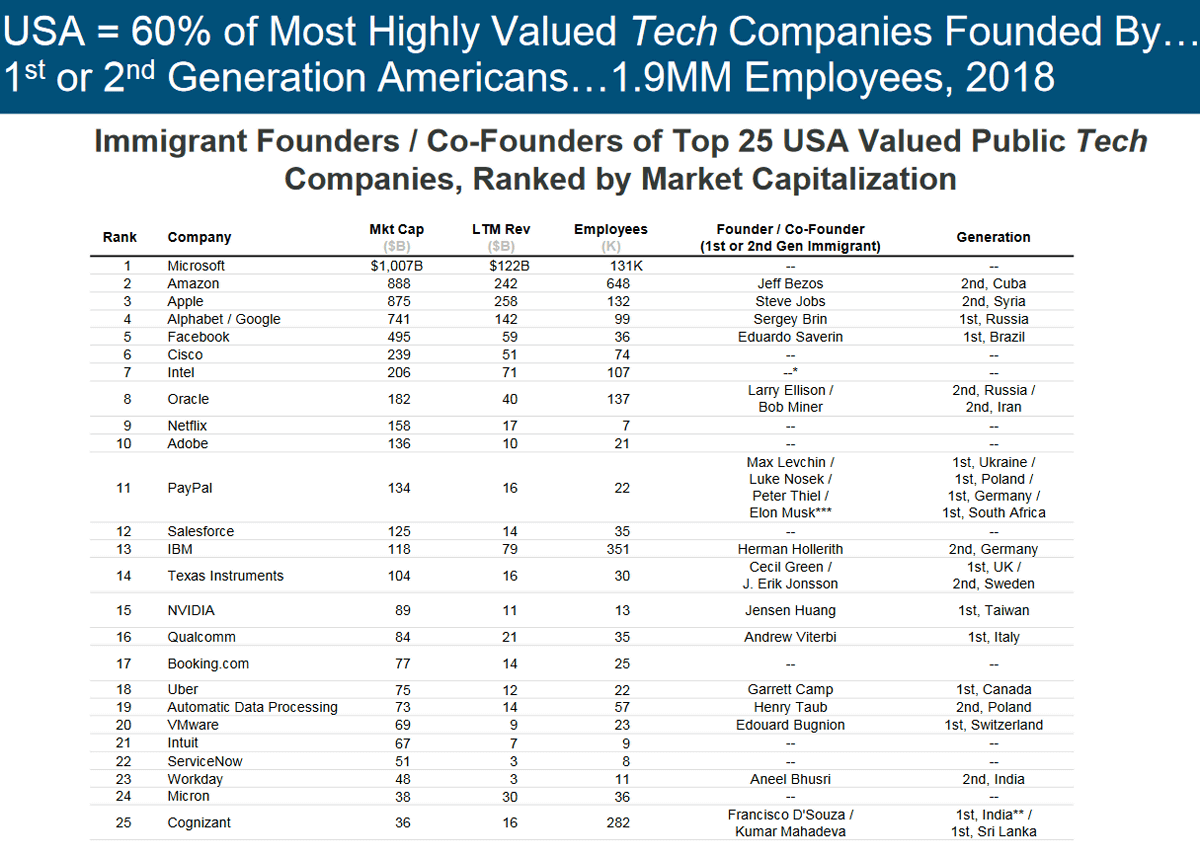
The survey also shows that in the US, 60% of the top technology companies in the market capitalization ranking are first-generation or second-generation immigrant Americans. Amazon's Jeff Besos is Cuba's second generation, Apple's Steve Jobs is Syria's second generation, Google's Sergey Brin is Russia's first generation.
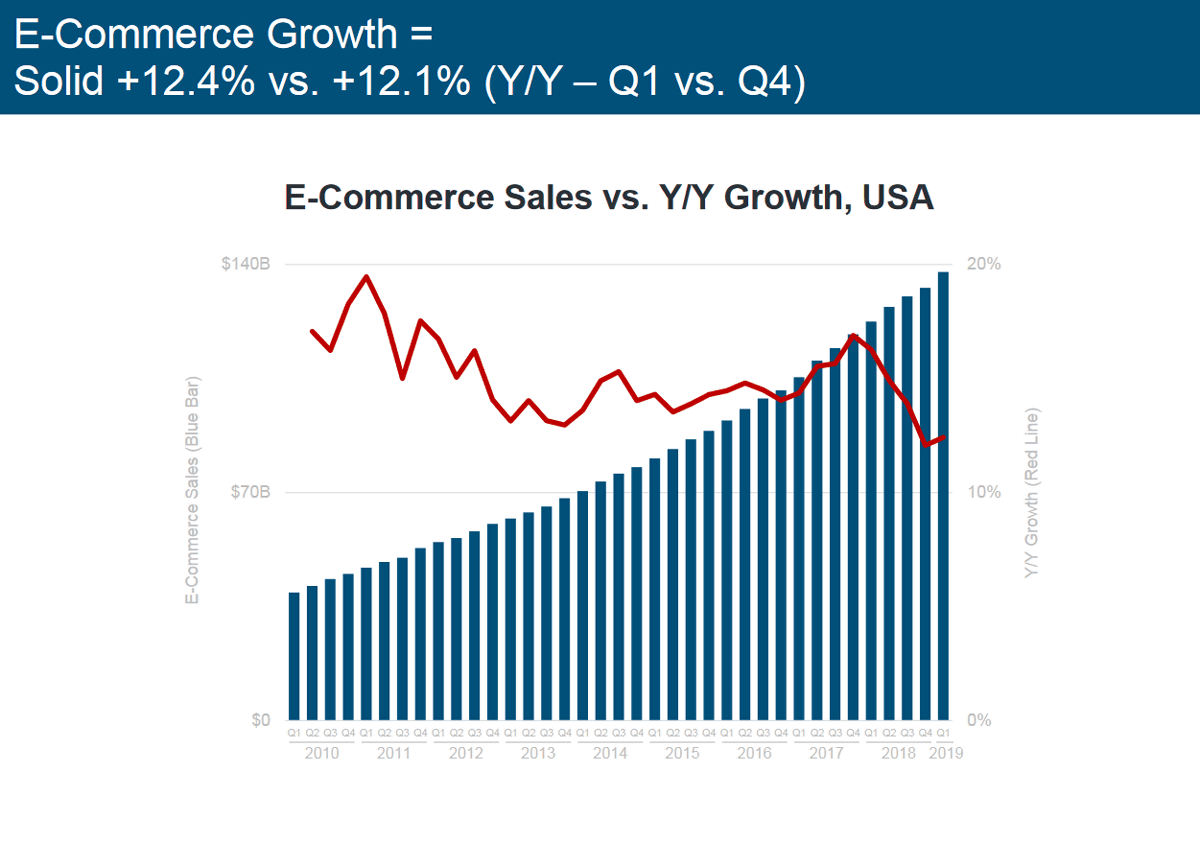
◆ E-commerce sales slow down
So what is the growth of e-commerce? In terms of graphs, although the growth rate is also slowing down, it will rise slightly from the fourth quarter of 2018 to the first quarter of 2019.
◆ Trends in Internet Advertising
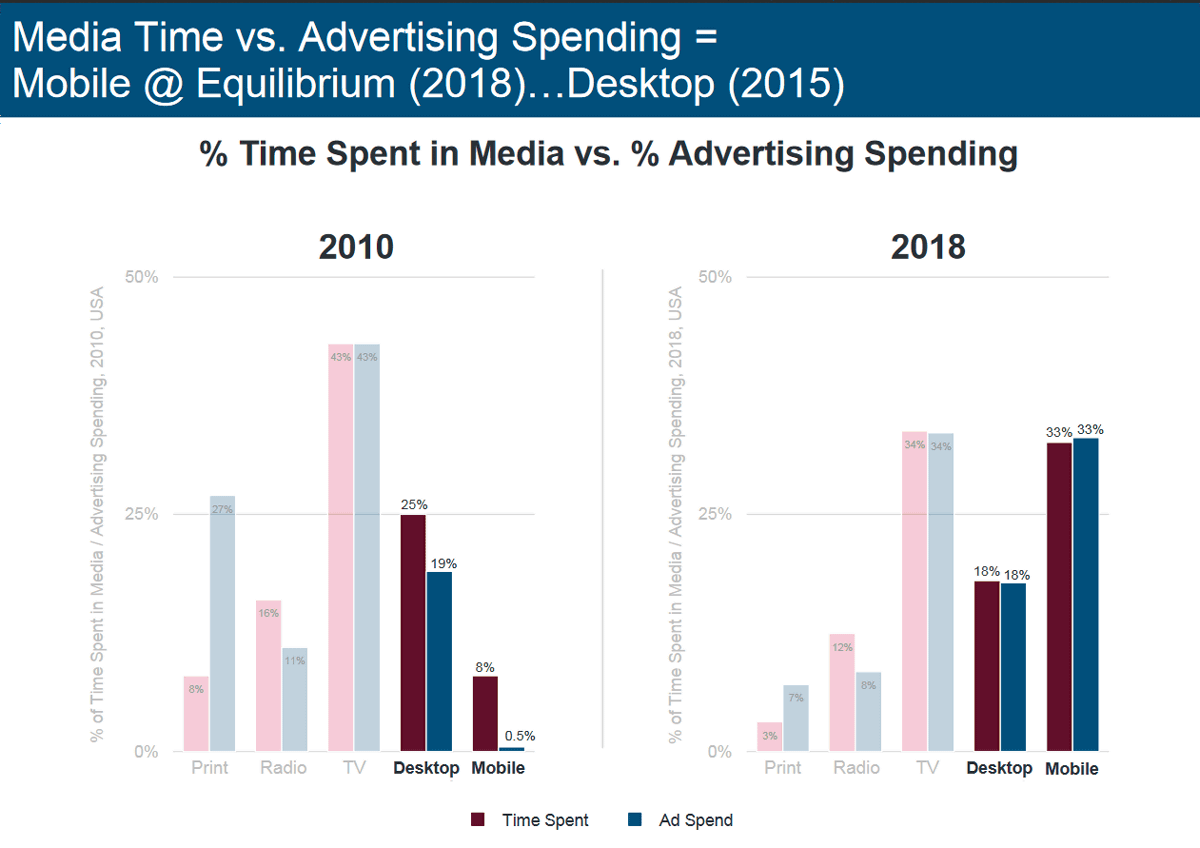
This is a graph comparing the change in time and money spent on advertising in 2010 and 2018. Expenditures on mobile advertising are rising overwhelmingly.
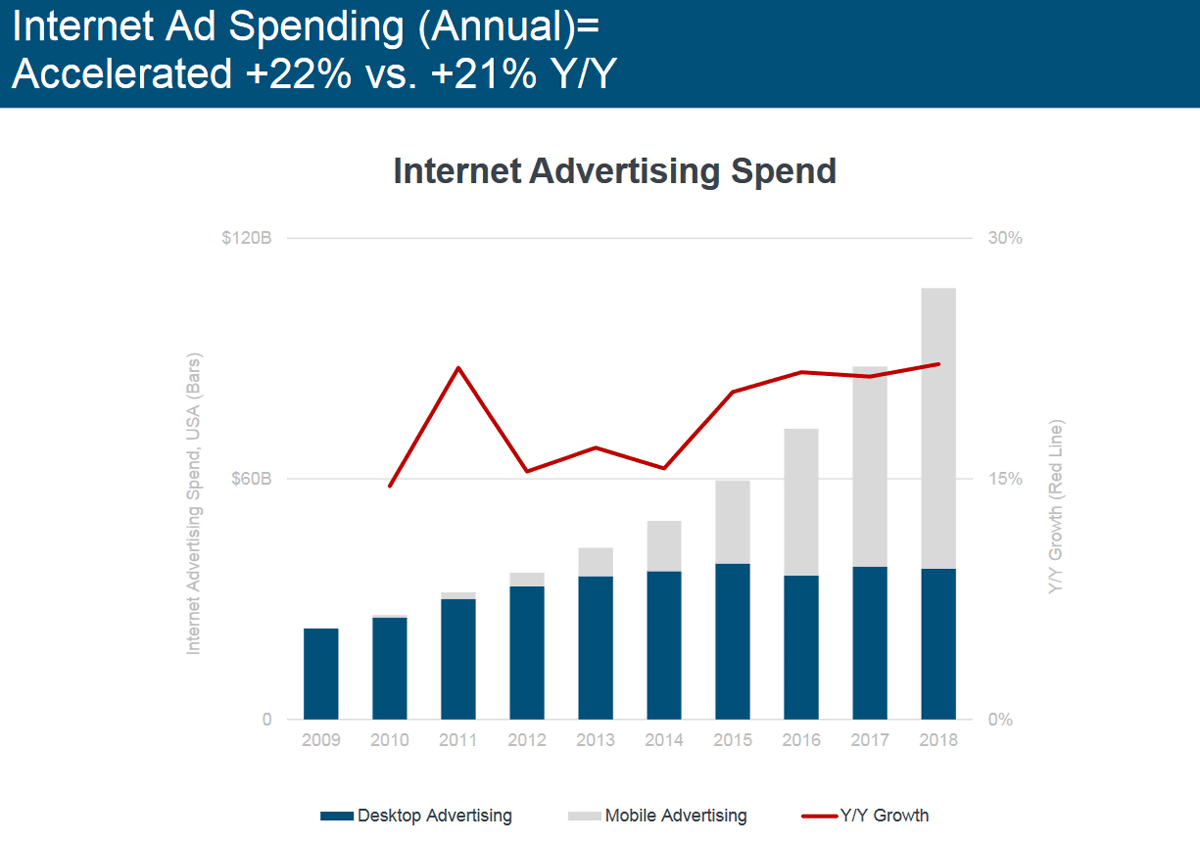
It looks like this is a graph of spending on Internet advertising from 2009 to 2018. While spending on desktop ads hasn't changed much, spending on mobile ads has increased significantly.
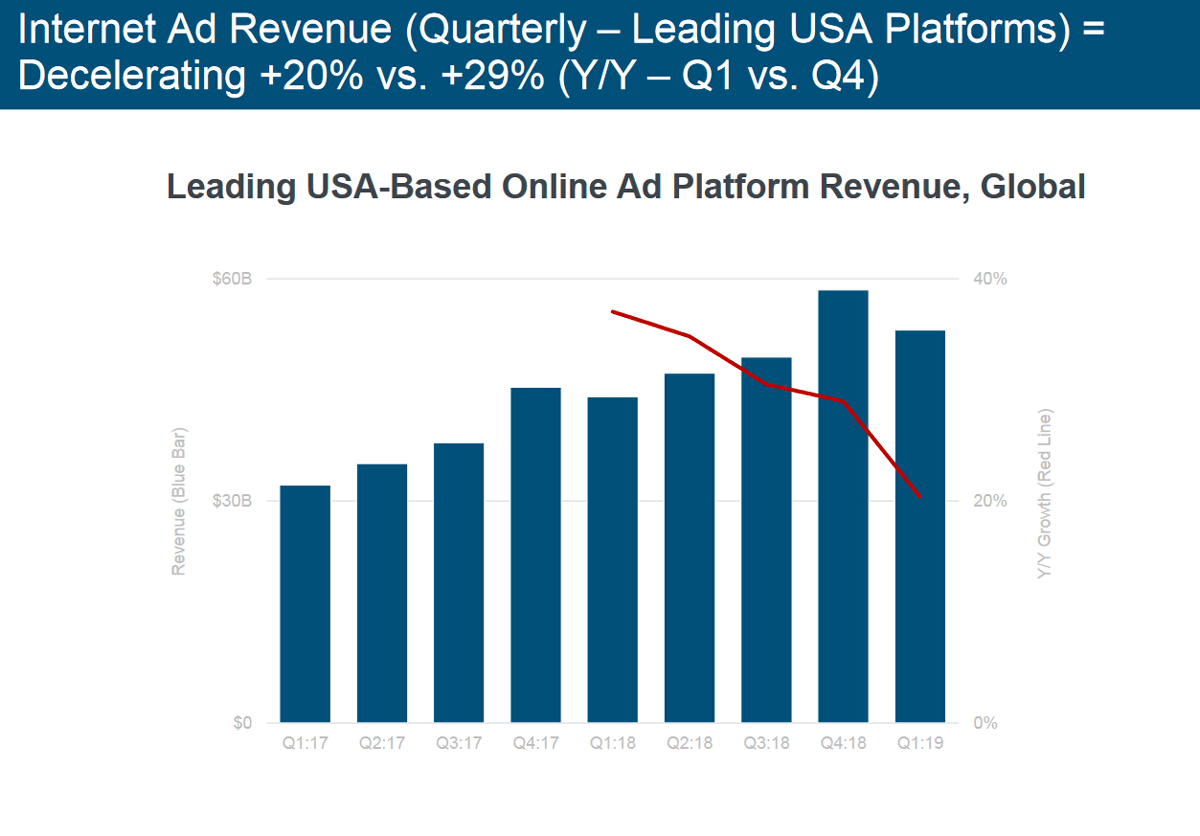
On the other hand, looking at earnings from online advertising platforms based in the United States, it has been declining from the fourth quarter of 2018 to the first quarter of 2019, and the growth rate is also declining.
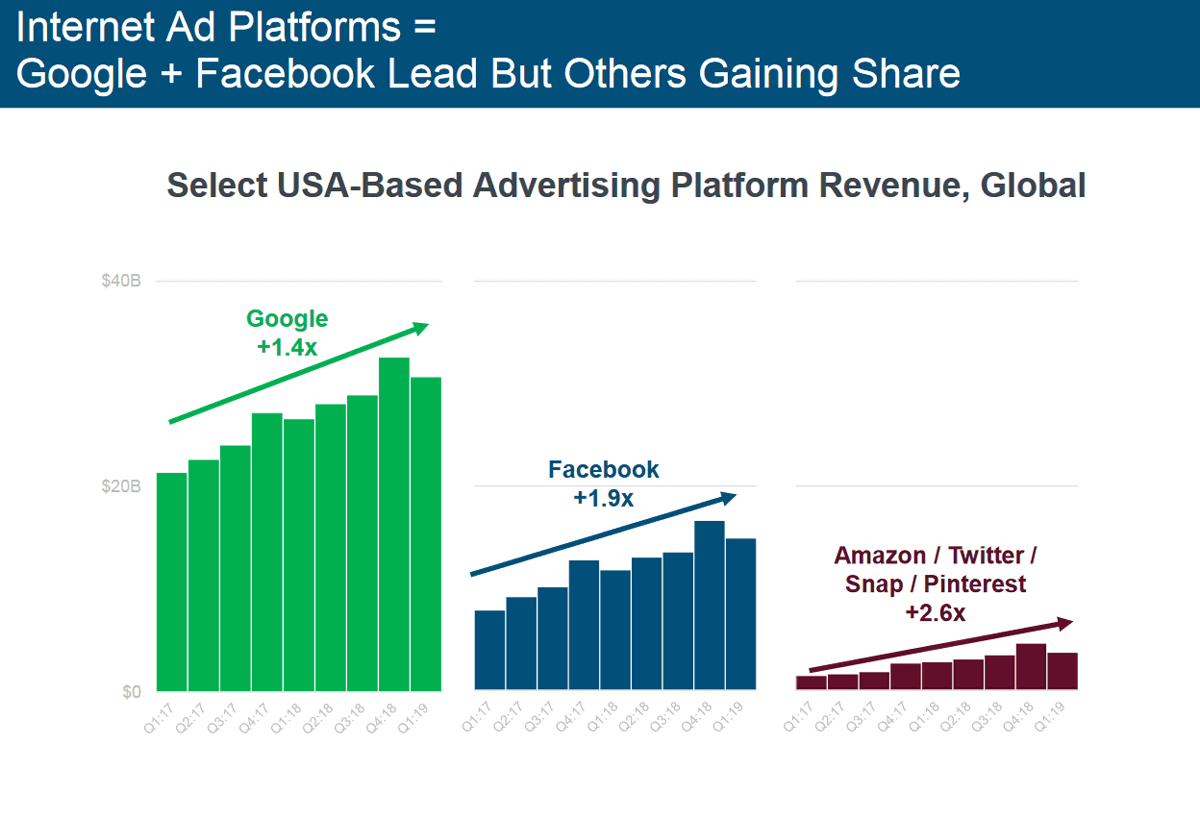
After all, Google and Facebook are two companies that are strong in the Internet advertising platform, but Twitter, Amazon, Snapchat, and Pinterest are also growing significantly.
Also, 62% of all display ads purchased are
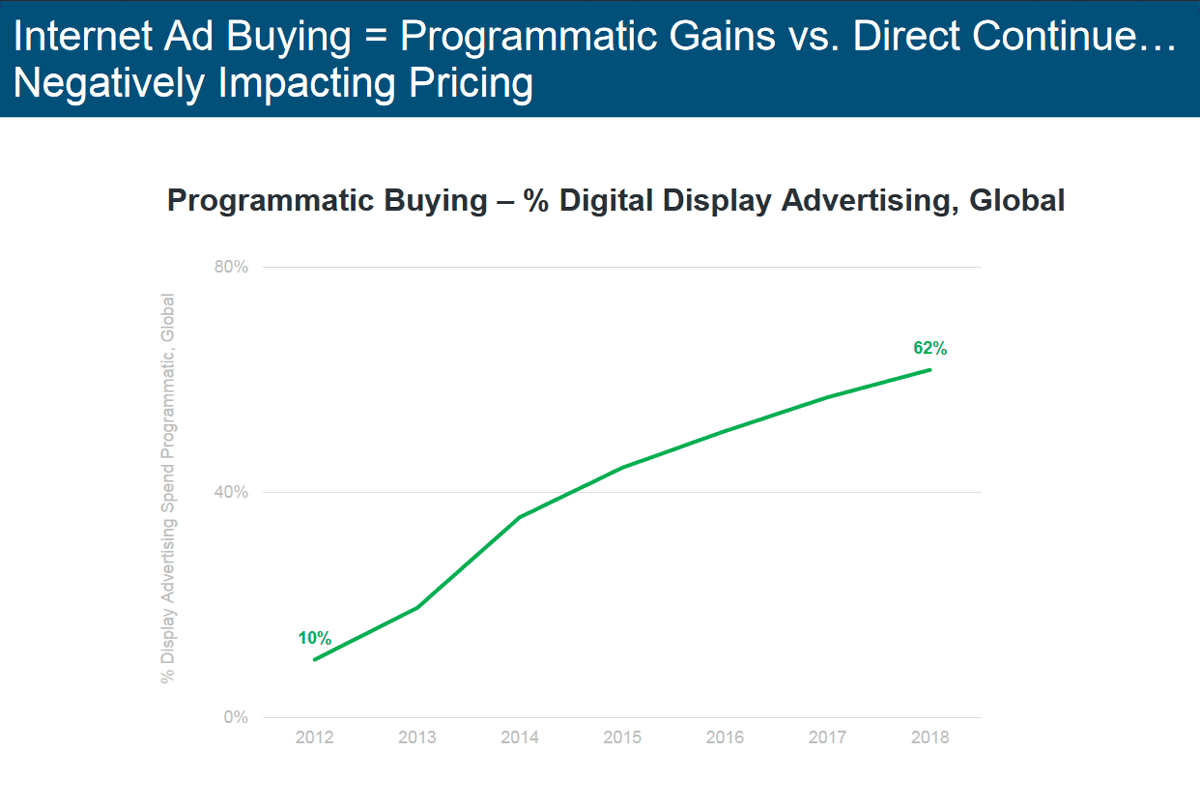
◆ The Internet usage of people
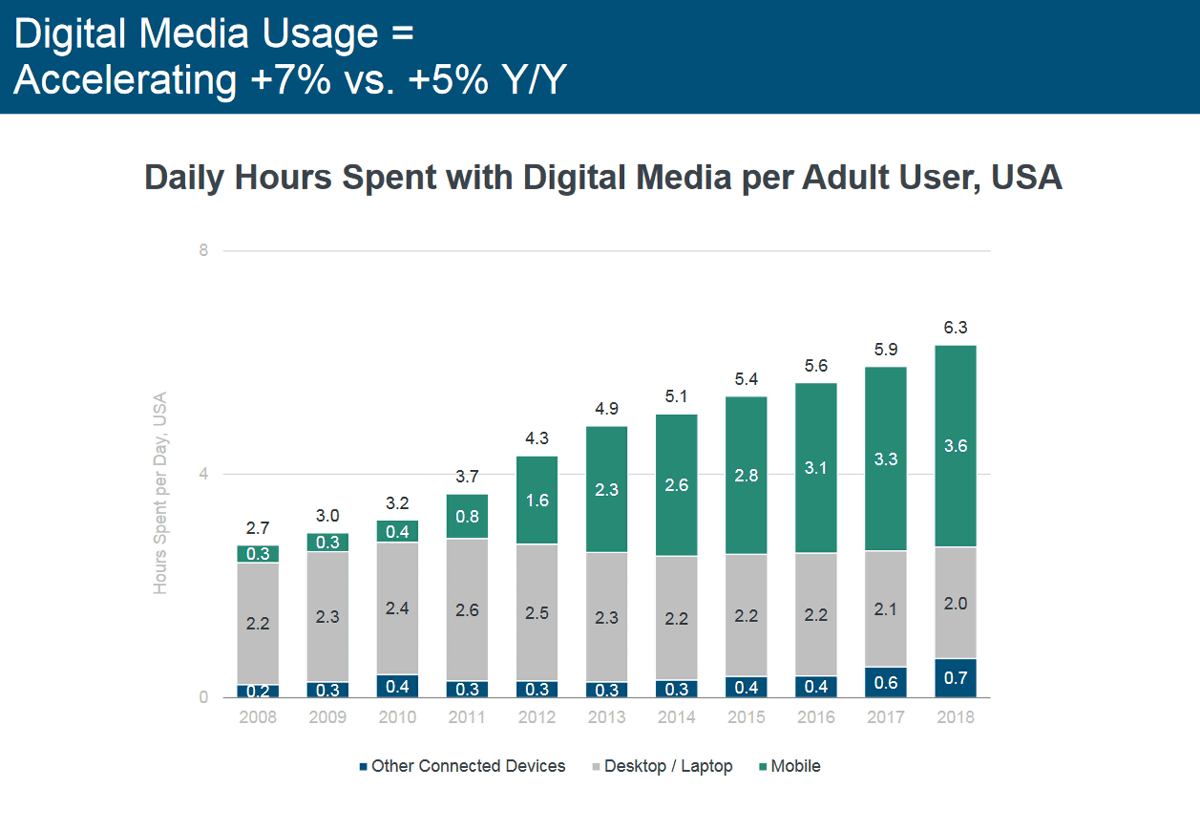
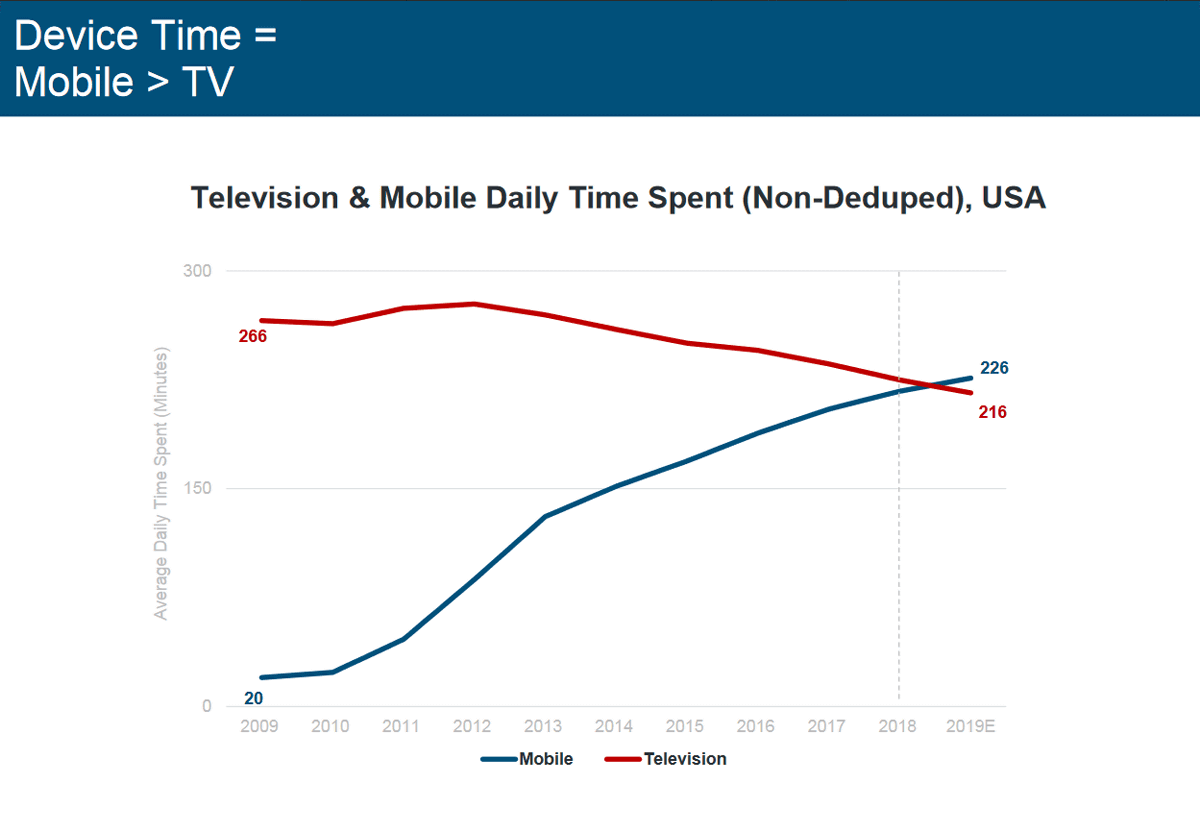
Adults in the United States spend more and more time on digital media each day, and most of them use mobile devices. Time spent on mobile devices was about 3.6 hours a day, desktops and laptops two hours, and other devices 0.7 hours.
And for the first time in 2018, the time spent on mobile exceeded the time spent on TV. It seems that 226 minutes a day is spent on mobile devices.
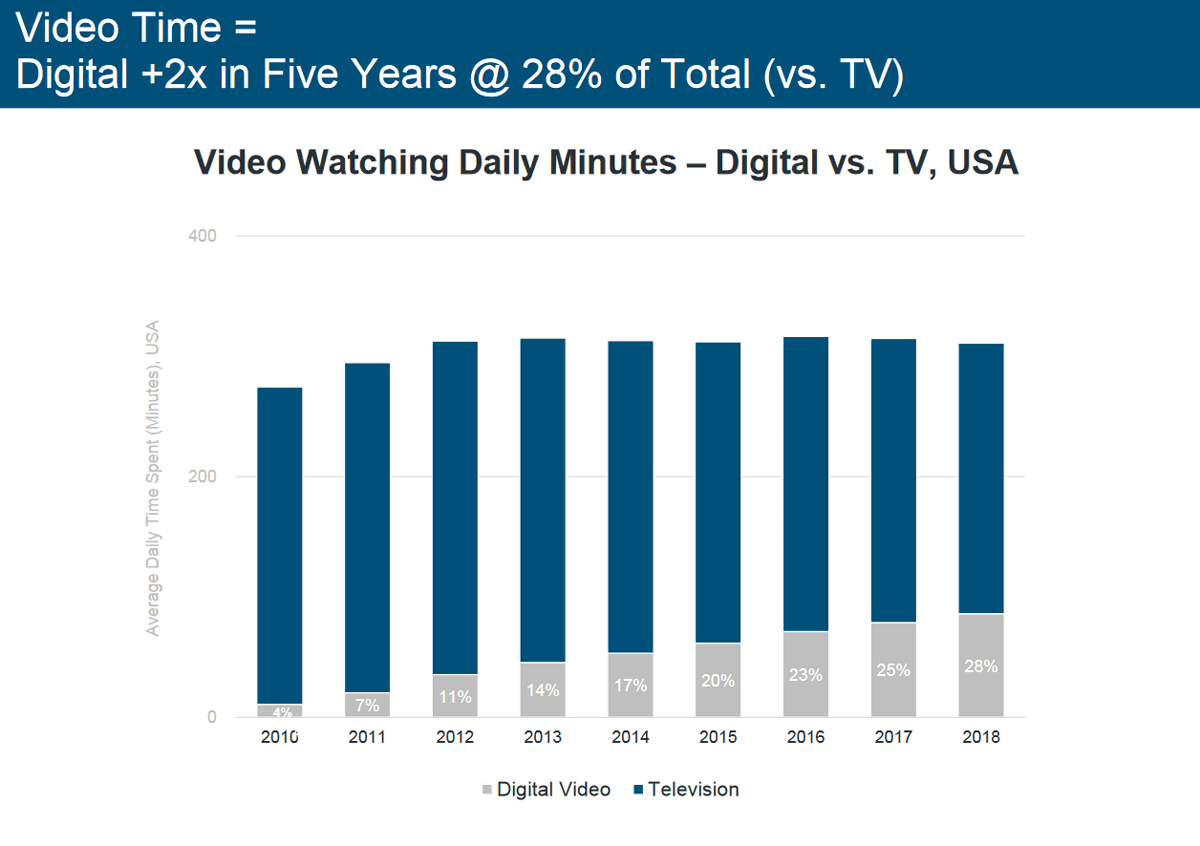
Below is the blue part of the graph for TV viewing time and the gray part for digital video viewing time. Digital viewing time is about five times that of five years ago.
◆ The role of 'image' in the growth of technology
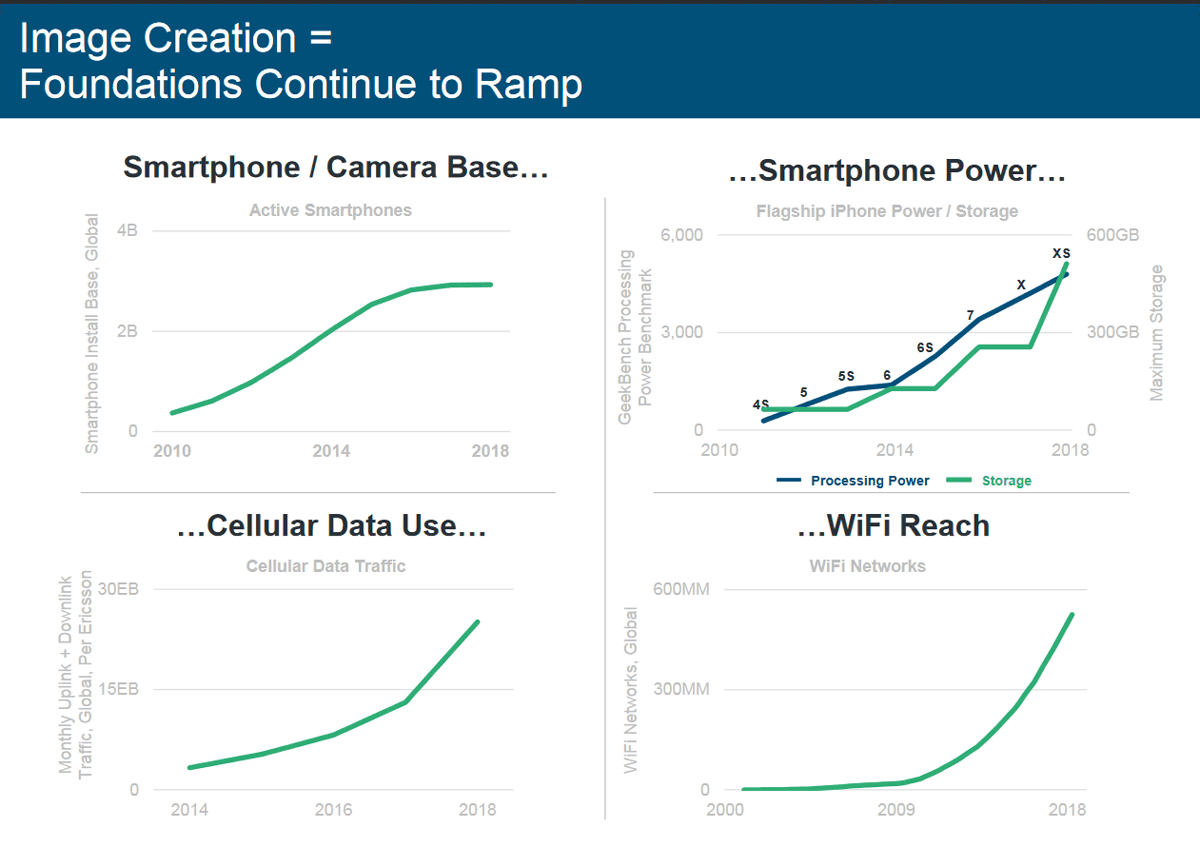
The development of technologies such as “high-speed Wi-Fi” and “better cameras” is being promoted for communication using images, and “image” is more important on the Internet. Twitter used to be text-based media, but now more than half of its impressions are now attached to media such as images and video.
The number of images taken and the number of images shared in Instagram are on the rise.

◆ Trends in the game industry
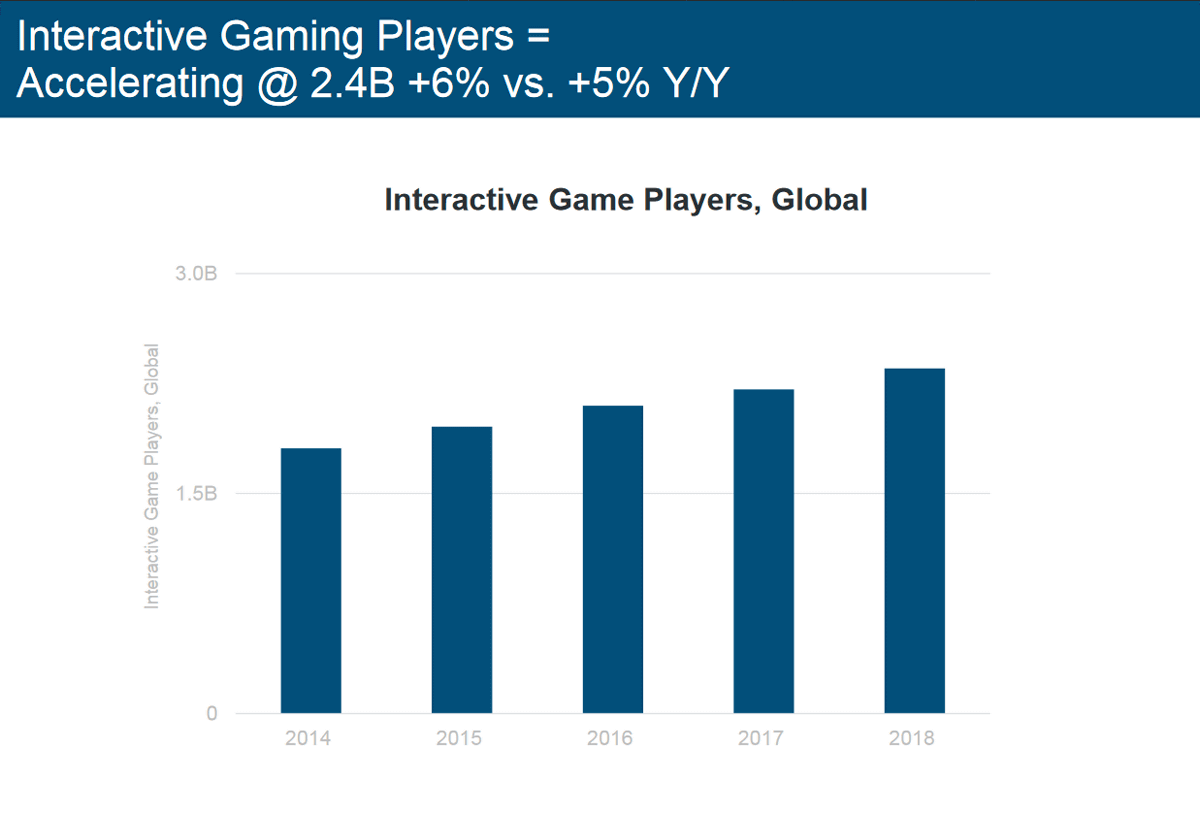
Globally, interactive game players reached 6 billion, up 6% from the previous year.
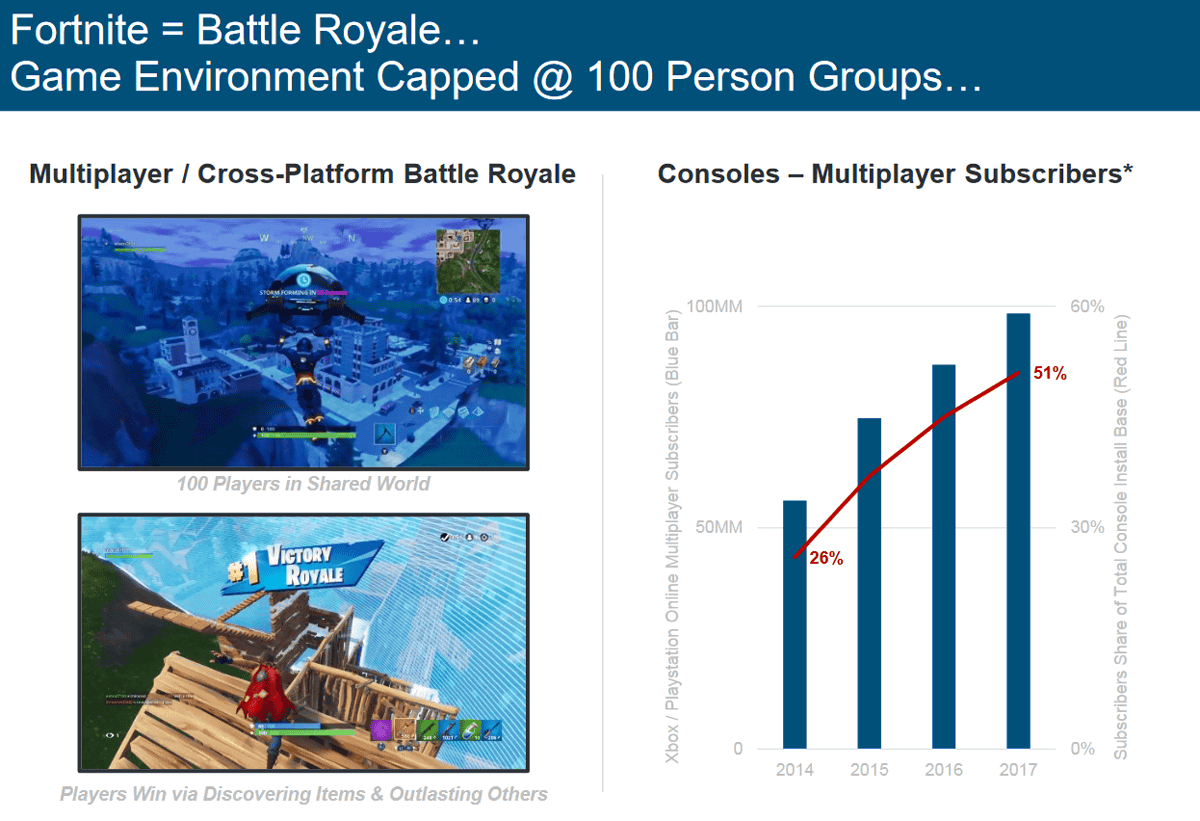
Also, the number of people who only watch and do not play games has increased significantly. The live streaming platform ·

◆ Concern over Internet use
The proportion of adults who are “almost always online” was 21% in 2015, compared with 26% in 2018.

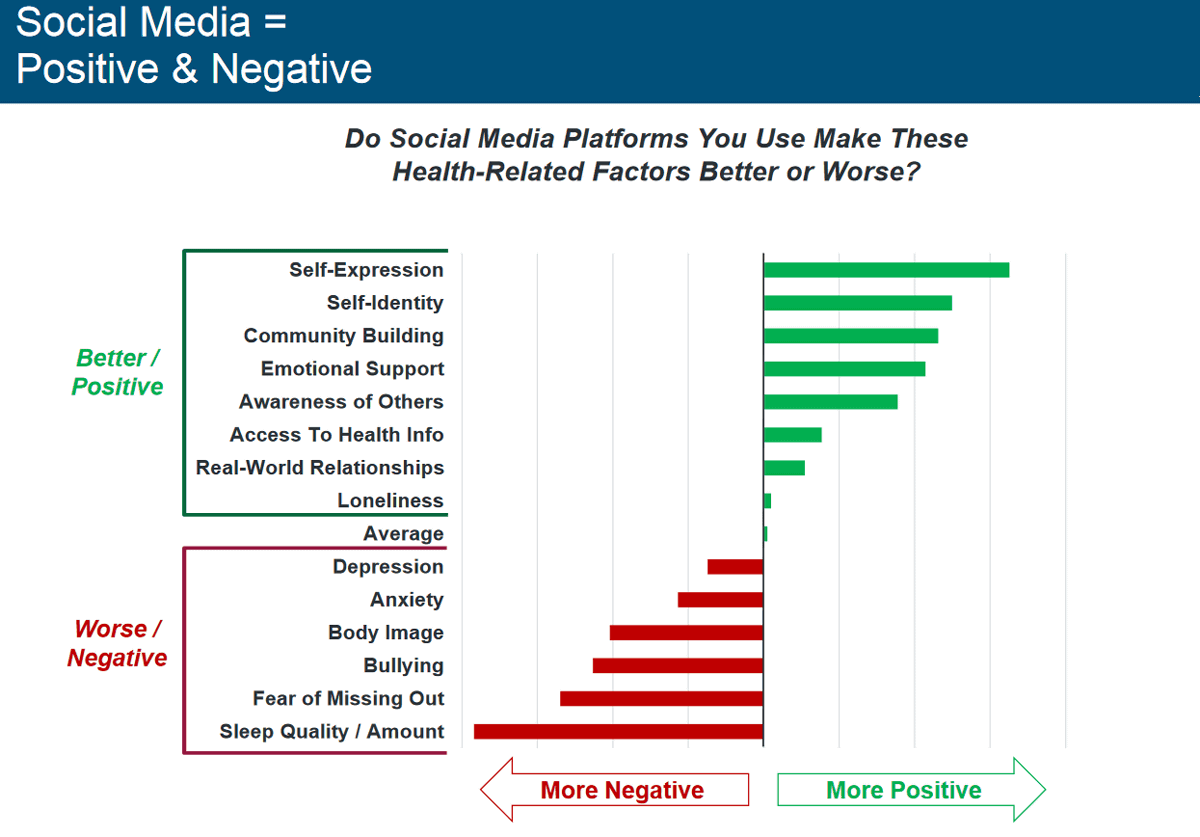
From the questionnaire asking whether social media is good or bad for health, while positive evaluation is performed in terms of 'self expression' and 'self recognition', negative points such as 'quality of sleep' and 'fear to miss' There is also a clear concern about
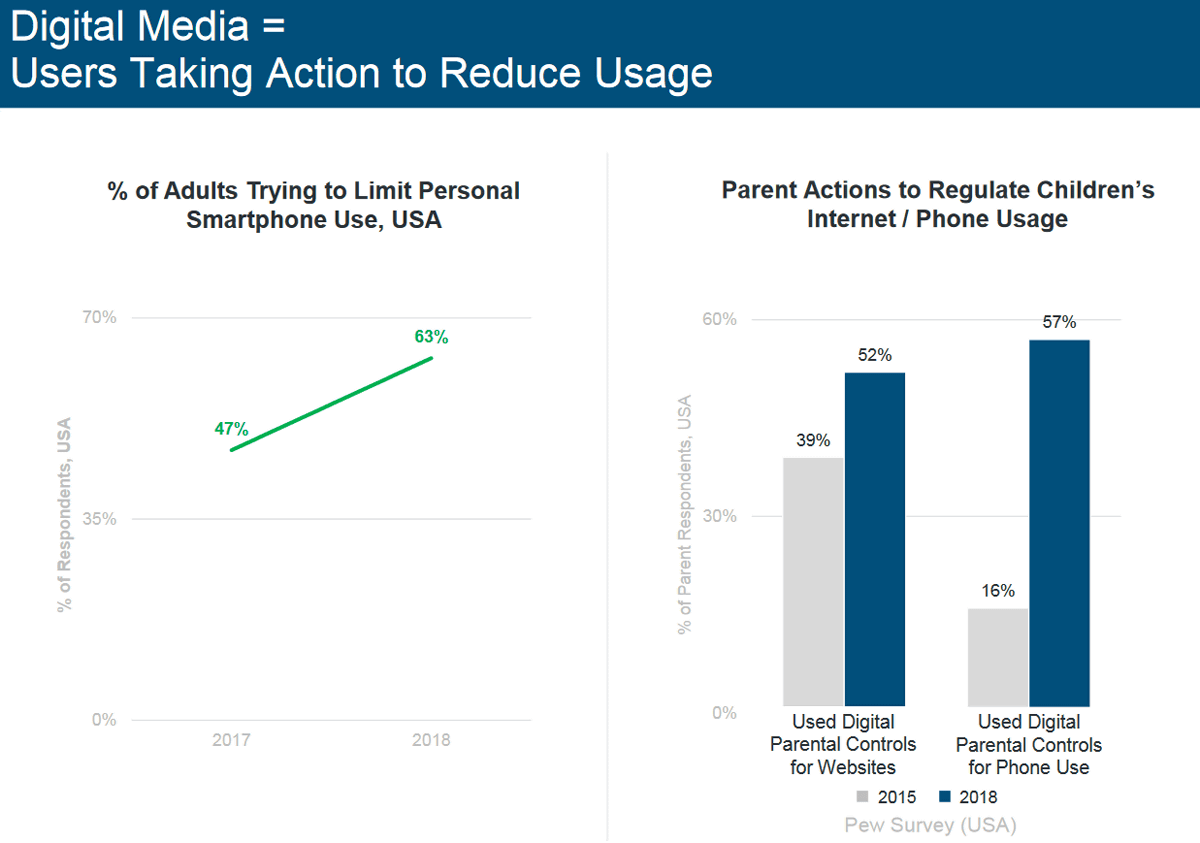
The percentage of adults in the United States who are trying to limit the use of smartphones is as high as 63% in 2019, compared with 47% in 2017. There is also a growing tendency for parents to limit their children's intern net use.
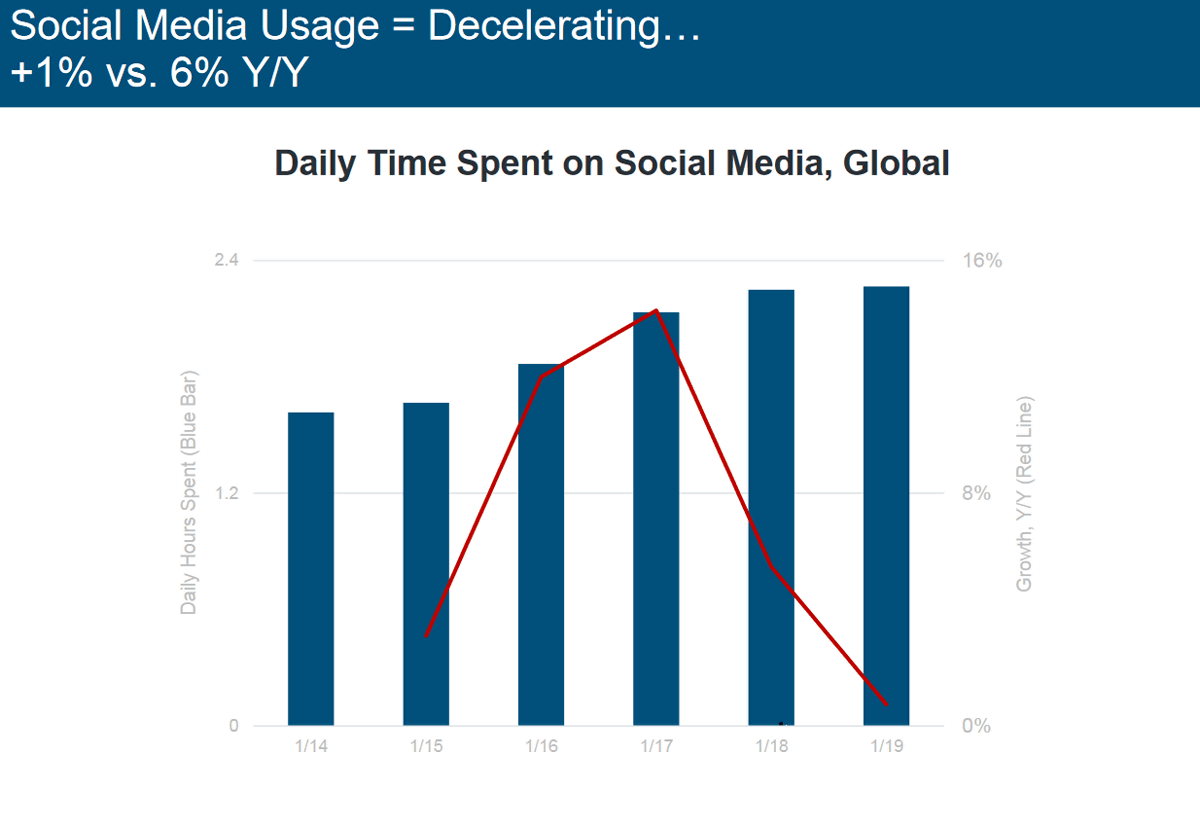
Perhaps because of this trend, social media use time per day is almost flat between 2018 and 2019. The growth rate has slowed sharply.
◆ Privacy is a selling point
At the same time, privacy concerns continue to be at a high level, but they do not seem to have dramatically increased their attention.
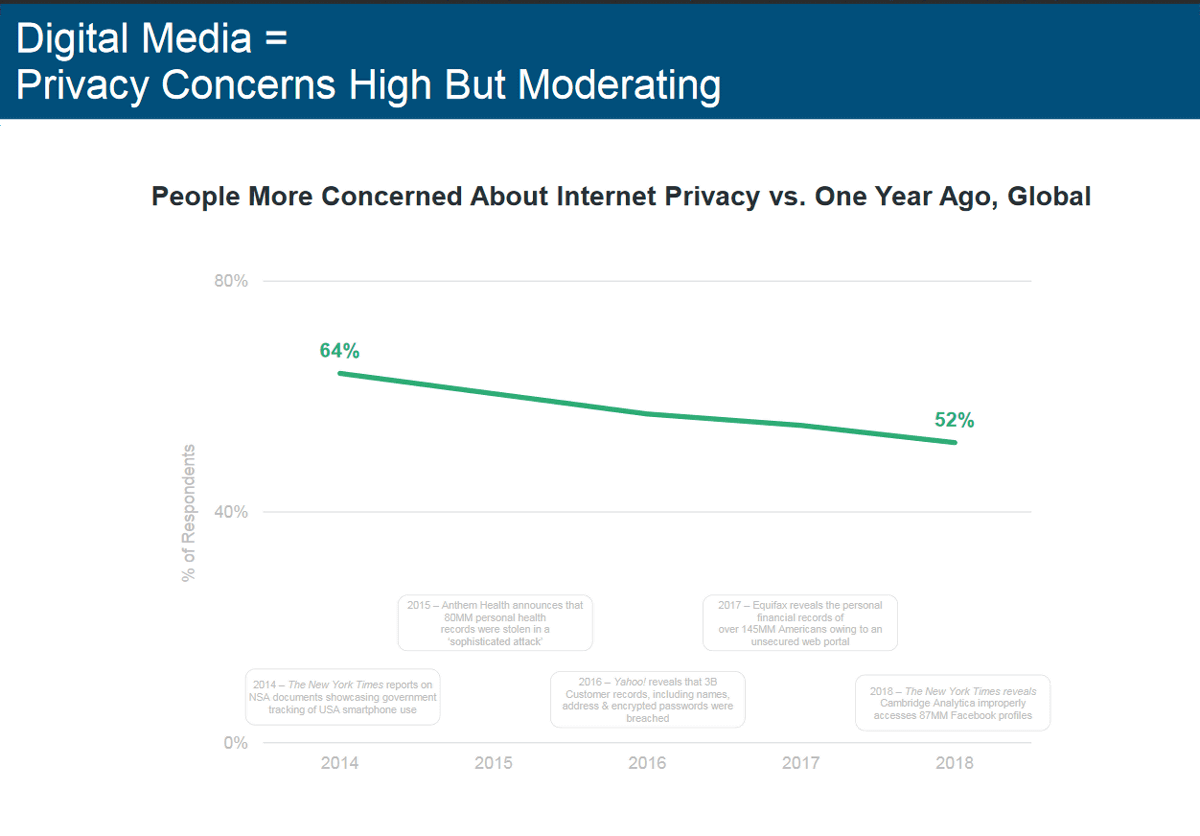
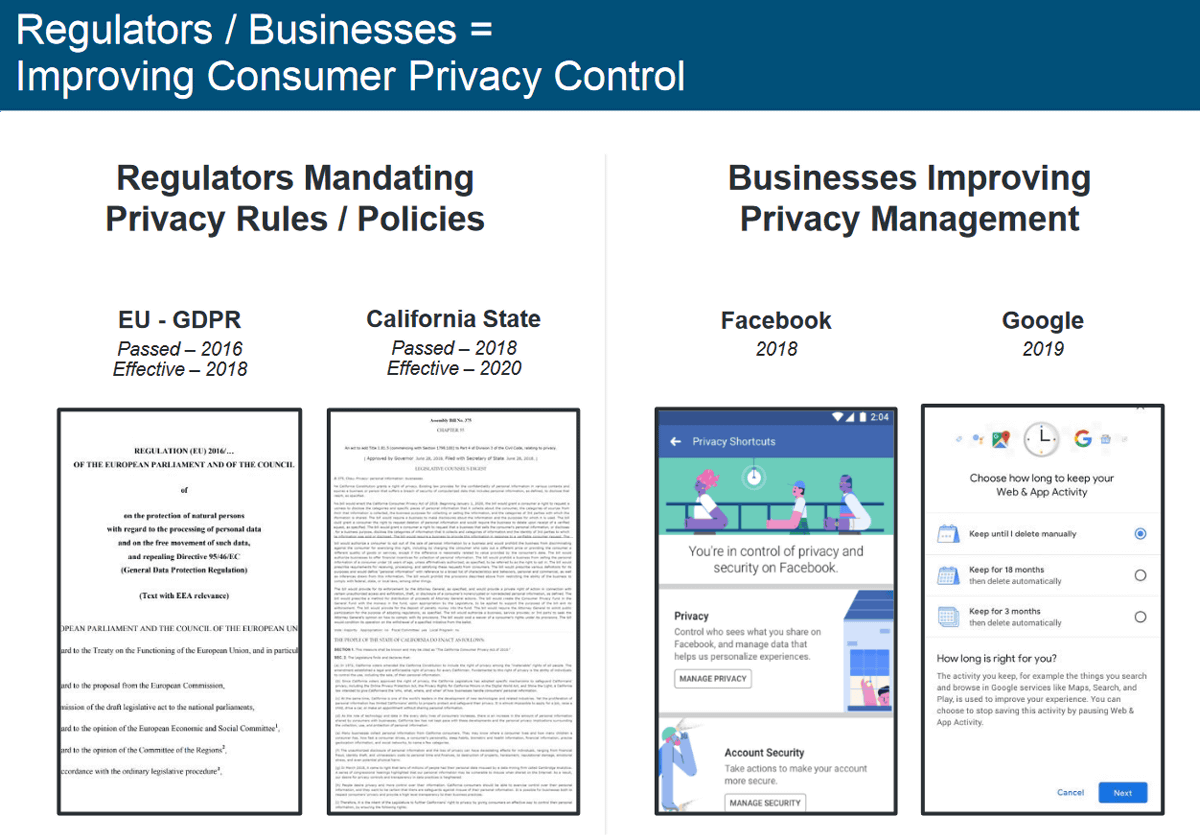
And the point of 'privacy' has become the subject of regulation or business.
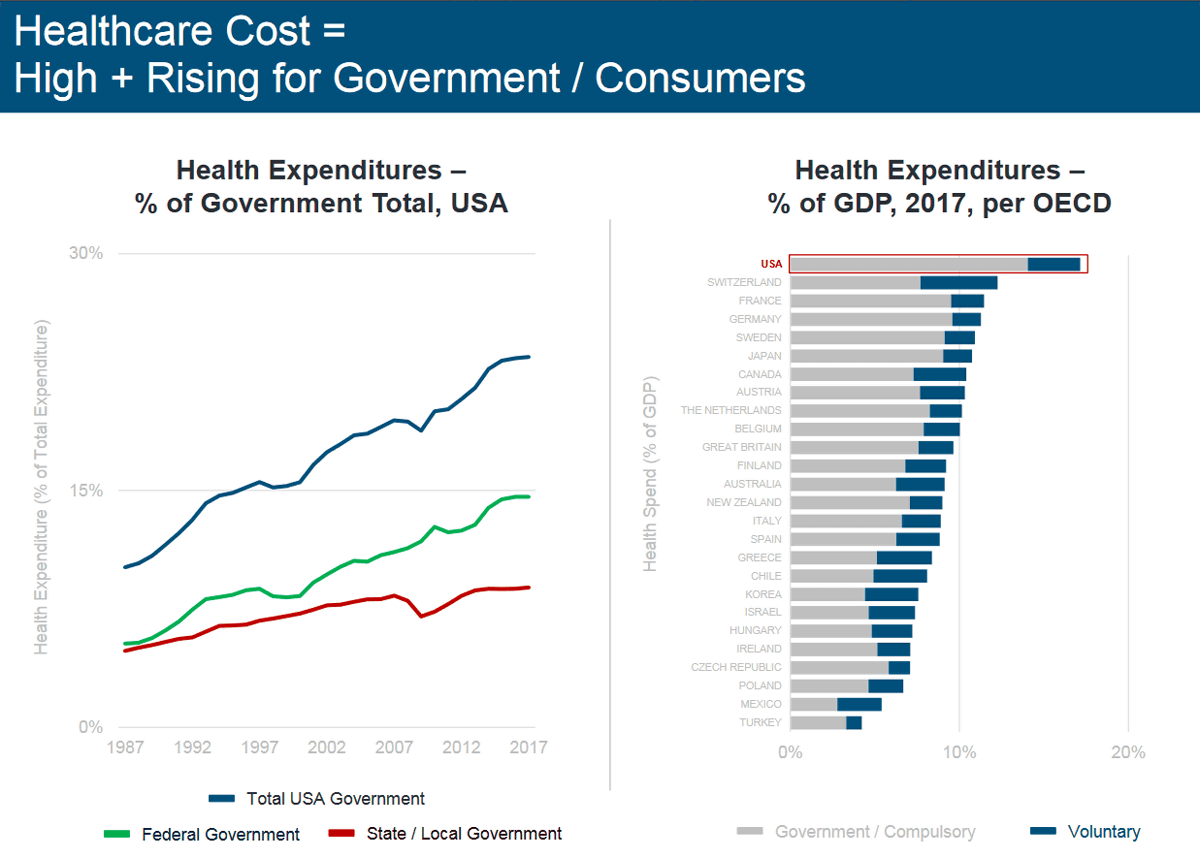
◆ Digitization of healthcare
In addition, in the United States, spending on healthcare has increased at both the government level and the general consumer level.
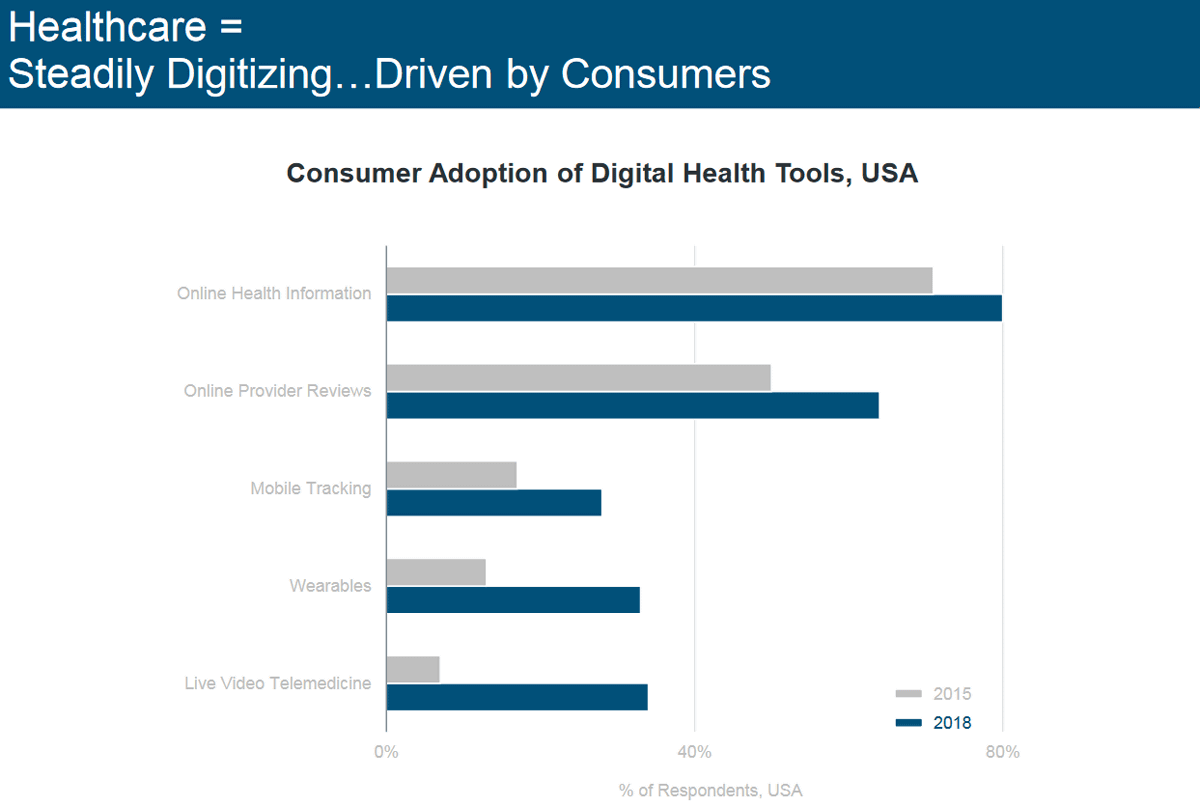
This trend has led to the digitization of healthcare. Consumers' acceptance of digital health care tools is particularly remarkable, and compared with 2015, all of “Online Health Information”, “Online Diagnosis”, “Mobile Tracking”, “Wearable” and “Telemedicine with Live Images” It is supposed to be accepted.
Consumers are also increasingly sharing health data with technology companies, the most shared being Google. There follow Amazon, Microsoft and Apple.

◆ Internet situation in China
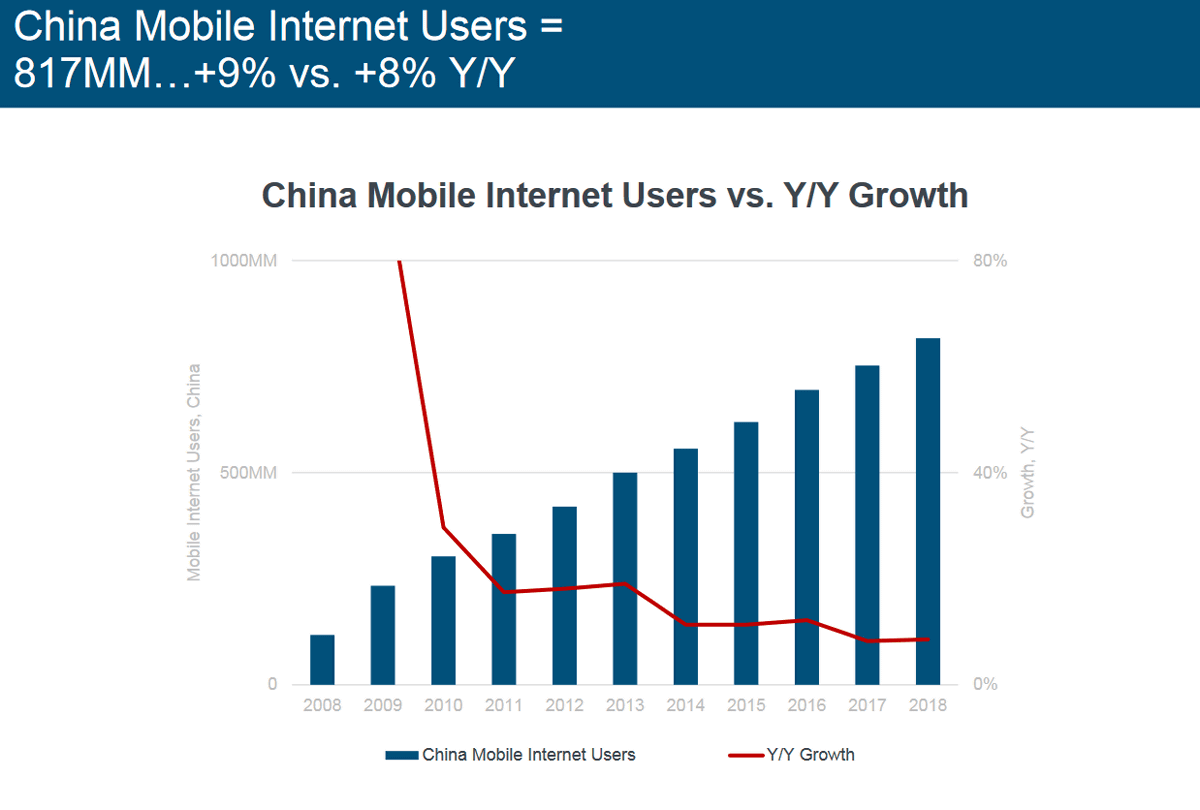
China is the largest single Internet market, but although the number of Internet users in China is on the rise, the growth rate is slowing down as well as the global trend.
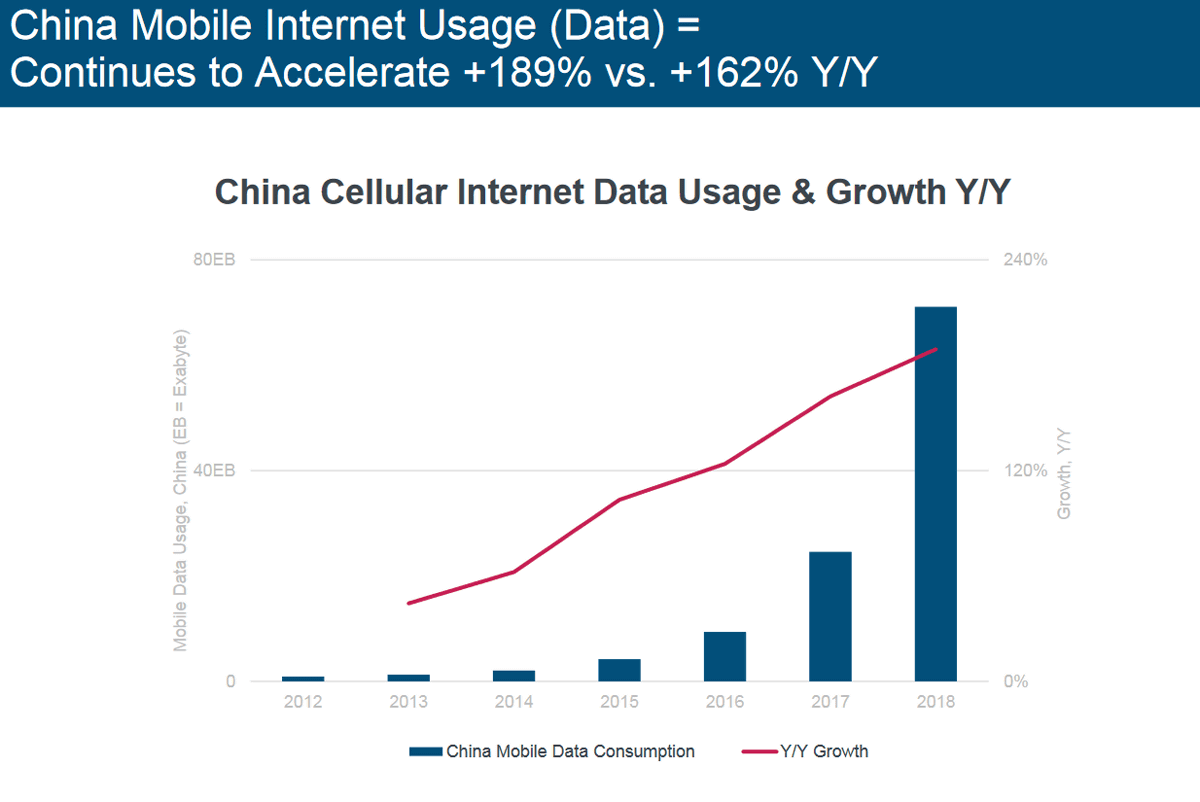
On the other hand, cellular Internet data usage is up 189% in 2018 compared to 2017.
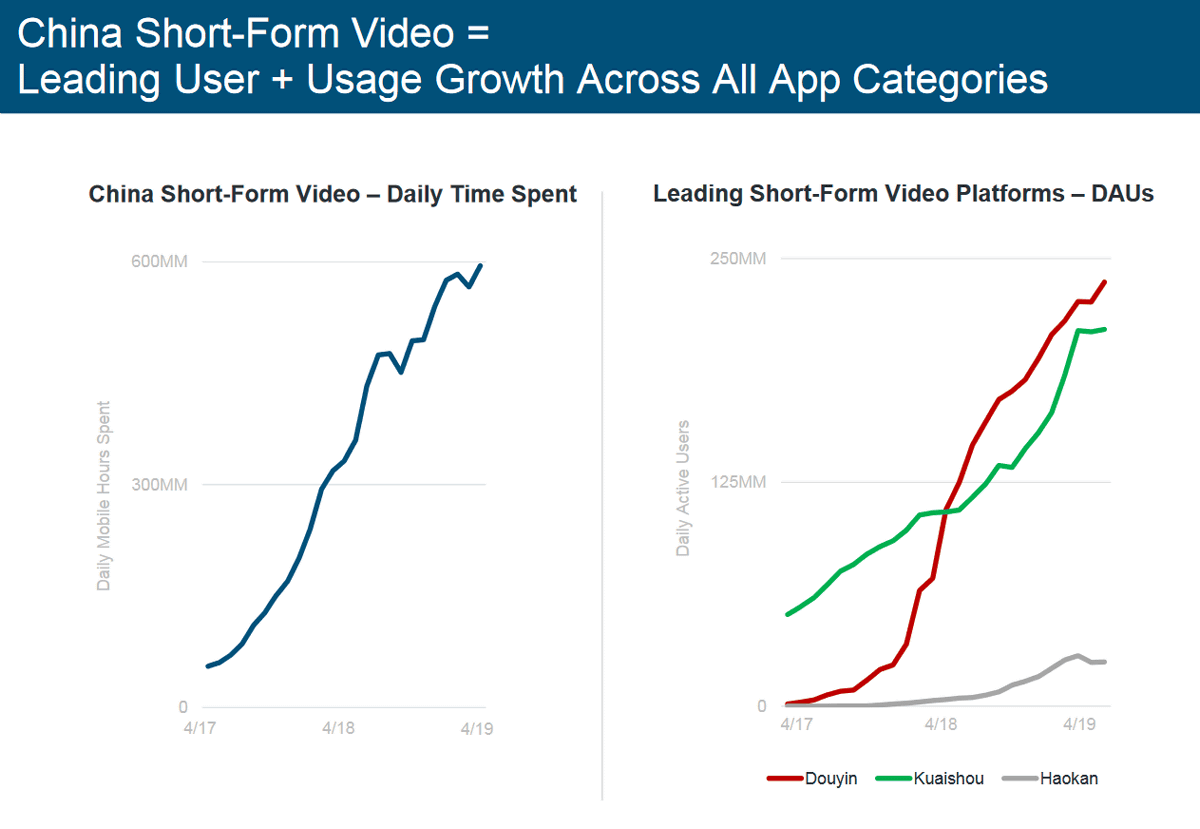
The growth of platforms that use particularly short movies has been shown to be remarkable.
Related Posts:


in Note, Posted by darkhorse_log