Clearly that more than half of the world's population was watching the 2018 FIFA World Cup, FIFA released detailed data on the number of viewers

The World Cup is the world's biggest soccer tournament held every four years, sponsored by the International Federation of Football Associations (FIFA). In the 2018 FIFA World Cup held in Russia in June 2018, the Japanese national football team decided to advance to the finals tournament , overturning the low profile, and lost in the first game of the finals, but won a wonderful match against the strong-fought Belgian opponent, There was a voice that the football fans inside suggested to the best bout of the competition. FIFA's announcement shows that more than half of the world population watching such a 2018 FIFA World Cup match through TV and the Internet.
2018 FIFA World Cup Russia ™ - News - More than half the world watched record - breaking 2018 World Cup
https://www.fifa.com/worldcup/news/more-than-half-the-world-watched-record-breaking-2018-world-cup
2018 FIFA World Cup Russia: Global Broadcast and Audience Executive Summary
(PDF) https://resources.fifa.com/image/upload/2018-fifa-world-cup-russia-global-broadcast-and-audience-executive-summary.pdf
The 2018 FIFA World Cup held for about a month from 14th June to 15th July 2018 was broadcast live all over the world. FIFA has released a report that summarizes and compiles viewer data for that 2018 FIFA World Cup.
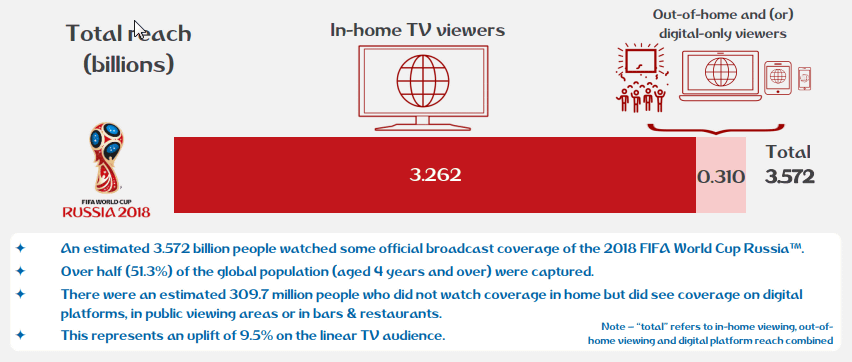
According to the survey, the total number of viewers of the 2018 FIFA World Cup was 3,572 million. This is 51.3% of the world population over 4 years old, "FIFA wrote that" World Cup once again showed that it is the world's most noteworthy international football competition. " Of the 3,572 million people who watched the World Cup, 3,262 million people are watching the game on their home TV and the remaining 390 million people are watching the game on the Internet, public viewing, It seems that we watched the game at football pub etc. The number of people who watched the World Cup on TV seems to have increased by 9.5%.
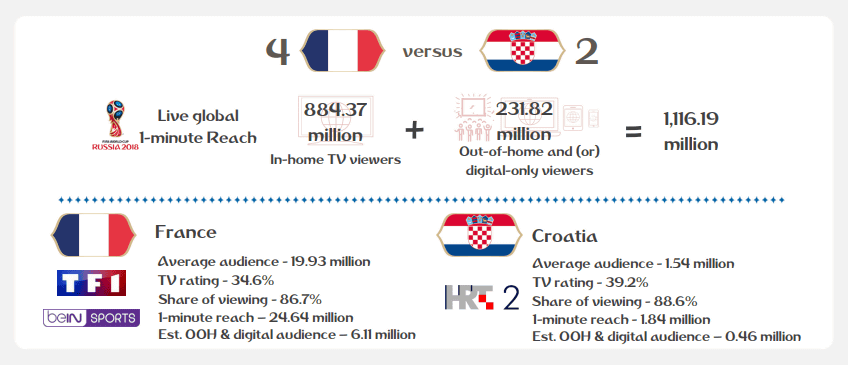
The number of people who watched the French vs. Croatia final game on 15th July was 11,161.91 million people. Among them, the number of people who watched the game on their home TV was 883.37 million, and the number of people who watched on the Internet, public viewing, etc. was 231.82 million.
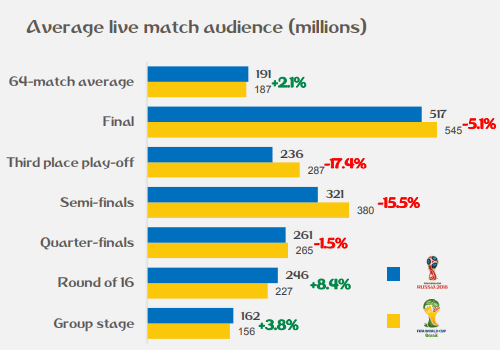
2018 FIFA World Cup games total 64 games, the average audience number of live broadcasting is 191 million. This is "content that each game is comparable to a global TV program," FIFA wrote.
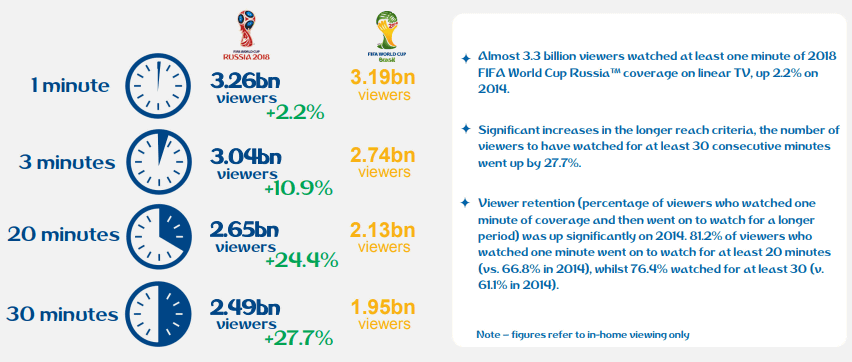
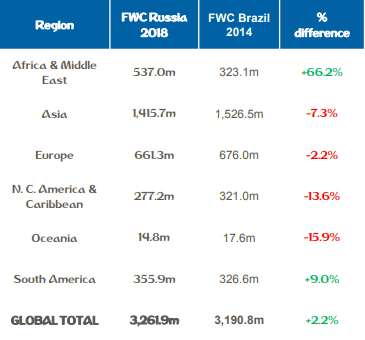
The following data compares the number of audiences of 2018 FIFA World Cup (left) and 2014 FIFA World Cup (right). The number of people who watched the game for more than one minute was 3.26 billion in the 2018 FIFA World Cup, up 2.2% in the previous event. The number of people who watched the game for 3 minutes or more was 3.4 billion, 10.9% higher than the previous tournament, the number of people who watched the game for 20 minutes or more was 2.65 billion, 24.4% increase compared to the previous meeting, The number of people who watched the game for more than 30 minutes was 2.49 billion, an increase of 27.7% compared with the previous tournament. Not only is the number of people watching the game more than the 2014 FIFA World Cup of the last event being increased but also the viewing time is increasing.
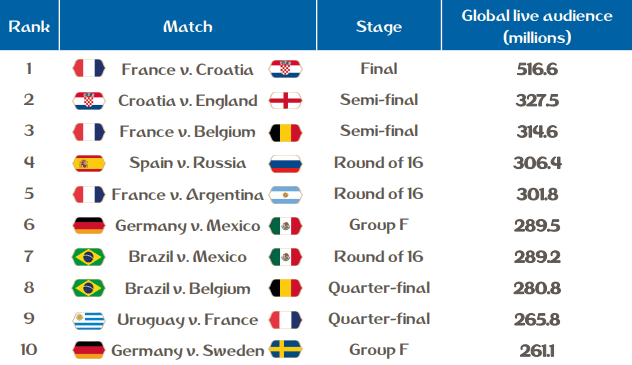
The top ten games in which the number of viewers of live distribution was large are as follows. French vs. Croatia in the final are the most frequent, and there are many viewers of the fight at the convention mountain field such as the final and semi-finals, but some group league matches are also mixed. The German national team who lost in the group league ranked in the top 10 in two matches, and I can hear from such a place that a lot of attention was gathered as a winning candidate.
World Cup viewers can be summarized by region as follows. There were 1.4157 million people in Asia with the most audience, but the number of viewers has decreased by 7.3% compared with the previous tournament. In contrast, Africa & Middle East regions where the number of audiences increased the most in the previous tournament, the total number of viewers was 537 million, 66.2% higher than in the previous tournament. It is clear that the growth in the number of viewers in Africa and the Middle East has greatly boosted the increase in the total number of audiences in the convention.
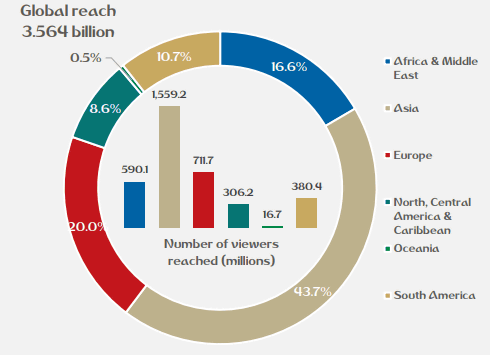
The following pie charts summarize the percentage of the total number of viewers in each region, the following pie charts: Asia 43.7%, Europe 20%, North America, Caribbean 8.6% North America, 10.7%, Oceania 0.5%, Africa & Middle East 16.6%.
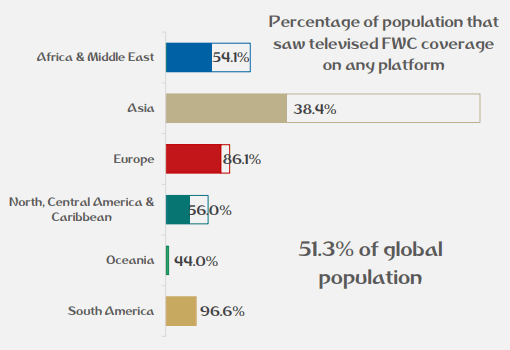
The following data showed what percentage of the total population by region was showing the world cup. Above from Africa & Middle East 54.1%, Asia 38.4%, Europe 86.1%, North America Central America & Caribbean 56%, Oceania 44%, South America 96.6%. Asia and Oceania are the only regions where only half of the world's clubs have watched the world cup. Especially in Asia only 38.4% of the total population are watching the World Cup, and I still feel the growth margin. On the other hand, 96.6% of the population of soccer played in South America and 86.1% in Europe, they are striking astounding figures, so you can see why the top European clubs and top leagues are aggressive in marketing strategies in Asia .
The number of viewers of the live broadcast of the match by round is summarized as follows. Although the number of viewers has increased as the round progresses from the group league, unexpectedly, the number of viewers has declined in the final game, the third place finals, the semi-finals, and the quarter-finals when compared to the last competition. 2018 In the FIFA World Cup, since only Mexico and Japan advanced from the regions other than South America and Europe to the finals tournament, these two also did not advance to the quarter-finals, so this also means that the number of viewers since the quarter- Perhaps it is the reason that it is decreasing compared with the cause.
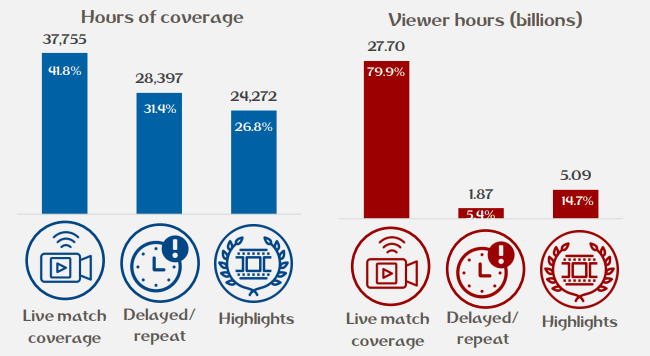
The following data is the blue graph on the left showing the total broadcasting time (Hours of coverage) by Live match coverage, replay of game (Delayed / repeat), game highlight (Highlights). In the red graph on the right, it shows the percentage of how much viewers consumed (viewer hours) of various broadcasted contents. It can be seen that a lot of rebroadcasts and highlights were broadcasted in addition to the live broadcasting, but most viewers are watching live broadcasting, and rebroadcasts and highlights are not consumed so much.
About the reason why about 8.6% of the total number of viewers was watching the game from the distribution on the Internet, FIFA wrote that "because it was viewed as a second screen and Internet distribution was established as a way of watching while on the move" .
FIFA says, "These numbers support the assertion that the 2018 FIFA World Cup was the best World Cup ever, and I am particularly pleased with the increase in average time that viewers are watching the games. The fact that about half of the people watched the FIFA World Cup reflects not only the quality of our live delivery but also the fact that fans around the world never get tired of world football. " I write it.
The survey data was obtained by analyzing the viewer data collected from the official television audit agencies around the world and Publicis Media Sport & Entertainment of the research company from FIFA Media Rights Licensees.
Related Posts:


in Note, Posted by logu_ii