What is understood by analyzing the result of self-monitoring tracking time and happiness for over two years?
by Stine Moe Engelsrud
A man of engineers who thinks "to pursue happiness is their mission" tracks his / her sleep for 2 years using the sleep measurement application and analyzes it together with "happiness of the day" recorded every day By doing so, I investigated that "Can a person become more happy as he sleeps a lot?"
The Effect Of Sleep On Happiness [Complete Analysis] - Happiness Through Sleep: Part 1
https://www.trackinghappiness.com/effect-sleep-happiness/
A manager of Tracking Happiness saying that he is a 25-year-old man living in the Netherlands who is pursuing his own happiness. A man examines the point "Do you have a correlation between sleep and happiness? Will happiness degree increase as the longer sleeping time?" And "What is sleeping time to maintain happiness?" So I used my sleep measurement application to track my sleeping time.
For tracking, men used the application " Sleep as Android ". Sleep as Android is designed to measure the depth of sleeping in addition to recording from sleep onset to waking up, as it detects user's sleeping movements.
Men with "mission tracking their own happiness" as mission always evaluate their degree of happiness in 10 levels. Men but I spent in Kuwait on account of on the job five weeks of 2015, projects in Kuwait is a harsh, followed by the date on which happiness is low, that it is the lowest ever recorded "3" make an evaluation It was also said that . Working 80 hours a week, even after spending 12 hours a day on projects, men want to do whatever they like, men seeing movies and exercising until late night, talking with lovers in Skype It is said that. As a result, of course, sleeping time became shorter, sleeping lasted 5 hours a day. Based on this experience, it is said that men started tracking their own sleep.
Sleep tracking looks like the following. Before going to sleep, the men evaluated happiness in 10 levels, then launched the application, sleeping, stopping the application after getting up and evaluating the mood at that time. Application screen after getting up that the sleeping time on the left side is the sleeping time of each day and the right side recorded the mood evaluation etc.
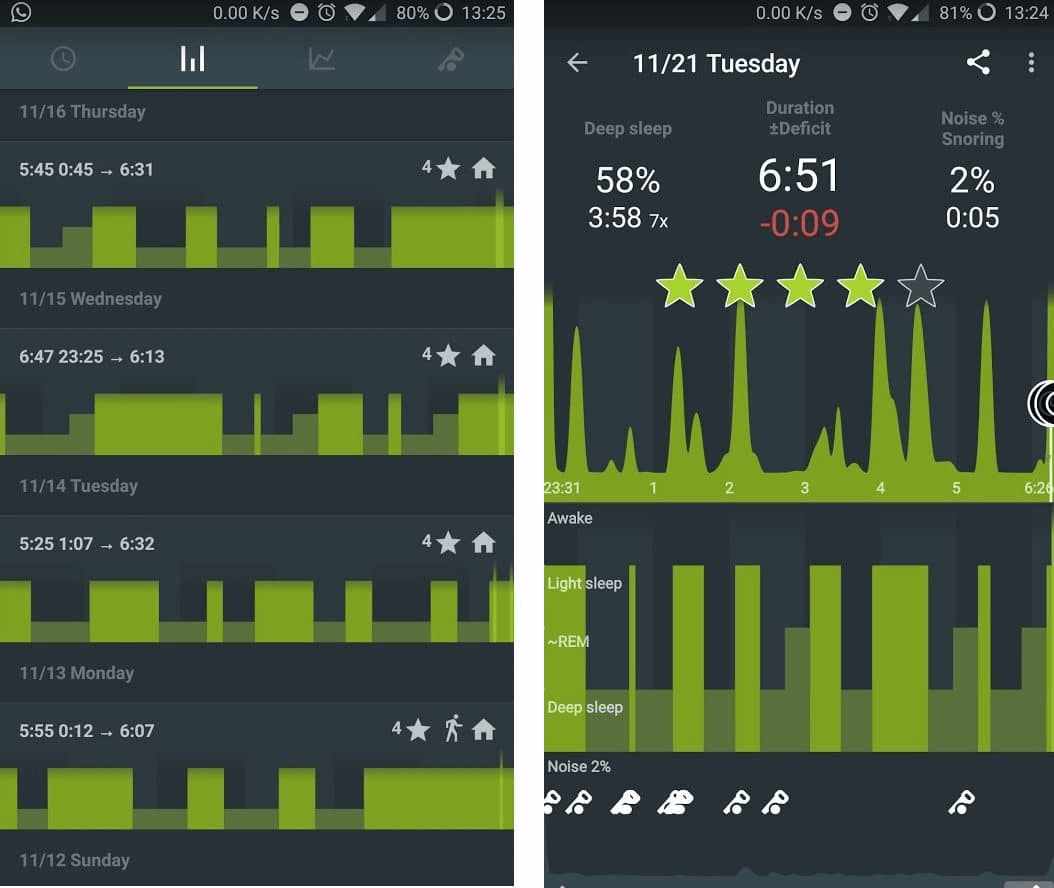
Various data are recorded in the application, but this time the only time men used was "from sleep to wake up". Also, for example, when 6 hours of sleep was measured from January 1 (Friday) to January 2 (Saturday), all the sleeping hours were counted as "Sleeping Sleep".
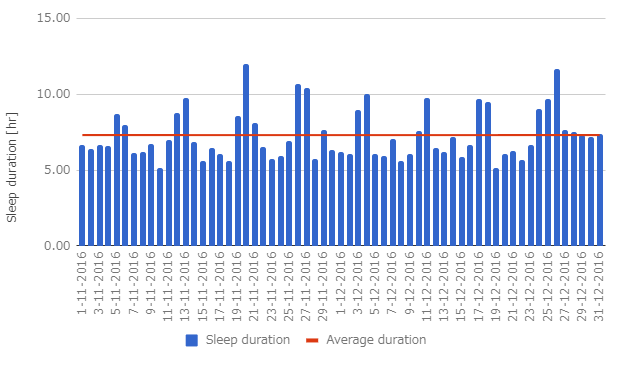
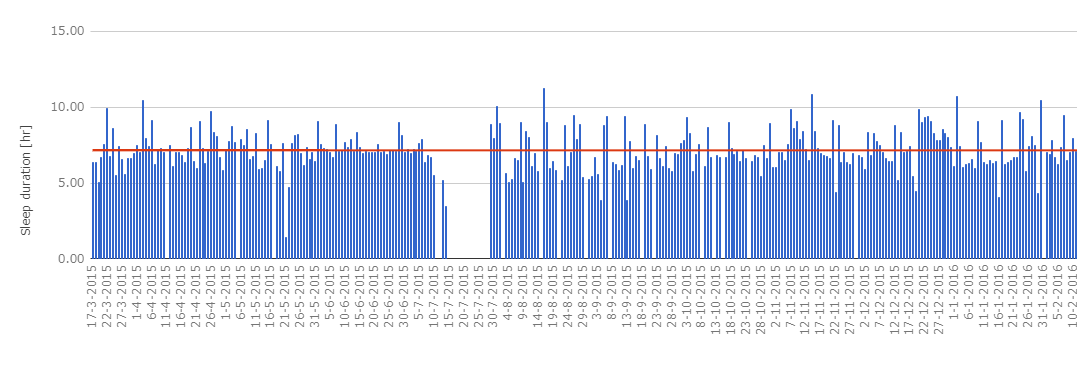
This is a man 's usual sleeping time cut out from November 2016 to December 2016. The blue graph is the actual sleeping time, the red line is the average sleeping time. The average sleeping time in this period is 7 hours 31 minutes, but you can see that the cycle of the actual sleeping time falls below the red line on weekdays and it exceeds the weekend on weekdays.
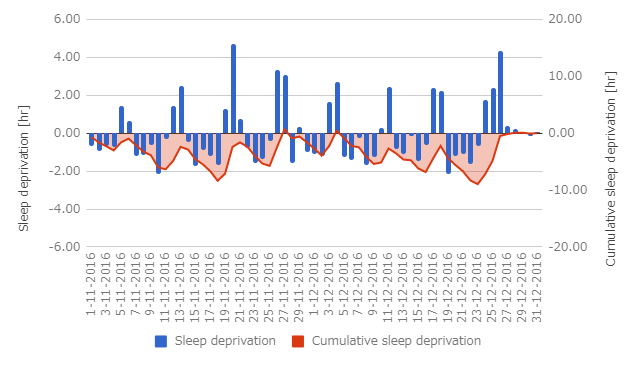
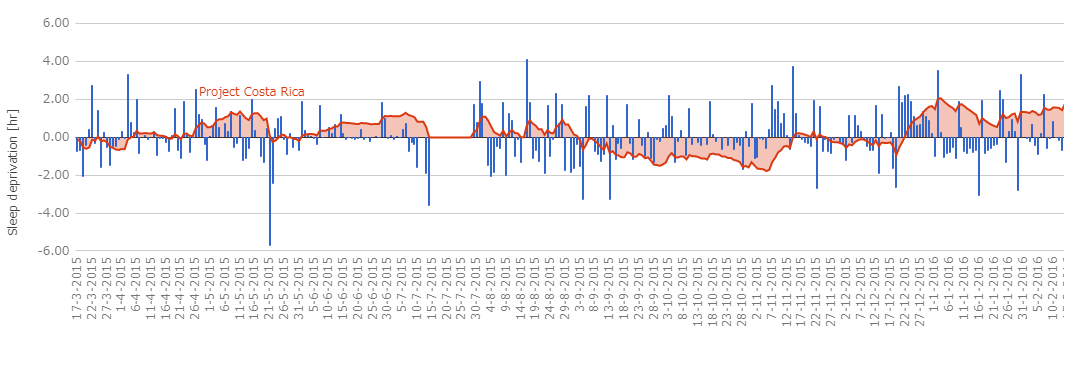
As men have been living a happy life so far, we assume that the average sleeping time of 7 hours 31 minutes is "minimum sleeping time required for them". And how much sleep do you need? When you visualize that it is like this. The horizontal axis that is "0" is the necessary sleeping time, and it shows how much the blue graph is above or below the average sleeping time. We are repeating the cycle that "cumulative sleep deprivation" on weekdays indicated in red is resolved at the weekend.
Data has been recorded from March 2015 to November 2017, of which the data until February 2016 looks like this. The part where the data is missing is when I forgot the setting of the application, and this part is said to have been pulled out of the analysis.
This data is illustrated by focusing on "sleep deprivation". While the red graph protrudes from the middle line part, sleep is well taken off ... ...
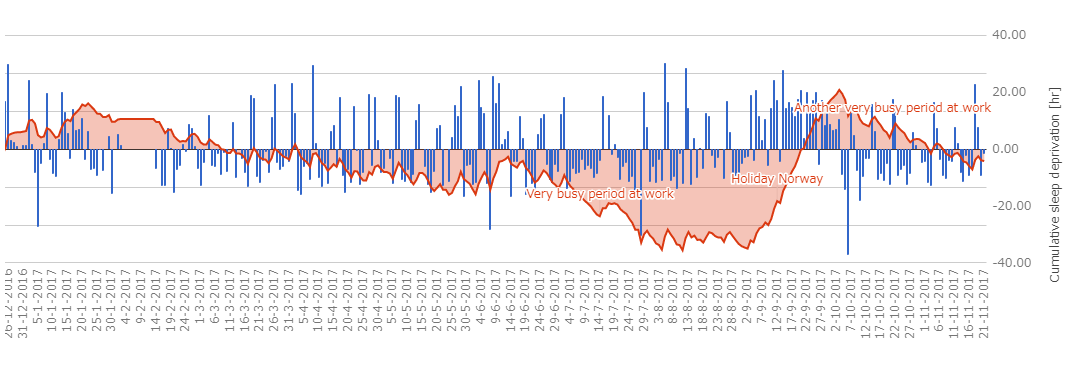
From May to September in 2017, cumulative sleep deprivation is amazing. After that, you can see that you are recovering by taking a vacation in Norway.
Also, when you graph the average sleeping time per day like this.

However, men who cross the border often move to areas with different time zones, and the data is not complete. Also, although you may be awake for a while after launching the application, most likely it will go to sleep within 30 minutes after launching the application. Meanwhile, a man who started sleep tracking says that he noticed that "the time when dinner was all you can eat can not sleep long".
And, the above graph showing sleep deprivation plus information on happiness degree is kore. The black graph at the top is happiness, the blue graph is the sleep deprivation amount of each day, and the red graph is cumulative sleep deprivation amount.
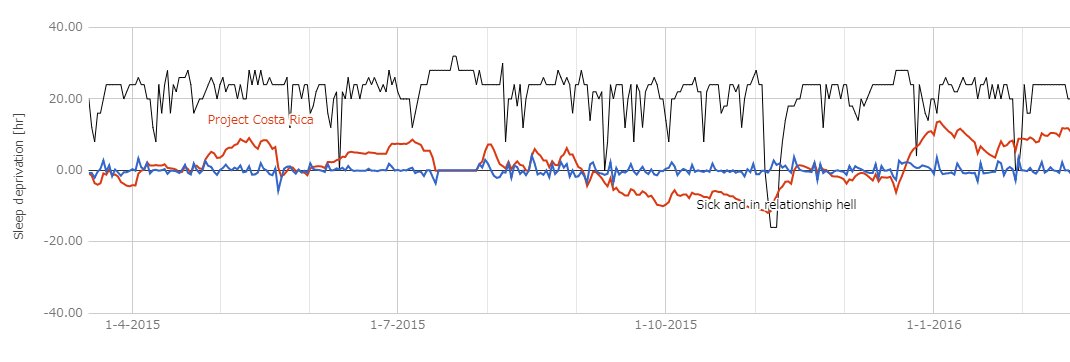
A man who saw the graph commented, "The day when you sleep like a baby does not seem to have a high degree of happiness". The man says that low happiness does not seem to be caused by lack of sleep nor happiness seems to be caused by adequate sleep.
Men regularly record happiness as well as factors that caused happiness. As a result of analyzing the records, one factor that frequently reduces the degree of happiness of men is known to be "fatigue", and the degree of happiness (black) and fatigue in Kuwait's lives are recorded per week (Purple), and cumulative sleep deprivation (red). Even though it seems that elements of tiredness are more matched to happiness than sleeping, men say "I can not say clearly from the graph."

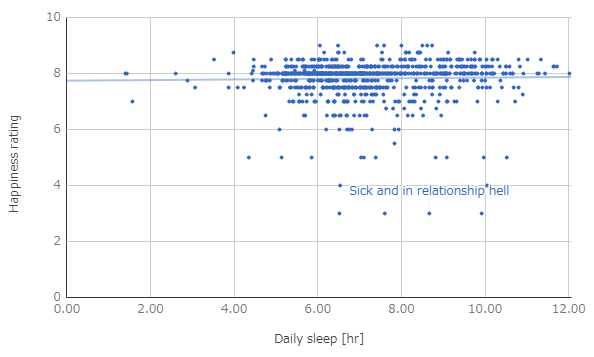
In addition, a diagram plotting the degree of happiness with respect to the sleeping time of the day is Kore. The vertical axis shows happiness, and the horizontal axis shows sleeping time per day. According to the man, the correlation is 0.02, which means that it is nearly zero. Even on the day that happiness degree was evaluated as "3", as you can see from the fact that there are days when sleeping time exceeds 8 hours, the happiness degree of that day does not seem to correlate with the sleeping time of the day.
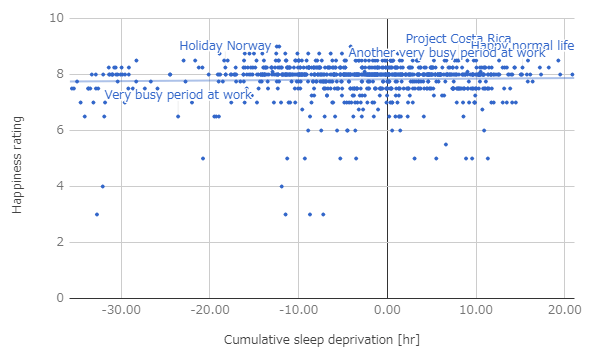
Next, plotted the degree of happiness against cumulative sleep deprivation. It is a graph created considering that the effect of sleep deprivation appears late, but still the correlation is still about 0.06 and still considered to be less. However, from the viewpoint of cumulative sleep deprivation, on the day when the evaluation of happiness degree is "3", you can see that you are in a state of sleep deprivation. And it is also shown that happiness degree does not fall below 5 on days when sleep is not short.
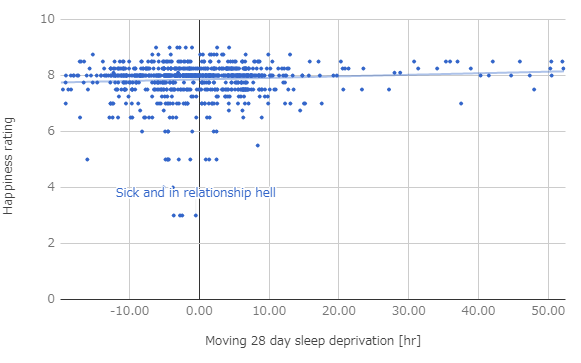
When plotting cumulative sleep deprivation limited to "28 days" period, this way. This means that sleep deprivation outside the period does not affect the graph. In the past studies, " Sleep shortage does not expire " may have been indicated, but men said that "I do not think that lack of sleep two years ago has affected today's sleep deprivation" It seems that the period has been limited. In this case, the correlation between happiness degree and cumulative sleep deprivation is 0.09.
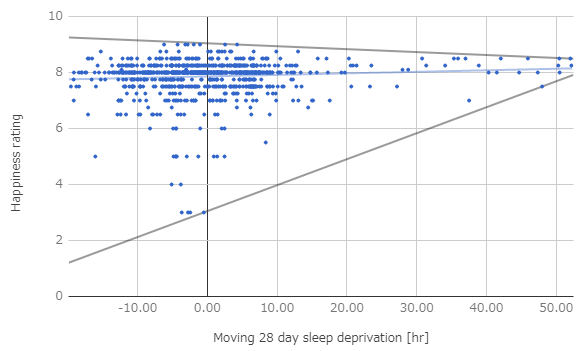
And, the above graph plus the line expressing the upper limit and the lower limit is kore. As you can see from this graph, the man said, "It was only when I was short of sleep that I really felt unhappy" or "Happiness rating does not fall below 6 when I have over 10 hours of extra cumulative sleep" It states that. From this, it is shown that the answer "Do more sleep brings much happiness?" And "Do it well", while the correlation is small, "sleep deprivation affects the lower limit of happiness Men are giving the conclusion that.
Related Posts:


in Note, Posted by darkhorse_log