Netflix publishes "FlameScope" open source performance visualization tool
Netflix's cloud performance engineering team is using open source performance visualization tool "FlameScope"Was produced and released.
Netflix FlameScope - Netflix Technology Blog - Medium
https://medium.com/@NetflixTechBlog/netflix-flamescope-a57ca19d47bb
Publishing is done at GitHub, and anyone can participate in development.
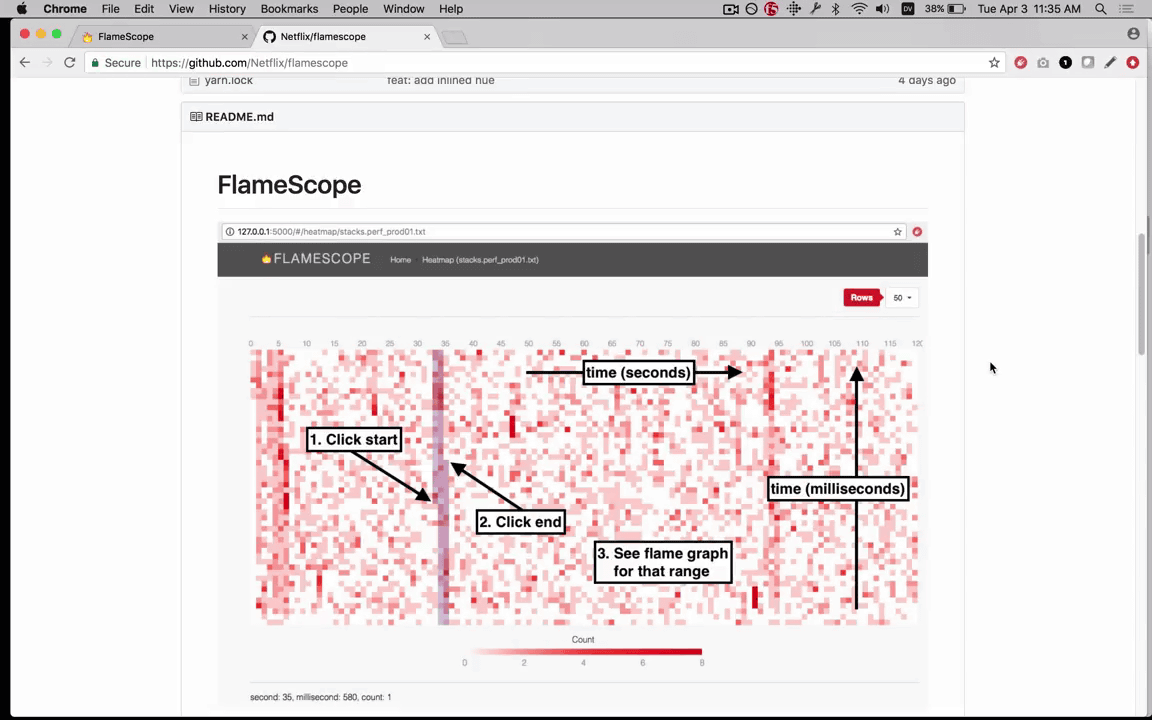
GitHub - Netflix / flamescope: FlameScope is a visualization tool for exploring different time ranges as Flame Graphs.
https://github.com/Netflix/flamescope
A movie that explains what kind of thing is also released.
FlameScope Examples - YouTube
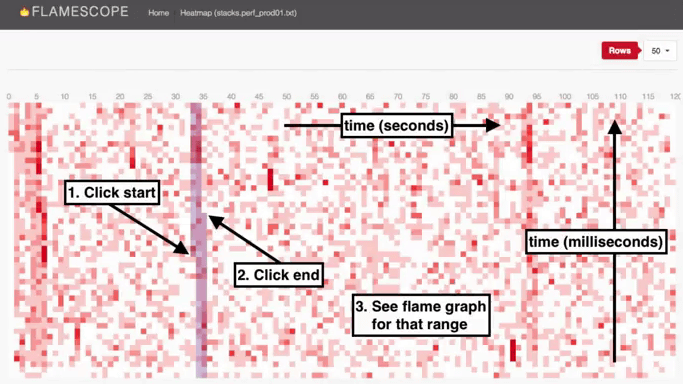
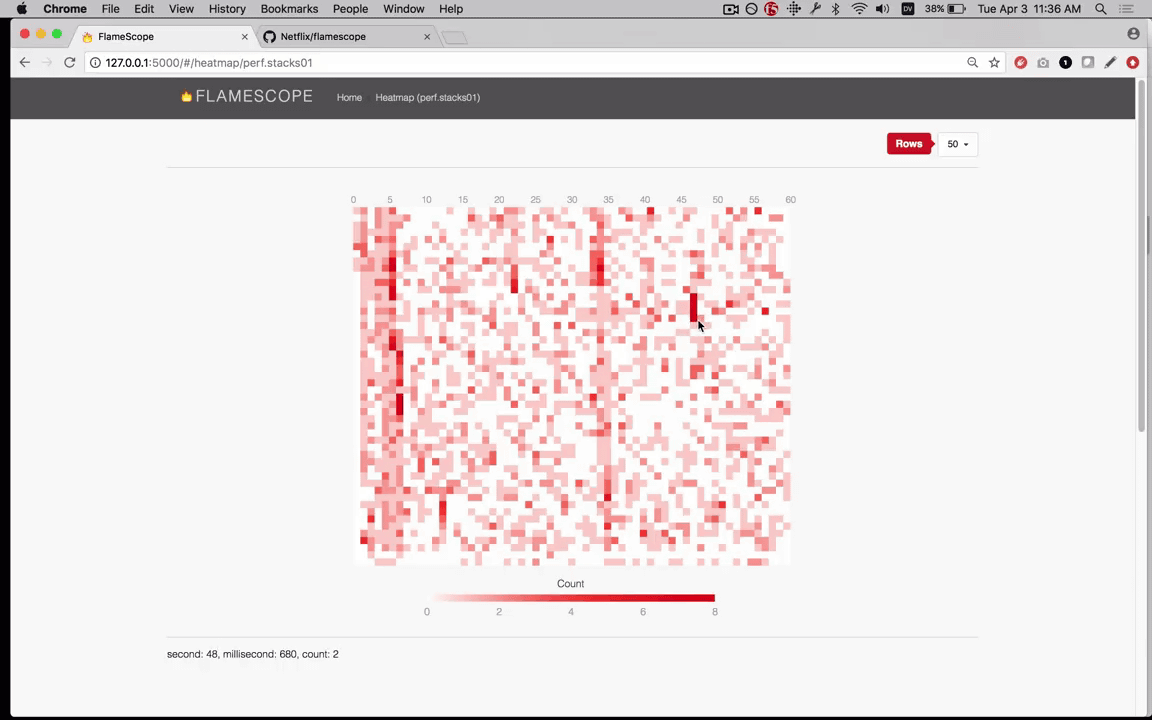
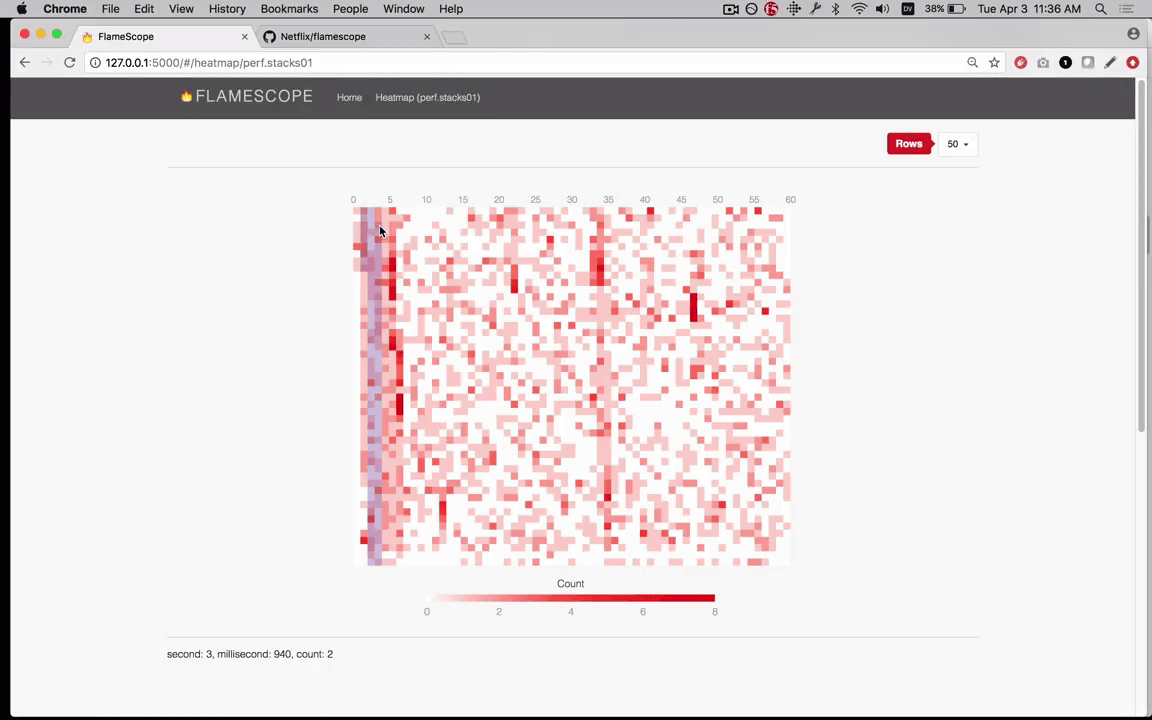
FlameScope'sHeat mapThe horizontal axis is seconds and the vertical axis is milliseconds, the more the occurring events, the deeper the color.
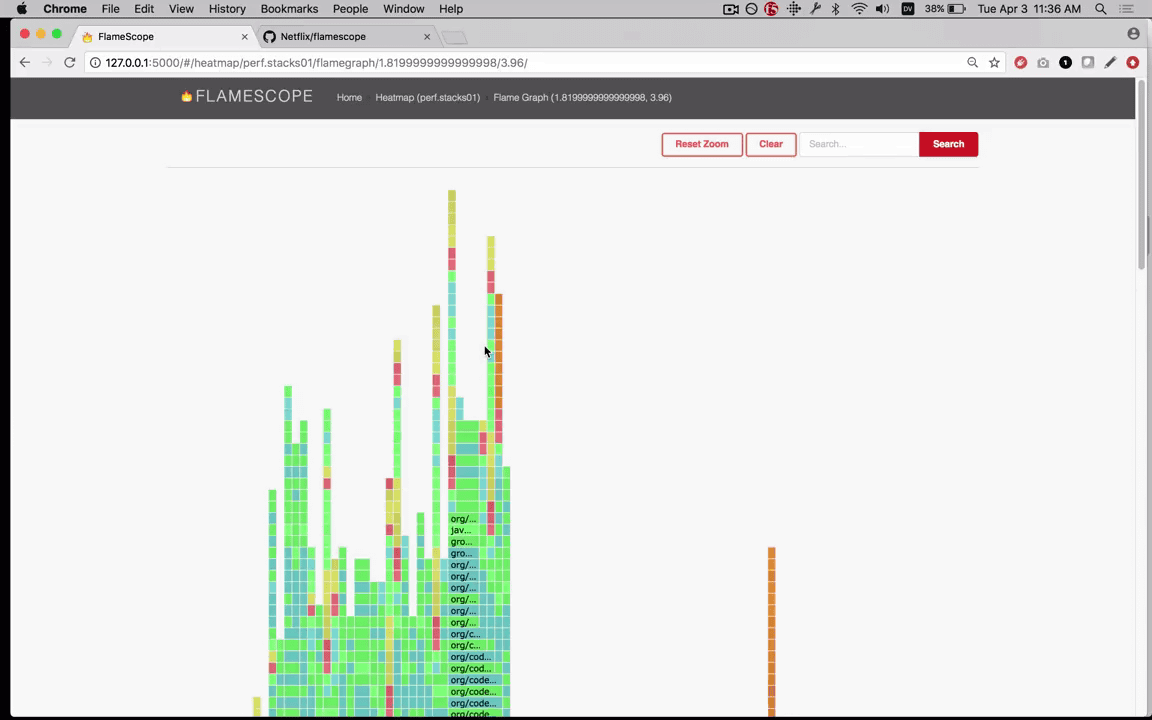
For example, if you select a few milliseconds for this heat map ......
The Flame Graph (frame graph) of that range is displayed. How to read the frame graph is "Draw Flame Graph with Golang | SOTAHowever, each box represents a function, and the box at the bottom is the ancestor of the box above. In the heat map, the horizontal axis is time, but the horizontal axis of the frame graph shows the ratio of the function Sample, and the width broad shows the frequency of occurrence.
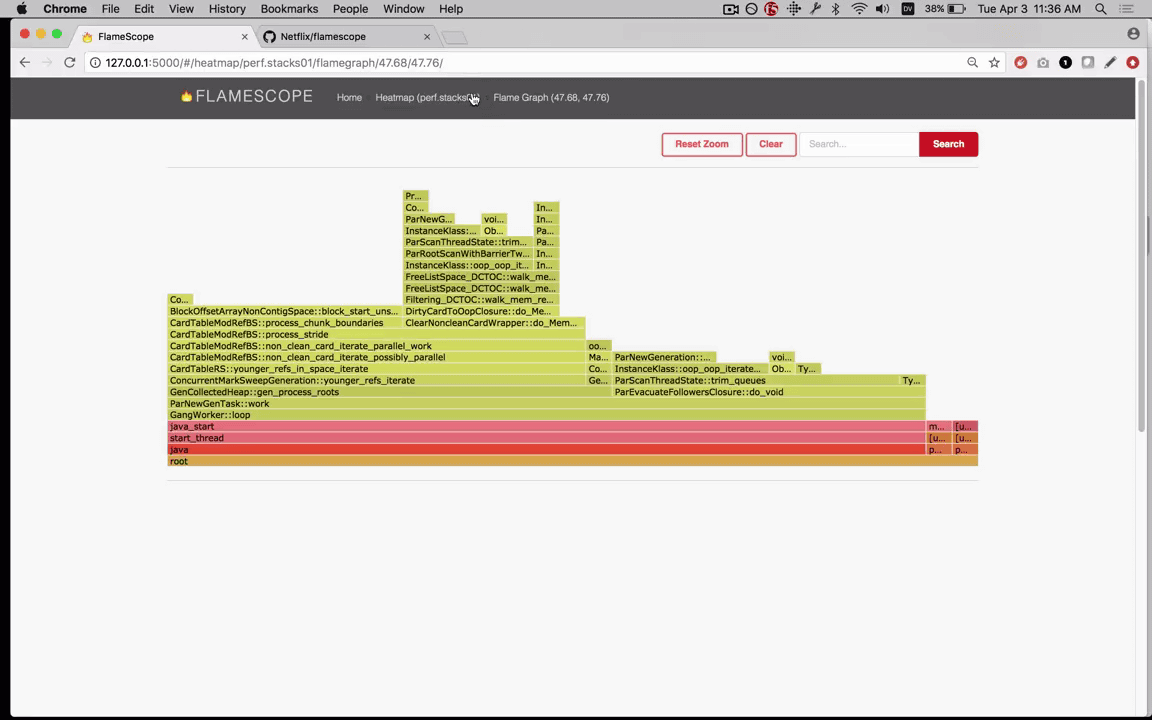
If the selection range of the heat map is wide ...
The frame graph has something very high.
You can check if the corresponding function is included by using the search box in the upper right.

If you add a new profile to the example directory, you can view it on FlameScope.
Related Posts:


in Web Service, Posted by logc_nt