A strong man who created real data that removes influences such as age and degree of progress from the "cancer 5-year survival rate data" published by the National Cancer Research Center appears

The National Cancer Research Center announced for the first time survival data of cancer patients 5 years after, targeting 188 hospitals nationwide on August 9, 2017. However, the survival rate data merely shows the survival rate of each facility and it is not classified by factors such as age and degree of progress (stage), which are significantly related to survival rate after 5 years of cancer, so a simple comparison I could not do it. In order to solve this inconvenience, using adjusted statistical modeling, adjusted data with the influence of age, stage etc. removedStatModelingHas published it.
Find a good hospital from cancer 5-year survival data with statistical modeling - StatModeling Memorandum
http://statmodeling.hatenablog.com/entry/best-hospitals-for-cancers
A report on cancer survival rate of cancer patients in cancer hospital cooperative hospitals nationwide published by the National Cancer Research Center "Cancer medical collaboration hospital hospital internal cancer survival rate total" is the following page It is published in.
Cancer medical consultation hospital hospital hospital in-hospital cancer registered survival rate tabulation: [National Cancer Center Research Cancer Registry · Statistics]
https://ganjoho.jp/reg_stat/statistics/brochure/hosp_c_reg_surv.html
However, since data only calculates simple survival rate, cancer survival rate is influenced by various factors such as age and degree of progression, it can not simply judge whether treatment of the facility is good simply by survival rate As noted in the notes.

In that case, StatModeling's aim is to investigate the survival rate after 5 years with statistical modeling excluding the influence degree of each factor and discuss the goodness of the hospital. The result of StatModeling is also an estimation result based on the assumption, and it is necessary to be careful that it does not assert the truth.
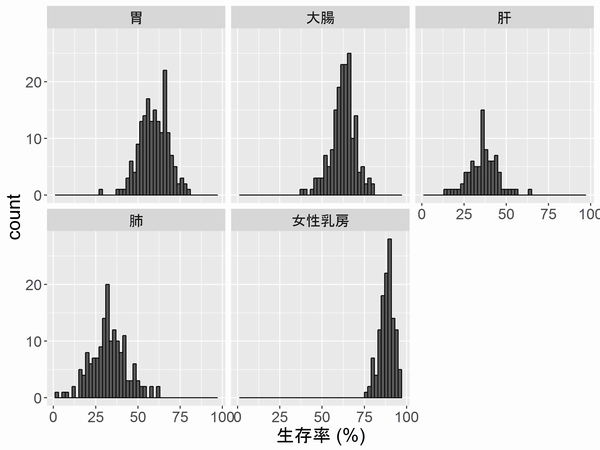
The five-year survival rate for each cancer before removing the influence at the beginning is shown as a histogram as follows. In the unadjusted state, StatModeling points out the possibility that the survival rate is higher for larger hospitals, but that the average age and progression of patients is low.
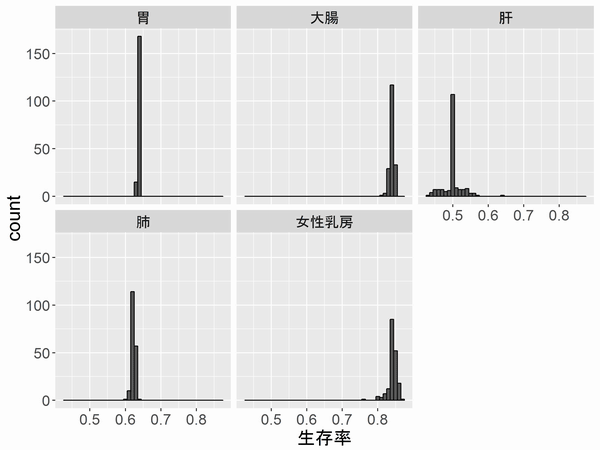
Therefore, if you estimate the survival rate and surgical rate for each hospital by fixing the average age and average progression level and estimating the survival rate as a histogram, it is as follows. Stomach cancer, colon cancer, and lung cancer are almost uneven, and there is almost no difference depending on hospital. On the other hand, liver cancer and breast cancer are slightly different from hospital.
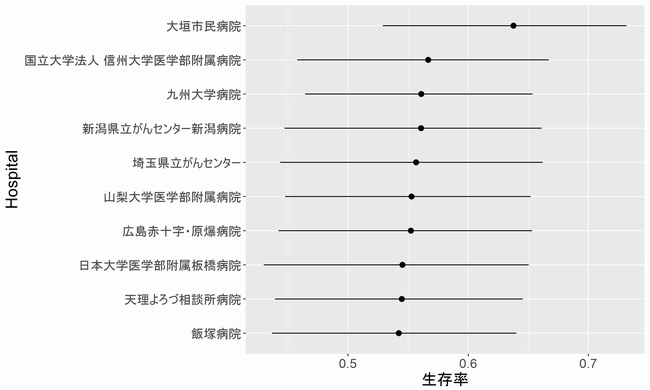
For the two types of cancer with somewhat variability, the top ten hospitals with outstanding achievements are announced.
Liver cancer is as follows. The sunspot is the median, and the horizontally extending line is the Bayesian confidence interval. In addition, Ogaki Municipal Hospital who was the top has a comment that "4. Liver (C22) is limited to excision cases", and data excluding unresected patients are excluded, so it is not a fair but a correct result I can not say it.
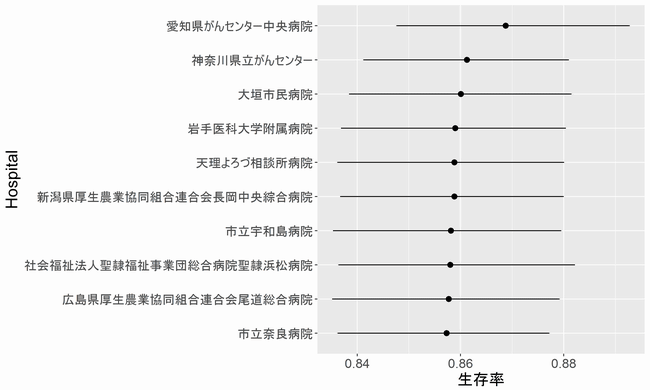
Breast cancer is as follows. 1st placeAichi Cancer Center Central HospitalHe also said that he was also a top scorer with the surgery rate, influence other than surgery (hospital effect) ranked first.
Next, what is the influence of factors such as "age" and "degree of progress" of cancer patients on each cancer that caused statistical modeling to be used? It is also calculated.
The following figure is a study of the influence of "cancer" "age" "degree of progress" "operation rate" "small cells" on the "5-year survival rate" of each cancer. The black dot indicates the median, the horizontally extending line indicates the Bayesian confidence interval, the dotted line indicates magnification 1, and the more to the right, the higher the survival rate.
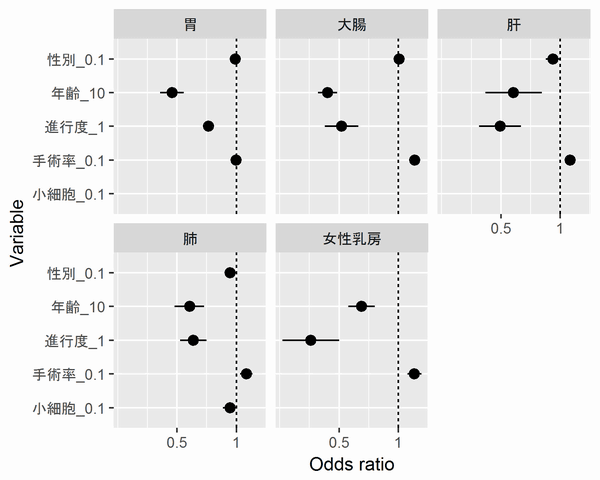
From the graph above, the influence of "age (10)" of gastric cancer is about "0.5" and that "survival rate / death rate becomes 0.5 times as the average age of patients increases by 10 years" It means that it means. In other words, the older the younger the younger you are, the more easy it is to sustain, "you know that stomach cancer has a big influence on age."
Besides, we can see that liver cancer has great influence on age and progress degree, lung cancer has a large influence on age and progression degree, and breast cancer has a great influence on progress degree. In addition, we can also see that gender has little effect in most cancers.
We calculate the degree of influence that factors of "sex" "age" "degree of progress" "surgical rate" "small cells" have on "operation rate".
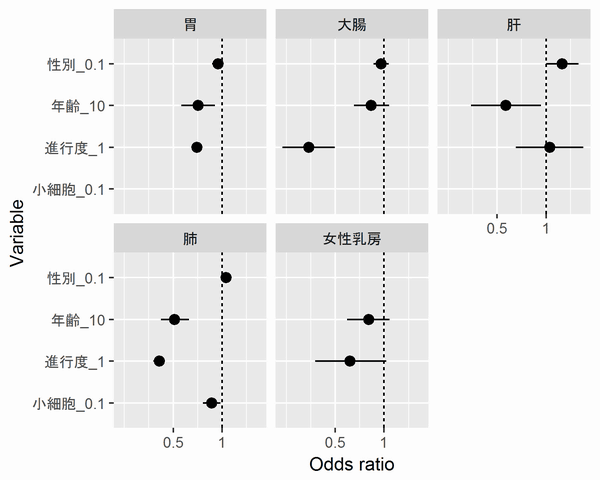
From the graph, you can see the tendency that "surgery is not selected for lung cancer as the stage goes up." StatModeling pointed out that "it seems unlikely that the influence of the progress seems to be low in liver cancer."
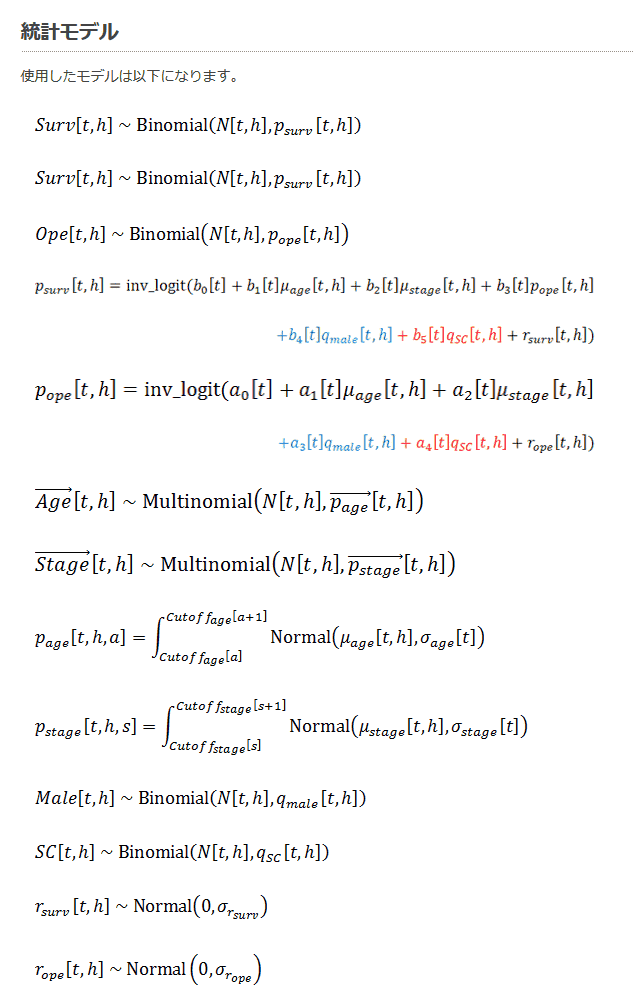
The StatModeling blog contains detailed information on the model used in this statistical modeling, the difficulty in handling data and solutions.
In addition, "Regretful hospital list that did not publish it with difficulty" is also released.
Oji jogging hospital
Iwate prefectural Chubu hospital
Iwate Prefectural Kanazawa Hospital
Akita Prefecture Health Agricultural Cooperative Federation Atsushi Akita Medical Center
Akita Prefecture Welfare Bond Yuri Association General Hospital
Yamagata City Hospital
Public Tomioka General Hospital
Saitama Medical University International Medical Center
National Health Insurance General Hospital Kimitsu Chuo Hospital
Tokyo Metropolitan Komagome Hospital
Teikyo University School of Medicine Hospital
Kyorin University Medical School Attached Hospital
Fukui University School of Medicine Hospital
National Hospital Organization Iwakuni Medical Center
Yamaguchi ken Welfare Agricultural Cooperative Federation Kyoto General Hospital
Related Posts:


in Science, Posted by darkhorse_log