Publication of the report "2017 Internet Trends" which is packed up of the Internet and now

ByAlan Levine
Report "2017 Internet Trends" full of information such as "internet trends in the world", "net advertisement", "interactive game", "media", "cloud", "internet in China", "internet in India" and "healthcare" It is open to the public.
2017 Internet Trends - Kleiner Perkins Caufield Byers
http://www.kpcb.com/internet-trends
Mary Meeker's 2017 Internet Trends Report by Josh Constine
https://www.scribd.com/book/349976485/mary-meeker-s-2017-internet-trends-report
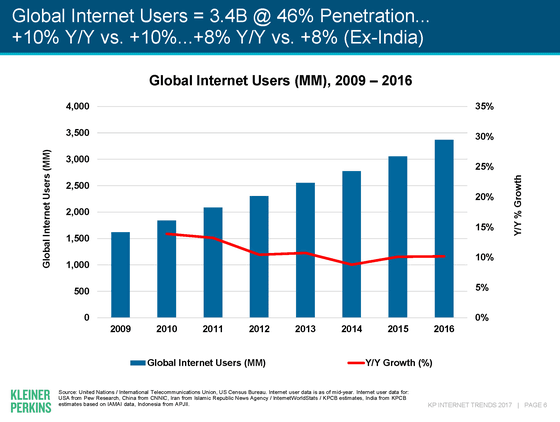
Graph showing the number of net users all over the world. The bar graph shows the number of users, the red line chart shows the growth rate. The number of users is steadily increasing and the growth rate has been somewhat dull between 2009 and 2014, but it is on a recovery trend after 2015.
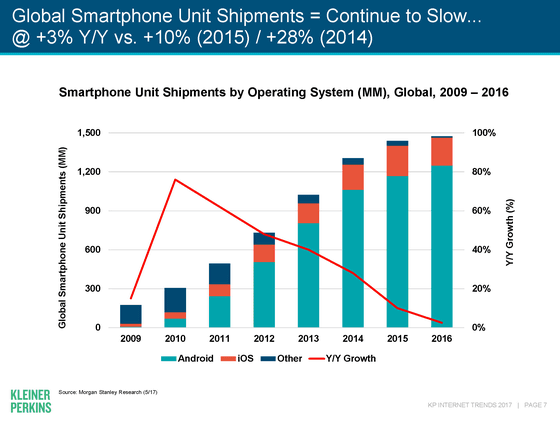
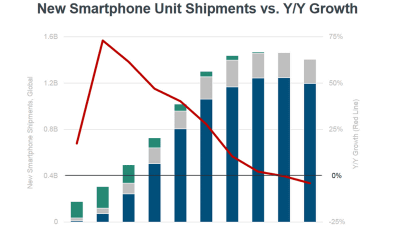
Looking at the number of shipments of smartphones by OS, Android (blue-green color) occupies an overwhelming share that was almost as good as 2009 as of 2009. However, as shown by the red line chart, the growth rate was close to 80% in 2010, but it is nearly zero as it is no longer growing.
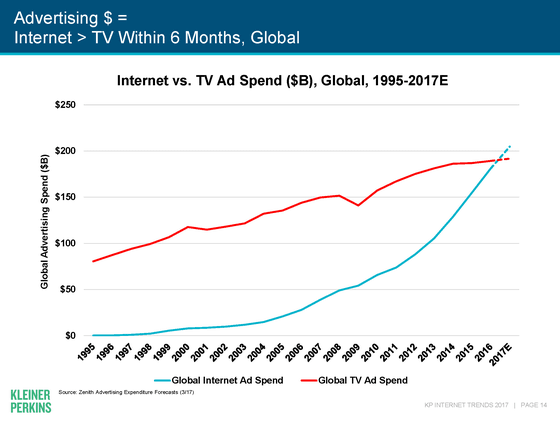
When paying attention to the relationship between the Internet and advertisement, the advertisement cost (blue) for the Internet is growing steadily globally. Meanwhile, I think that the advertisement cost (red) of TV, which is a "competitor", is depressed and this is also growing. But, at lastThe seat of 'King of advertisements' is from TV commercial to the netI'm going to move.
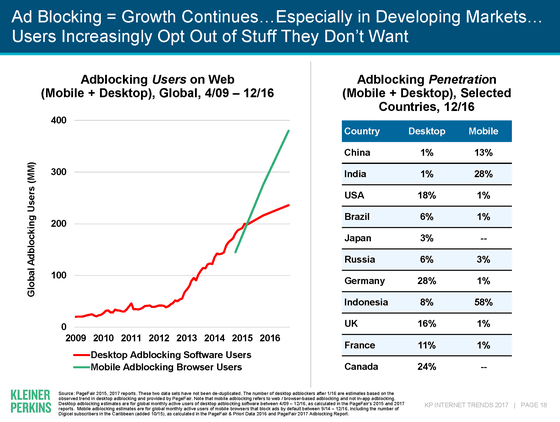
As you get on that trend, the number of users who use "ad block" software and add-ons to hide advertisements is also increasing. For desktop (red), the number of uses has been increasing since about 2013, but the noteworthy is mobile (green), mobile blocking is penetrating with more momentum for desktop use. On the right side is the ad block usage rate by country. In Germany, desktop users account for 28% of advertisers using ad block,A news site or major media loses six times by making a trial in which Adblock Plus is illegal.doing. If it is for mobile, Indonesia is overwhelmingly 58%.
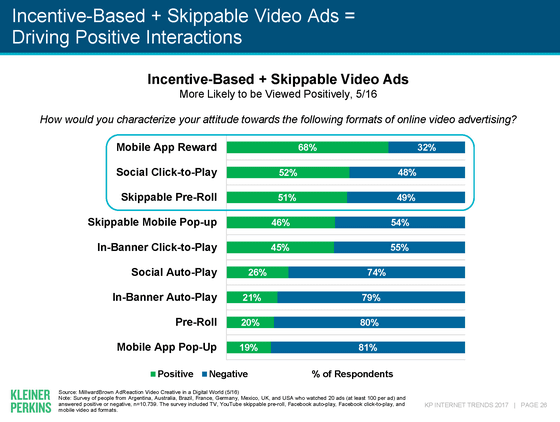
But I also know that not all advertisements are hated. Rewards ad, such as point can be obtained by clicking on the mobile app, also be possible to skip in the middle is inserted by clicking included in the SNS such advertising is played for the first time, or before video playback video sites such as YouTube Pre-roll advertisement has gotten positive response from over half of users. If Uragaese, pop-up ads and banner ads of other mobile-optimized, and arbitrarily ad to be played, such as non-skippable pre-roll ad is the state there are more negative reaction.
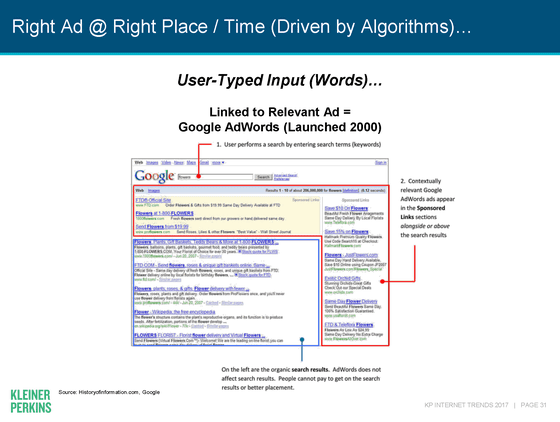
"Place the correct ad in the right placeIt is Google that keeps adhering to the policy of "You are in. Sponsored links are displayed above and to the right of the search result, but advertisements never enter the search result list part on the left.
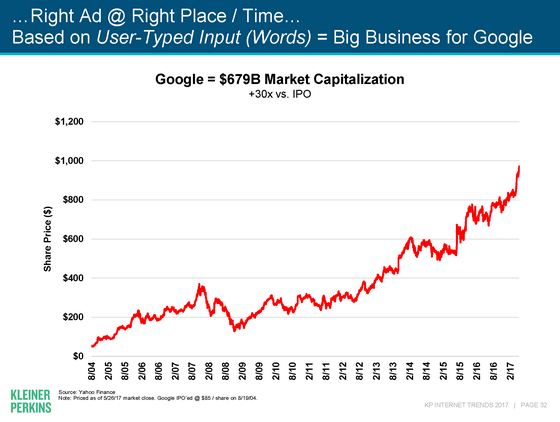
As a result, Google has achieved steady growth.
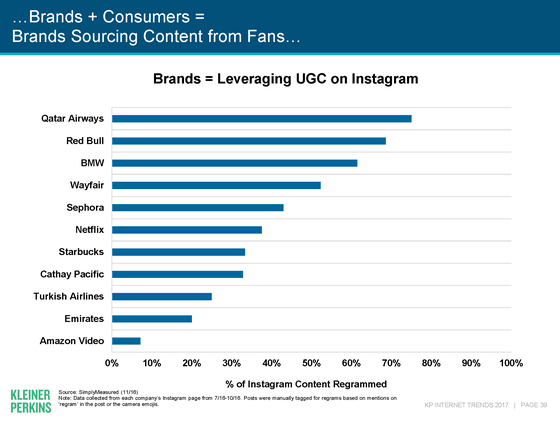
Meanwhile, the influence has been increasing, as a photograph taken by a user voluntarily shooting in Instagram such as "UGC (User Generated Content)"is.
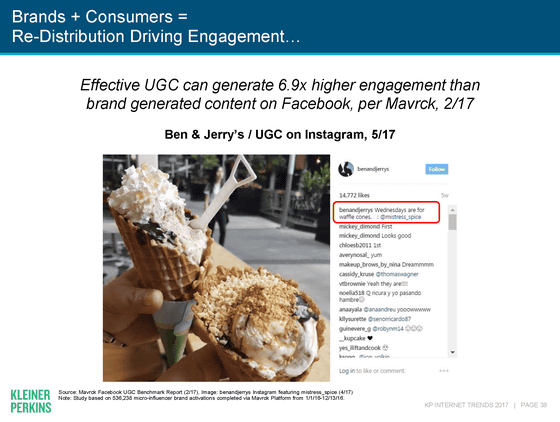
Qatar Airlines, Red Bull, BMW etc. know that UGC contributes to brand awareness raising, and "positive spiral" is born here.
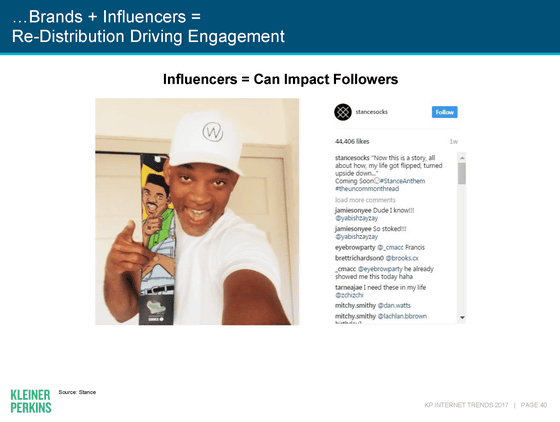
Also, the presence of a person (influencer) who spreads information with great influence on the followers is also important.
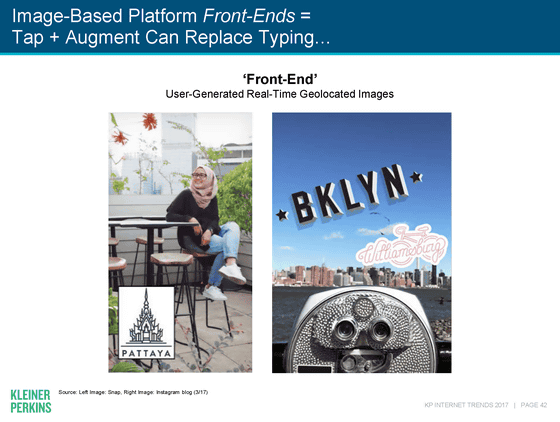
The leading role of UGC is to evoke visual images such as photos from letters.
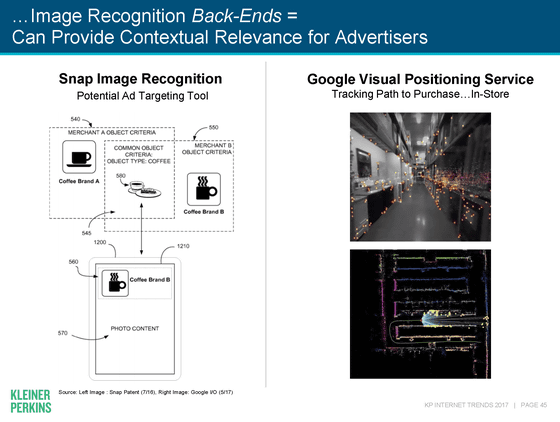
As a way to link photos with "meanings", Google developed"Google Lens" tells us information on what the subject was taken onthere is.
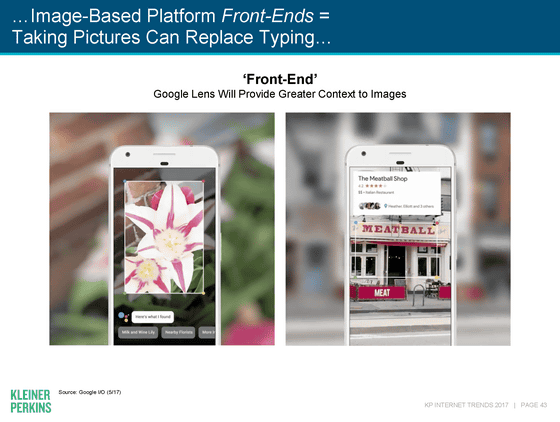
By linking pictures with image analysis and location information to the real world, it will be possible to link photos and advertisements in the future. This type of technology is expected to become a more important technology in the future.
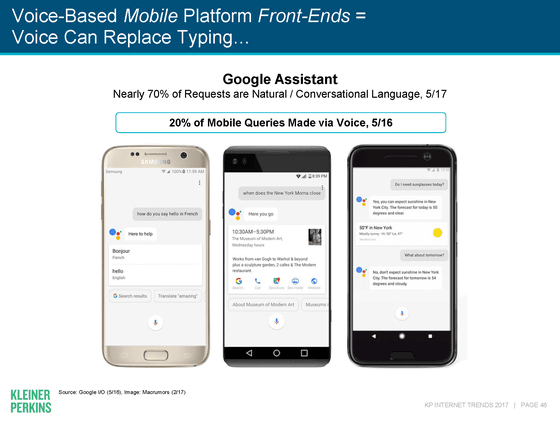
20% of Google's mobile search use was voice search.
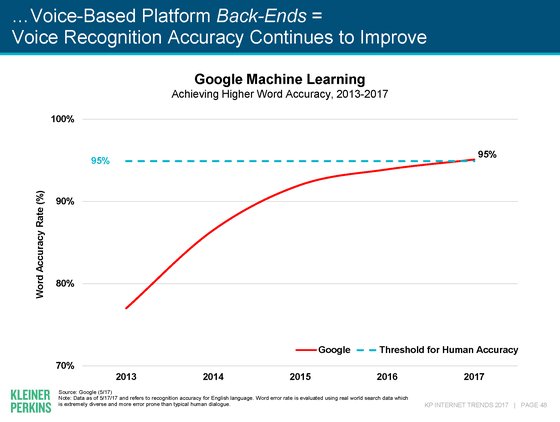
There seems to be reason to say "to use voice search because it's handy", but the point that it is tolerable to practical use is a big point. It seems that the human threshold accuracy is 95%, but Google is finally approaching that area in 2017
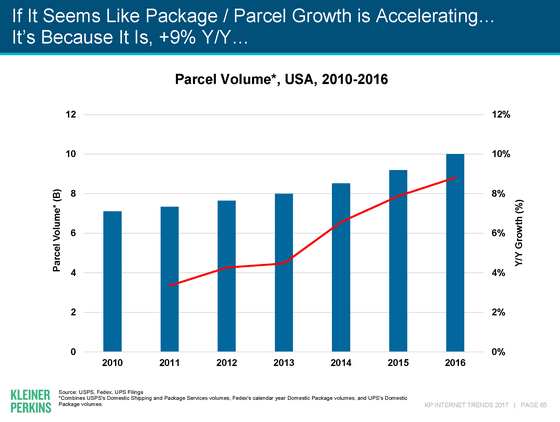
Upon receiving favorable sales of online mail order, the amount of "baggage" in the United States is gradually increasing. By 2013 the growth rate was around 4% a year, but it has been growing for some reason since 2014.
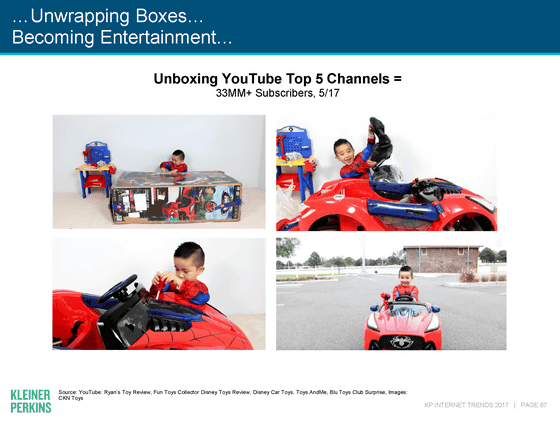
On YouTube, "opening" is one entertainment. The top five in this field "Ryan's Toy Review"Fun Toys Collector Disney Toy Review"Disney Car Toys"Toy AndMe"Blu Toys Club SurpriseThe number of subscribers to total is up to 33 million.
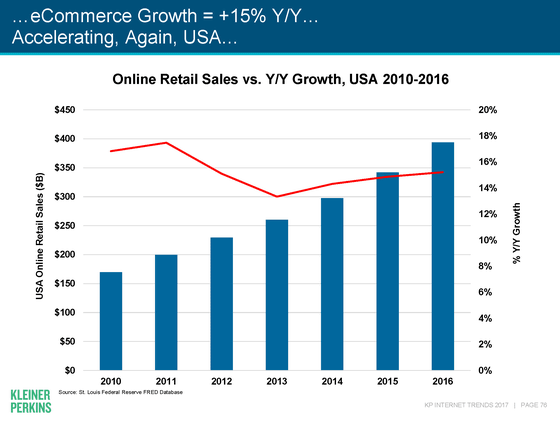
It is American data, but the handling amount of net mail order rises to the right. Growth rate is momentum from 14% a year to 18%.
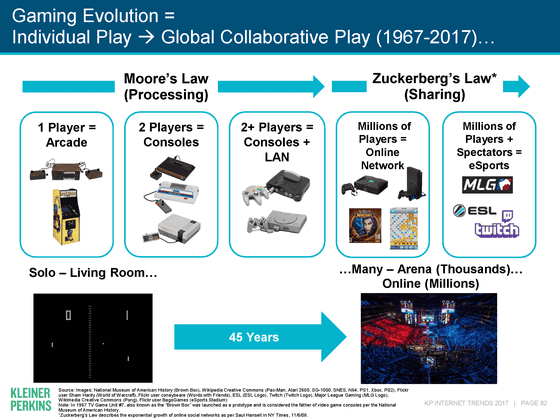
The game has evolved from what one plays with alone to what it fights and cooperates with, and finally it has reached e-sports, with things to enjoy with many people via the network.
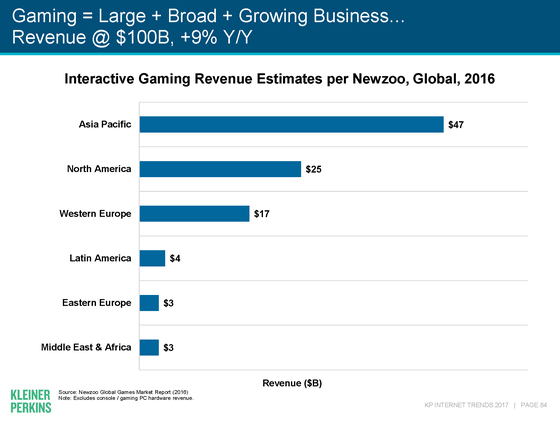
In the Asia-Pacific region, the market is huge as there are many population countries such as China and India.
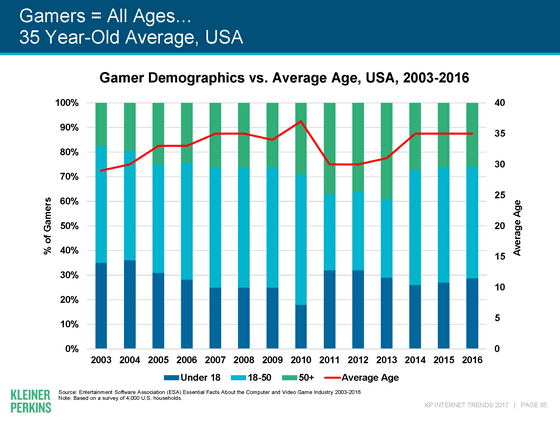
For America alone, the average age of "gamers" is around 35 years. Although it is rising somewhat compared to 2003, it does not continue to rise, so it seems that the new layer is flowing smoothly as well.
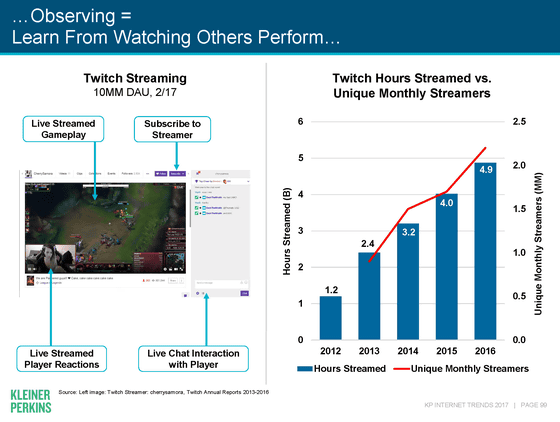
In addition, the genre of game play and its appreciation is also growing.
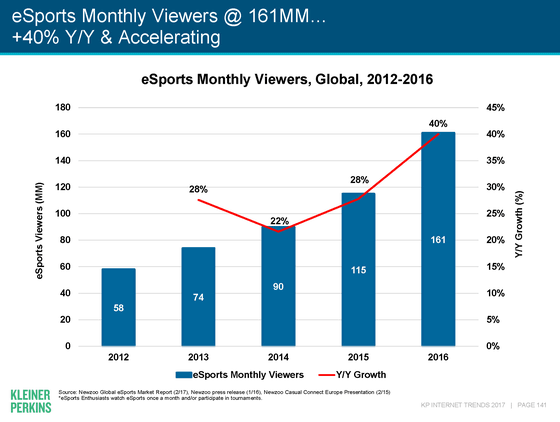
The number of e-sports monthly viewers is also increasing at a pace of more than 20% per year.
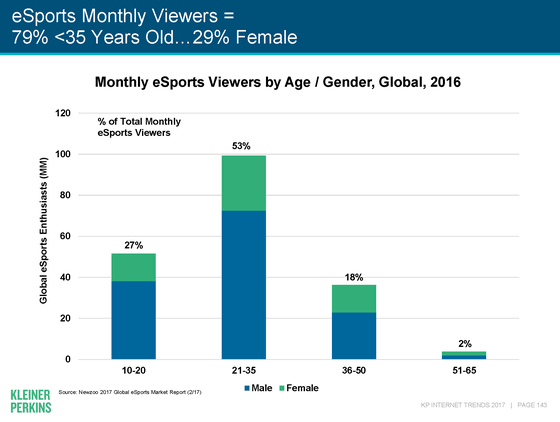
The audience group is mainly 21 to 35 years old. The blue color of the graph is male and the green color is female, which means that although there are many men in proportion, there are not a few women.
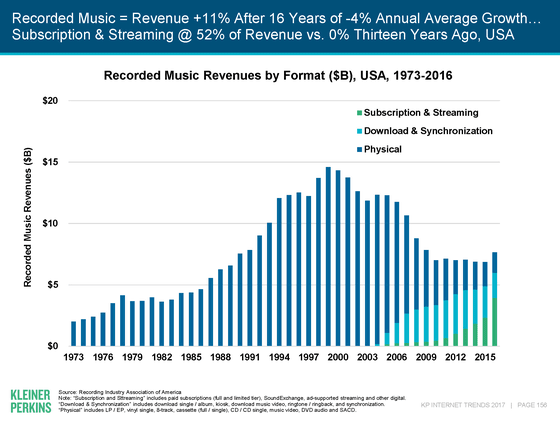
Peak in the music industry's sales is around 1999-2000. Physical media such as CD has slowed down at a stroke since download sales began, and download sales are now overtaken by streaming and subscription type services.
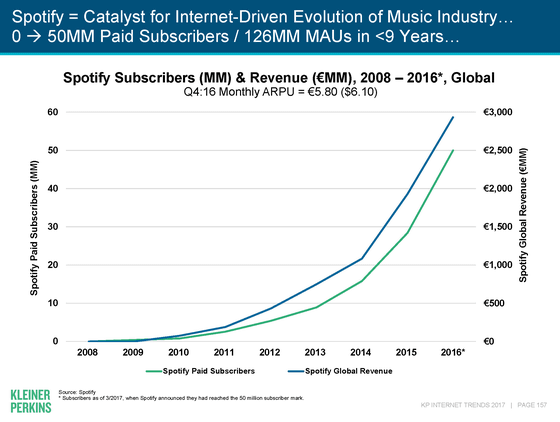
The music distribution service "Spotify" is its representative. Blue shows sales and green shows paid users, but you can see that it grows year after year.
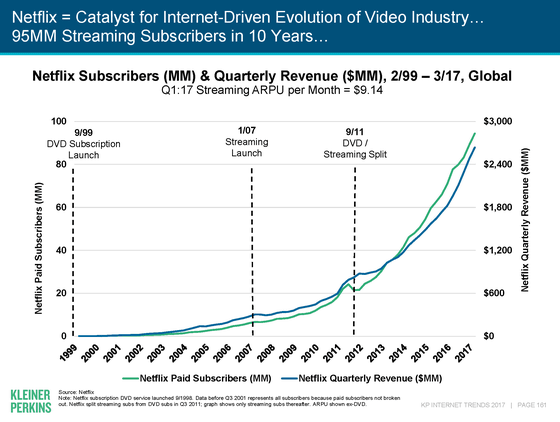
"Netflix" which is known for distribution of movies and dramas is drawing graphs similar to Spotify. Here also blue is sales and green is the number of users.
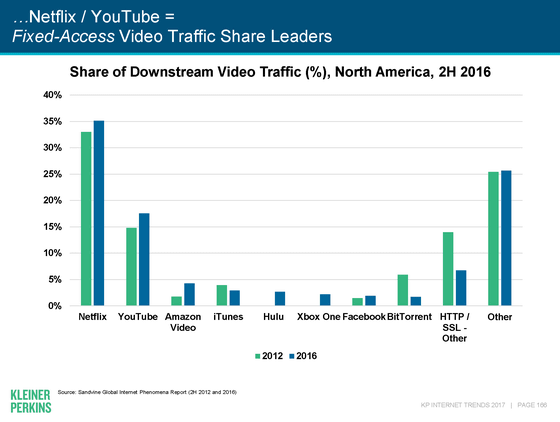
This graph shows "What is the major service that occupies downstream (downstream traffic)"? You know that YouTube is strong in the mobile environment, but the share of 2016 (blue) is decreasing compared to 2012 (green), Facebook, Instagram etc. are growing.
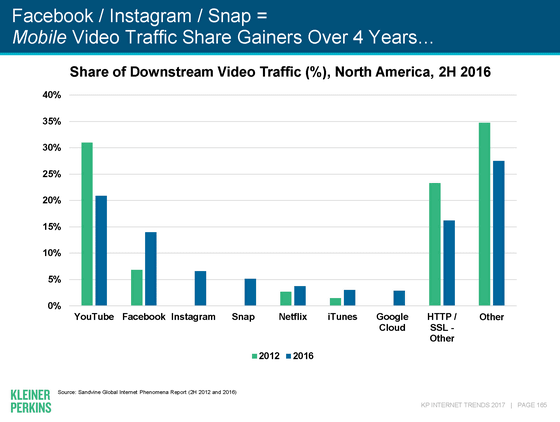
Netflix is overwhelming if you do not limit your environment to mobile.
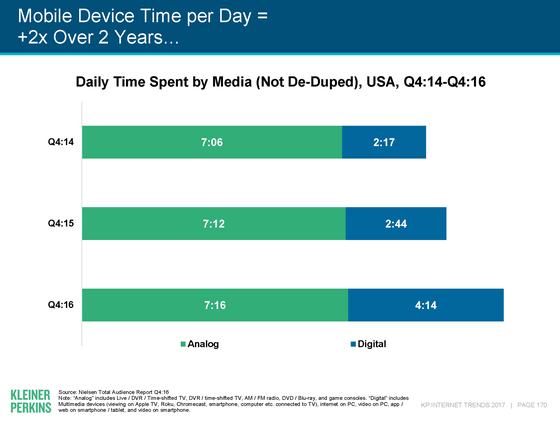
A graph showing how much use is made of "analog terminal" of television and radio and "digital terminal" such as PC, smartphone etc. per day. Analog numbers have not changed, but digital use time has been growing steadily.
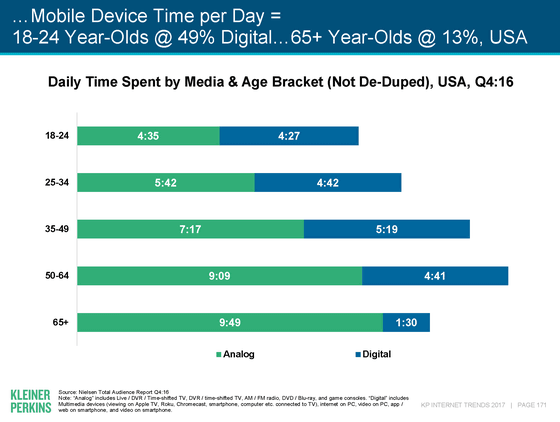
By dividing the results of the same survey by age group, the longest time to use digital terminals was between 35 and 49, average 5 hours and 19 minutes a day. Is it because there are many opportunities to use smartphones at work?
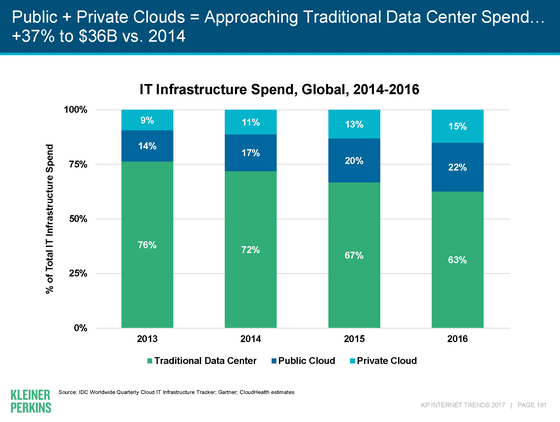
A graph showing the change in the utilization ratio of the cloud. The proportion of public cloud & private cloud is increasing.
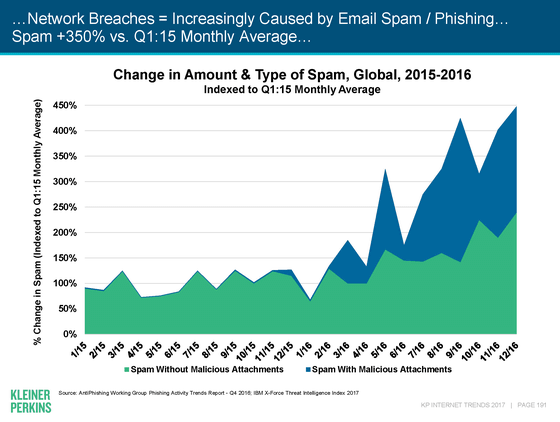
In this graph you can see that the risk of 'spam' is rising. Green is spam without malware attached, and blue is spam with malware attached, with an average value of 100 in the first quarter of 2015. Although spam that malware was attached had existed for a long time, those with malware have increased dramatically since 2016, and the total number of spam has increased by 4.5 times in about two years.
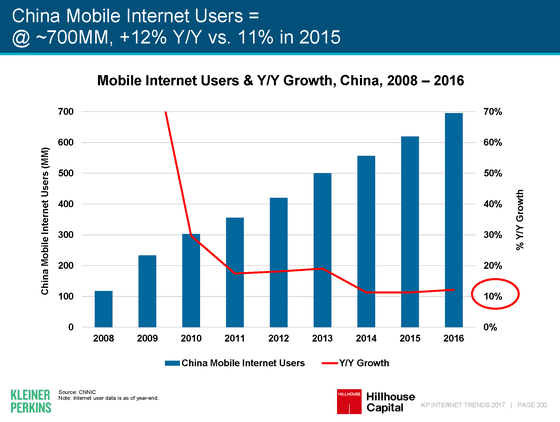
From 193 pages, information on China is summarized. The number of mobile Internet users in China is about 700 million in 2016. Growth rate is considerably lower than before, now it is about 10%.
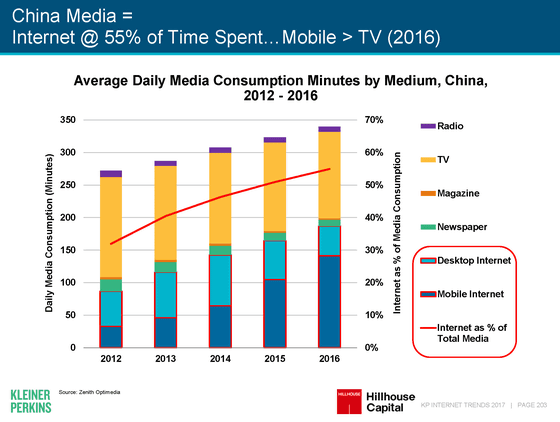
The time spent on the Internet has increased steadily.
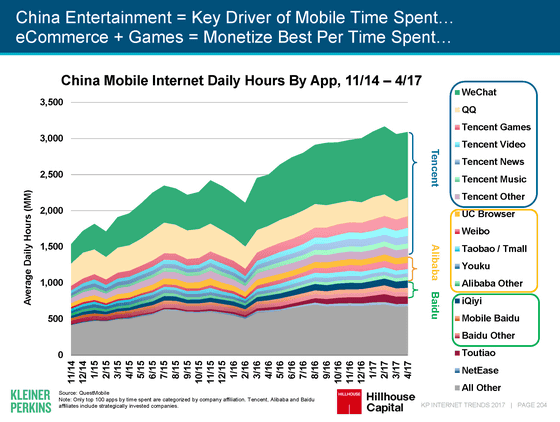
A breakdown on what kind of applications and services are used. Tencent contents such as WeChat and QQ are gaining popularity.
Related Posts:


in Note, Posted by logc_nt