Ranking showing the poor condition of traffic congestion in more than 1,000 cities in the world "INRIX Global Traffic Scorecard"

As urbanization advances, the problem of "traffic congestion" can not be avoided. Data ranking the severity of traffic congestion for 1064 cities in 38 countriesINRIX 2016 Global Traffic Scorecard"Is released and it is clear where the city suffers from traffic congestion.
INRIX Global Traffic Scorecard
http://inrix.com/scorecard/
"INRIX Global Traffic Scorecard", a poor traffic congestion ranking, has been created by analyzing 300 million big data, including GPU data of commercial trucks that total 5 million miles (about 8 million kilometers).
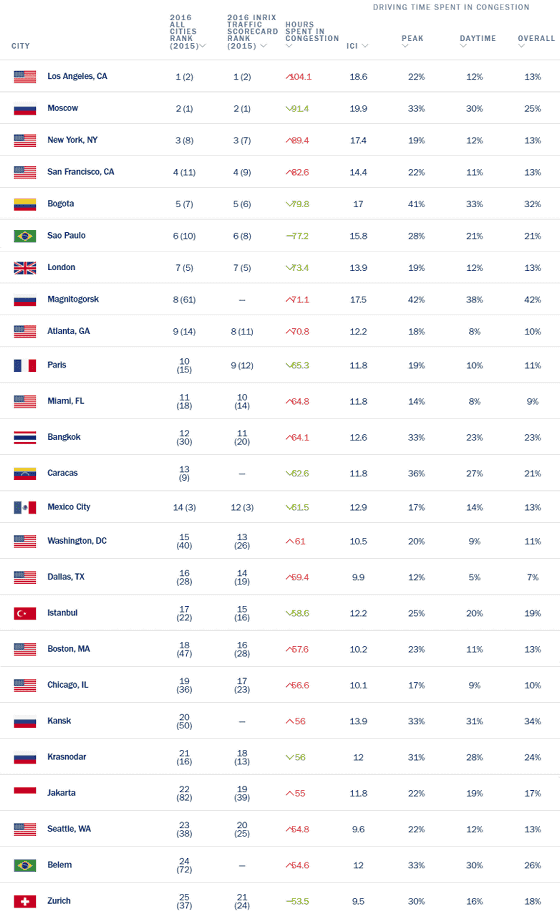
The ranking list of the top 25 cities of the traffic congestion inferior ranking by the 2016 version of INRIX Global Traffic Scorecard is as follows. Regrettably Japanese cities are not subject to survey.

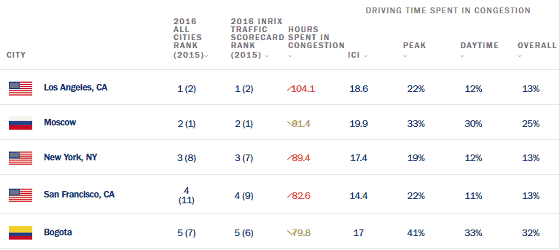
First place is Los Angeles of America. At the peak, 22% of the total time is congested, and the congestion time is 104 hours a year. Second place is Moscow in Russia, 3rd, 4th in New York, USA, San Francisco, 5th with Bogota in Colombia.

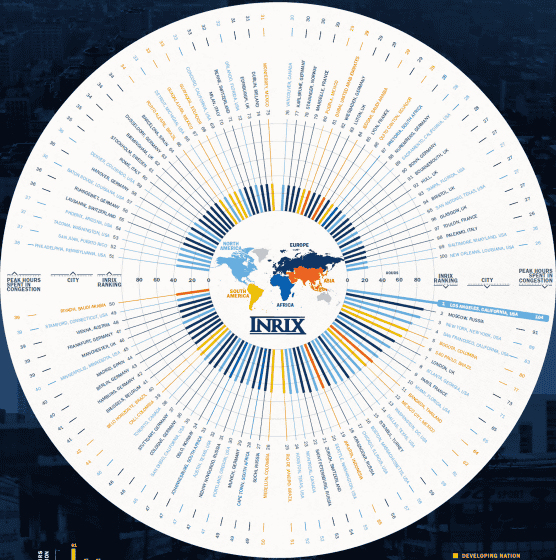
An infograph that arranges the congestion ranking in a clockwise fashion with the annual congestion time as a bar graph. The light blue color is North America, the yellow color is South America, the dark blue color is Europe / Eurasia, the blue color is Africa, and the orange color is Asia.

In the ranking by country, Thailand ranked first, Colombia the second place, Colombia the third place, Indonesia and the developing country are ranked by the developing countries. However, it can be seen that there are many developed countries (light blue bar charts) where urbanization has progressed throughout the rank.

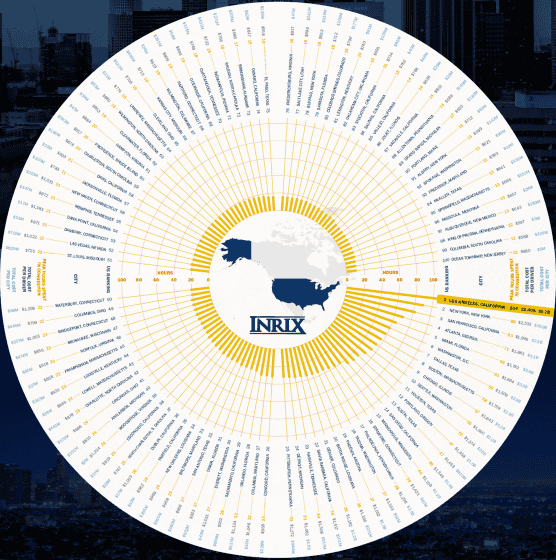
It is like this when you arrange the cities of the United States cities in order of traffic congestion time in 10 major cities which sent 10 cities among the top 25 cities. Because most cities have less than 30 hours of congestion per year, the crowds of some cities are outstanding.

As a numerical value showing the traffic congestion situation in the United States, the congestion time per drive is 9%, the average congestion time of the driver is 42 hours per year, the economic loss which all American drivers suffer from congestion is 300 billion dollars ( About 34 trillion yen), and the economic loss per driver is 1,400 dollars (about 160 thousand yen).

Related Posts:


