Map that was confidential of CIA is free for anyone to download
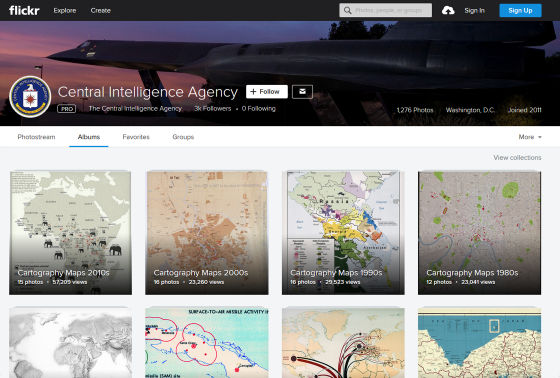
The CIA launched the map production department at the time of progressing to World War II, but in commemoration of the 75th year of the establishment of this map production department, the CIA released a confidential map for about 70 years . Numerous maps that were made about the battlefields and international issues from the 1950s to the 2010s and that were once treated confidential have been made available for viewing & free downloading on Flickr of image sharing site.
Collection: CIA Cartography
https://www.flickr.com/photos/ciagov/collections/72157674854602812/
An example of the map can be confirmed from the following.
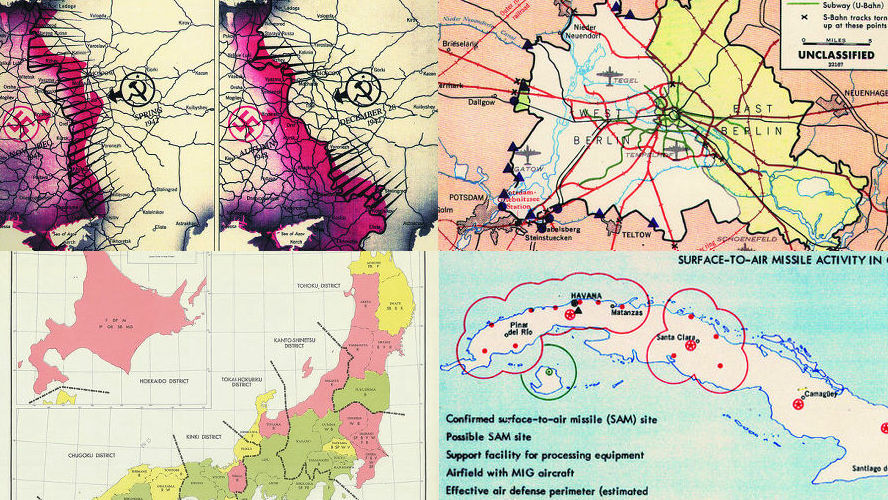
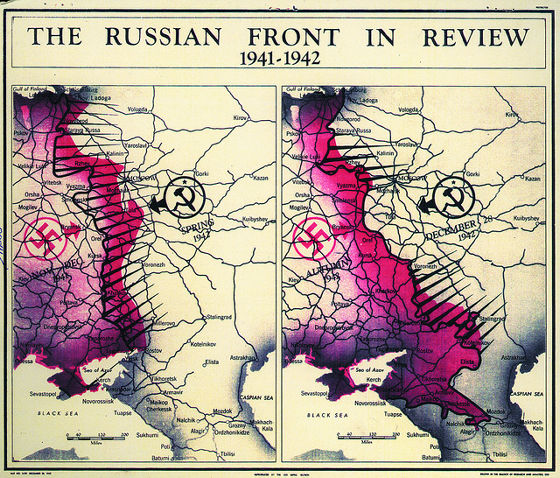
From 1941 to 1942, a map showing the situation of the fight between the Nazis · Germany and the Soviet Union.
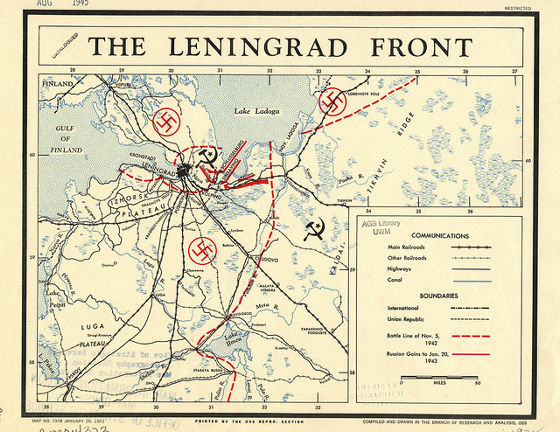
Leningrad siege battleThe state of.
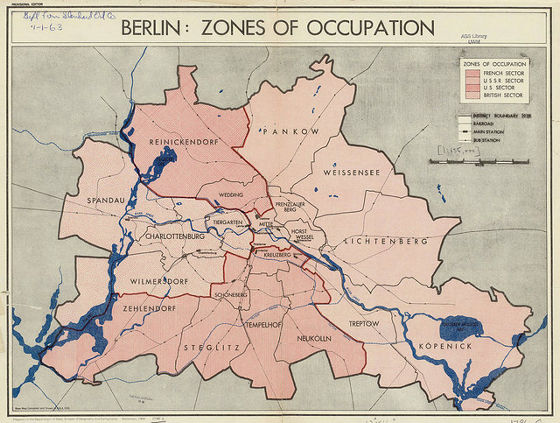
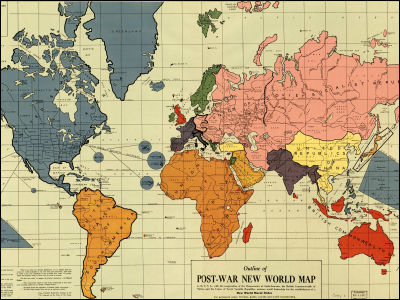
Occupation situation of Germany / Berlin in 1945. It is color coded in France / Soviet Union / USA / UK.
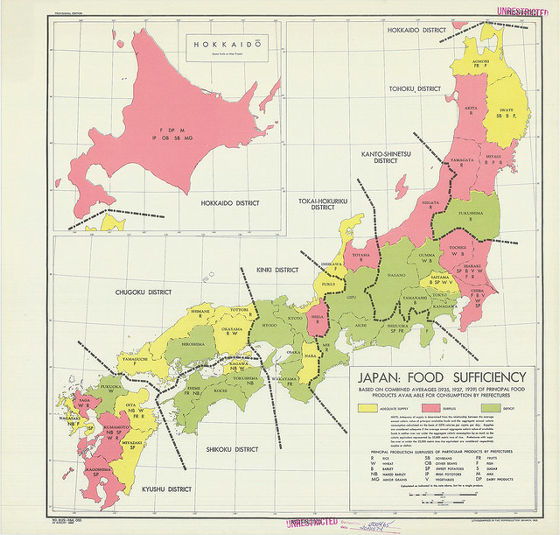
In 1945, food supply situation in Japan. Yellow indicates "sufficient", pink indicates "there is surplus", and green indicates "insufficient".
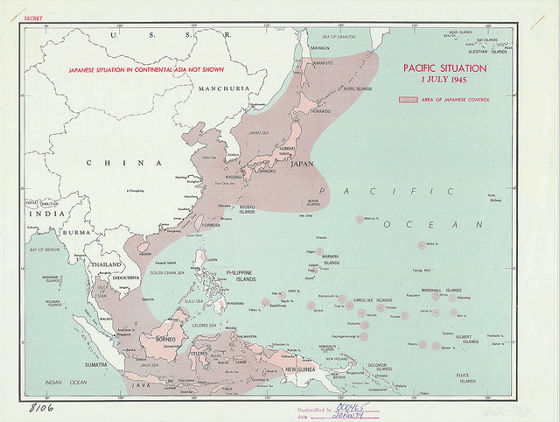
A map showing the domination of the Asian region by Japan in 1945. The area shaded with light color is the area where domination of Japan is reaching.
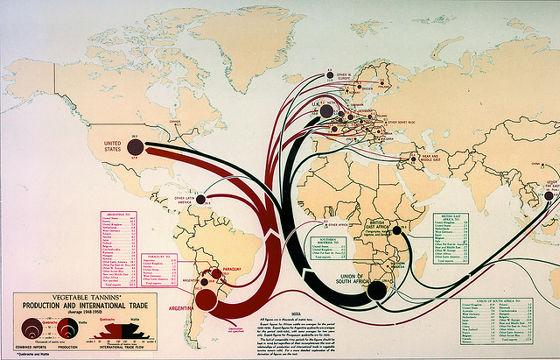
A map showing the flow of plant tannin production and international trade in 1950.
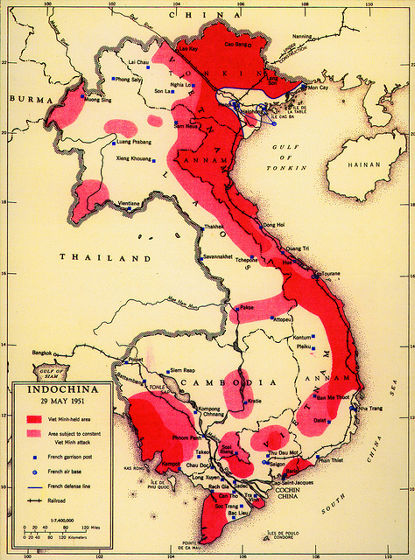
Map of the Indochina Peninsula in 1951. The area dominated by the Vietnam Independence Alliance, the area where the Vietnam Independence Alliance is attacking, the garrison of the French army, etc. are shown.
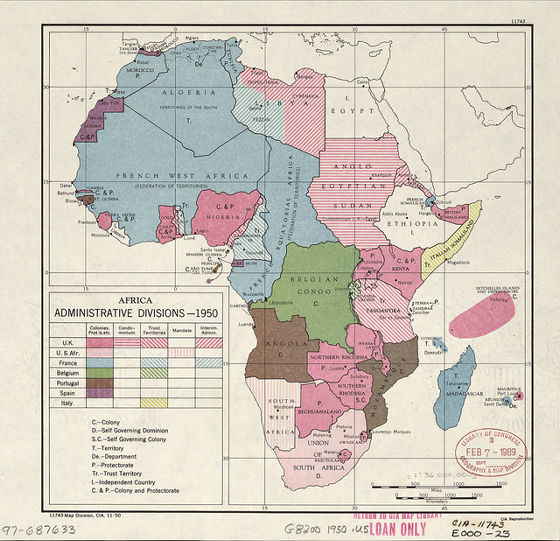
A map showing which country governed the African continent of the 1950s. Red indicates British, light blue color is France, green is Belgium, and so on.
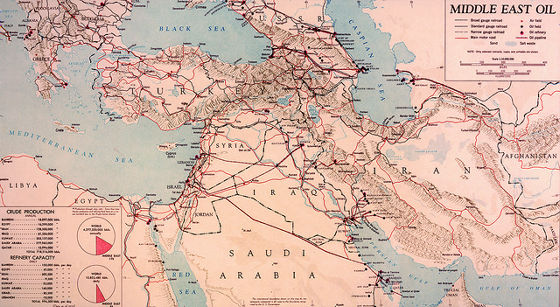
A map showing where the oil in the Middle East is mined and transported in 1951.
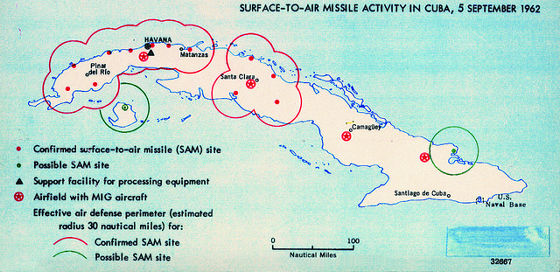
A map of when nuclear missile bases were found to be constructed in Cuba in 1962. A red dot is a place where a ground-to-air missile is confirmed, a green point is a place where there is a ground-to-air missile, Mig (fighter of the Soviet Union) is deployed.
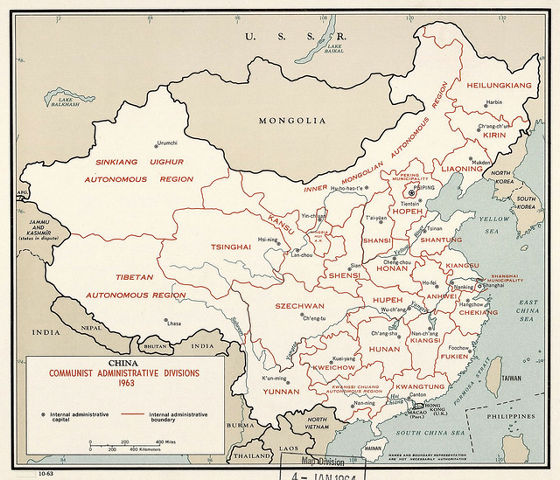
A map showing how the Communist Party of Japan divided and dominated the domestic market in 1963.
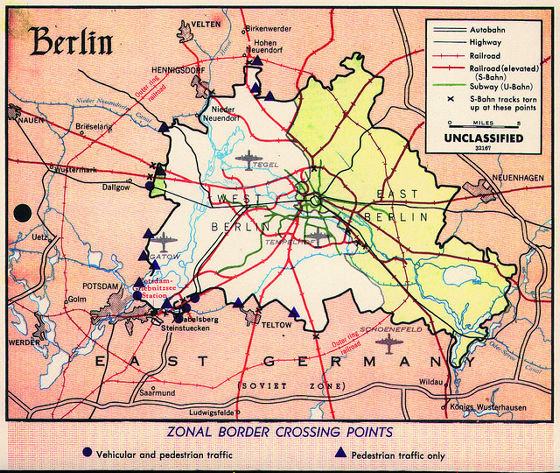
Berlin's transport network separated in the east and west.
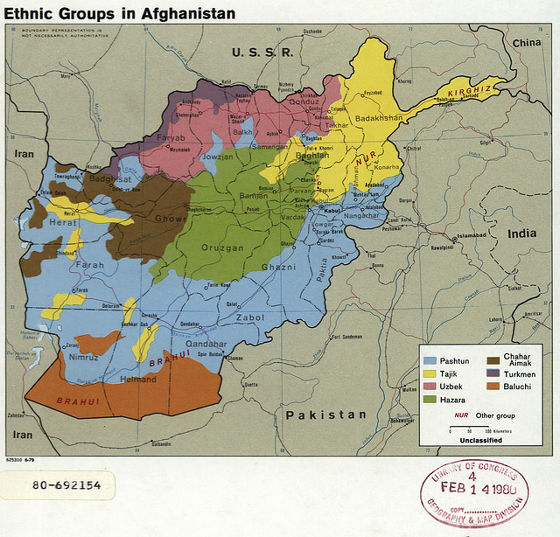
A map showing how each ethnic group was located in Afghanistan in 1979.
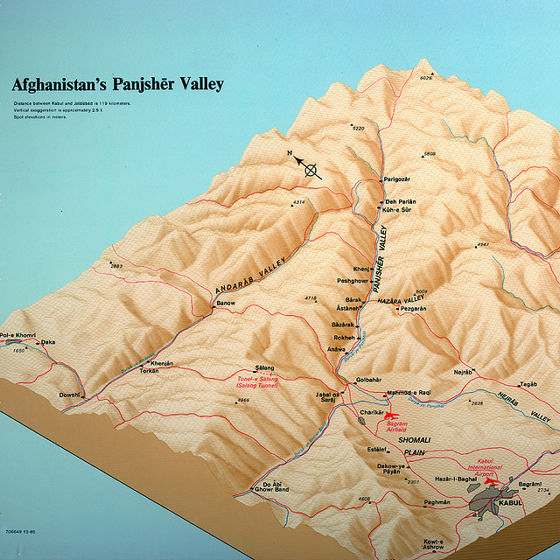
Hand-painted maps were mainstream until about 1960, but after that digital technology was introduced and in 1985, 3D maps will be used. This is the Panjzir Valley in Afghanistan.
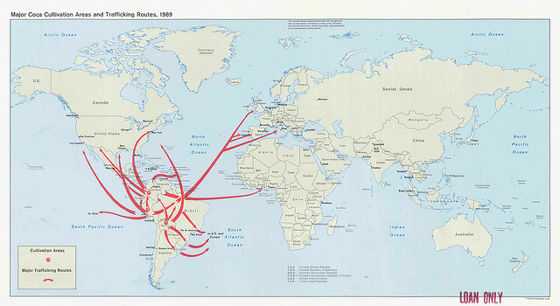
President Nixon in the 1970sDrug warAfter that, around 1990 a map of the cultivation and distribution route of cocaine is made.
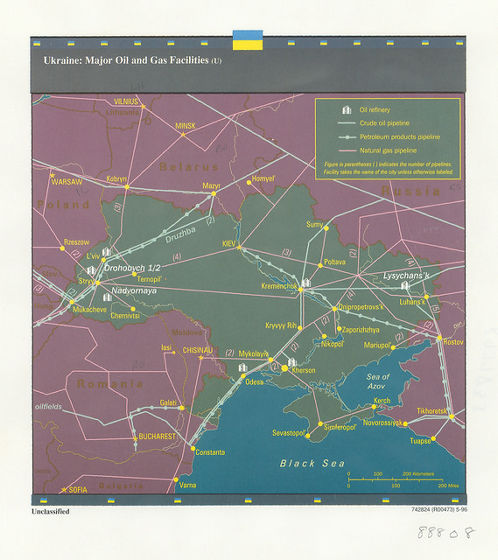
Map showing oil and gas refineries and pipelines of Ukraine in 1996.
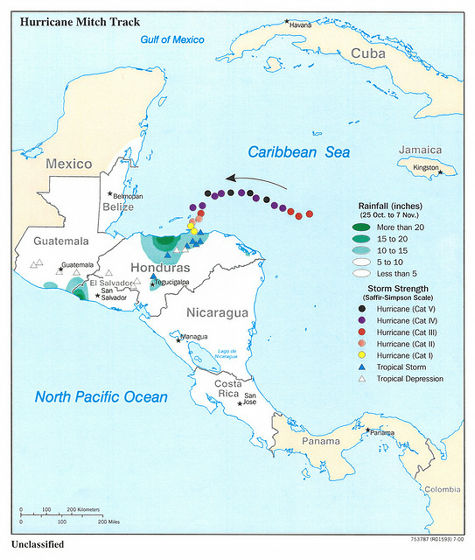
Record of rainfall amount and wind force of Hurricane Mitch hit America in late October 1998 to November.
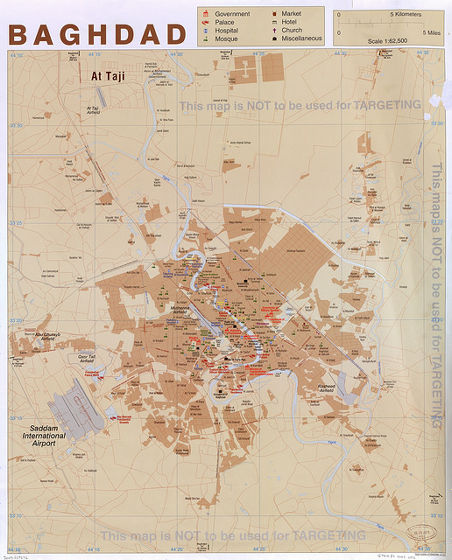
Map of Baghdad in 2003. "This map is NOT to be used for TARGETING (this map is not for target setting)" and it contains a thin letter.
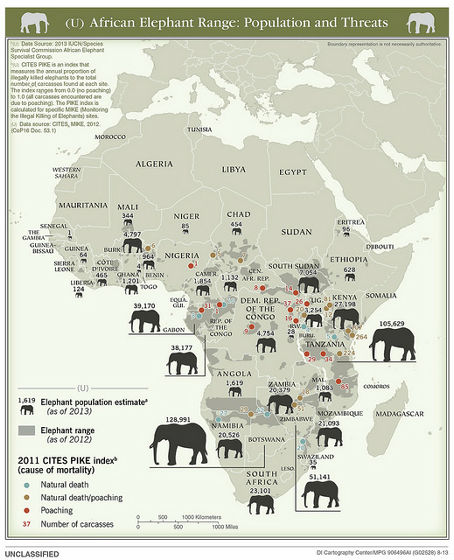
After 2010, maps other than war related matters will increase. This represents the number of elephants in the world and how natural death / death by poaching spreads out.
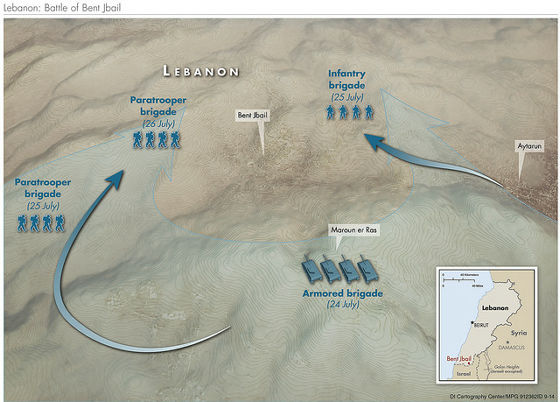
It shows how paratrosmen and infantry were mobilized in the battle of Syria and Lebanon in 2014.
In addition, other maps can be confirmed by age from the following. You can download maps for free, too.
Central Intelligence Agency's albums | Flickr
https://www.flickr.com/photos/ciagov/albums
Related Posts:


in Web Service, Posted by darkhorse_log