What is the evaluation tendency of "star" which was found by analyzing Amazon customer review 80 million cases?
Amazon online shopping "Customer ReviewIt is known that the user's evaluation and impressions of products called products are displayed on each product page and influence the purchasing behavior so much as to influence the sales of the product. The data which analyzed more than 80 million customer reviews of Amazon.com was released, and the trend is clearly shown how users are a star.
Playing with 80 Million Amazon Product Review Ratings Using Apache Spark
http://minimaxir.com/2017/01/amazon-spark/
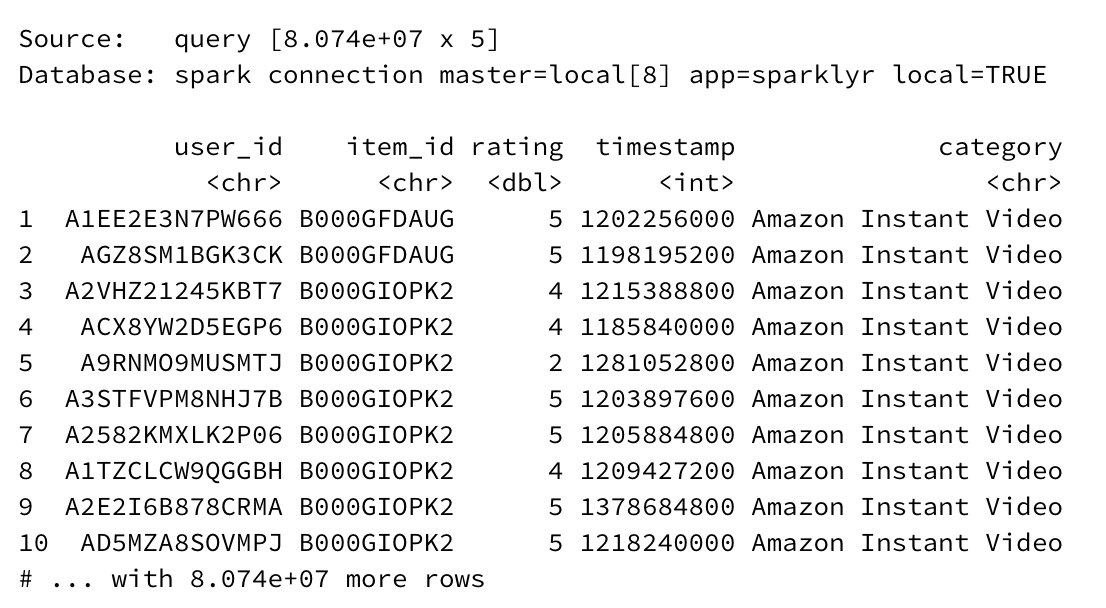
Software engineers analyzed customer reviews of Amazon.comMax WoolfMr. Before,Analyze 1.2 million Amazon customer reviewsBecause it was very popular what I did, I will analyze more than 80 million cases once more. In addition, it seems that Apache Spark was used to analyze a large amount of data, and 8 GB of the memory of 16 GB of 2016 model MacBook Pro was assigned to Spark. According to Mr. Woolf, analysis is sufficiently possible even with general PCs if enough memory is secured. By the way "(PDF file)Inferring Networks of Substitutable and Complementary Products"Based on the paper entitled Python, I wrote a simple script and gathered data.
Graph of the number reviewed for 20.36 million unique users analyzed is as follows. Almost all users fall within half of the total, 51.9% being users with review number "1" and review number "50" or less.

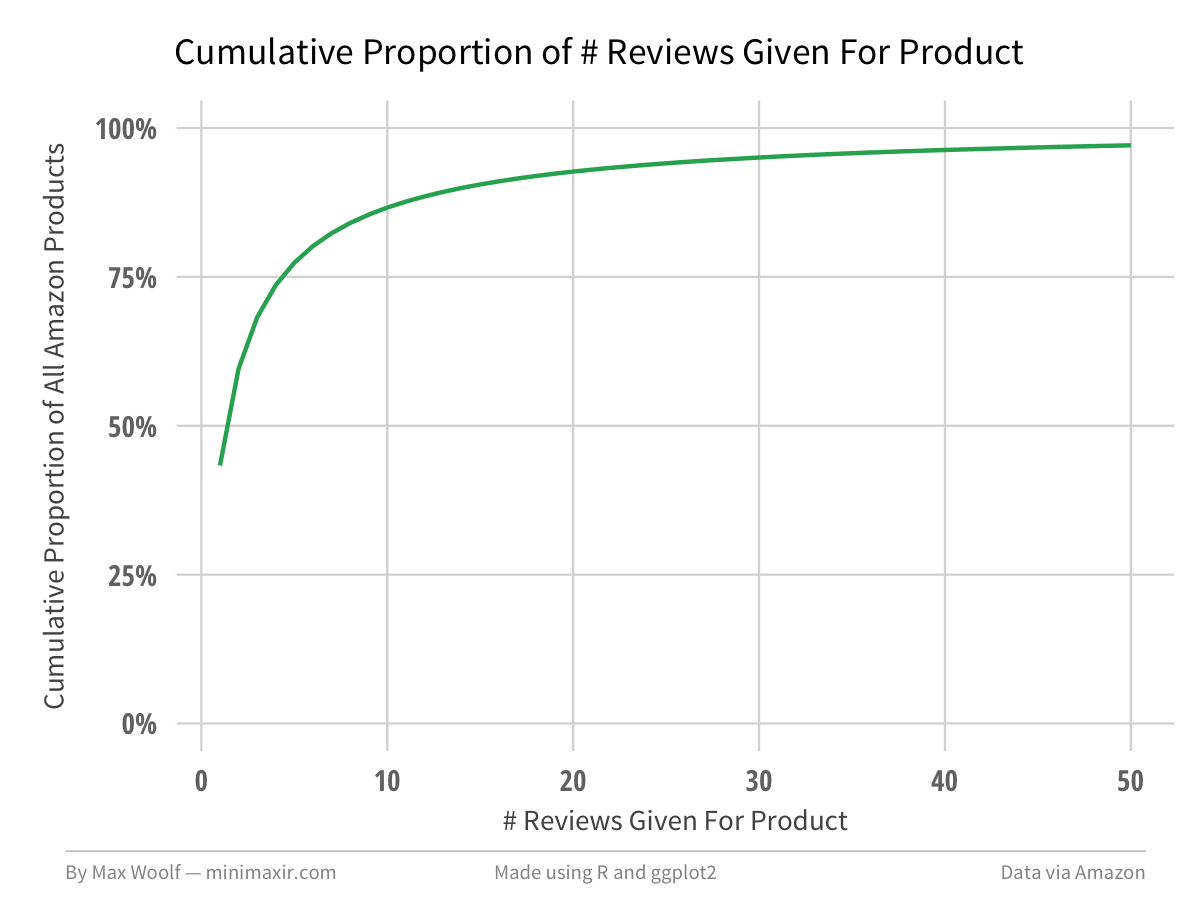
Looking at the number of reviews for 8.21 million products, 43.3% of the total is a review.
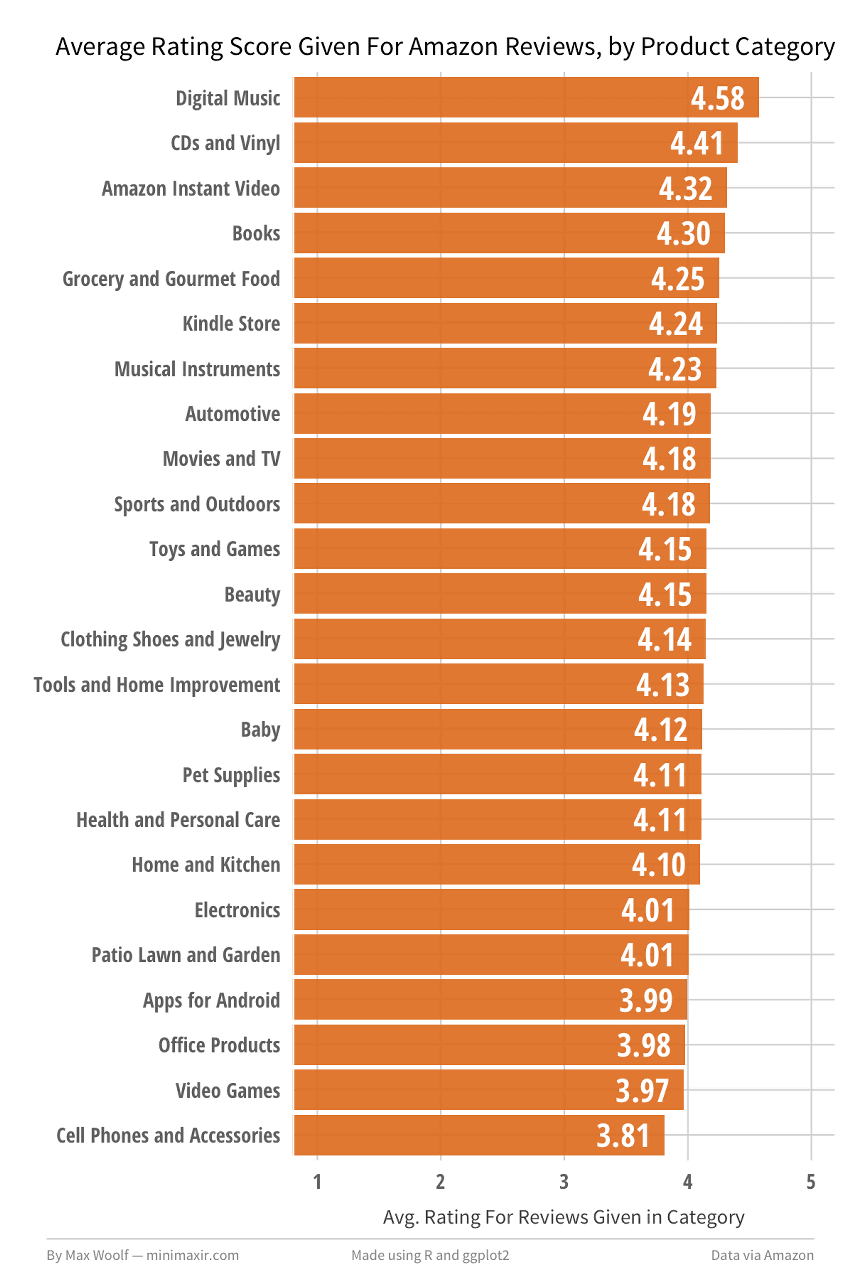
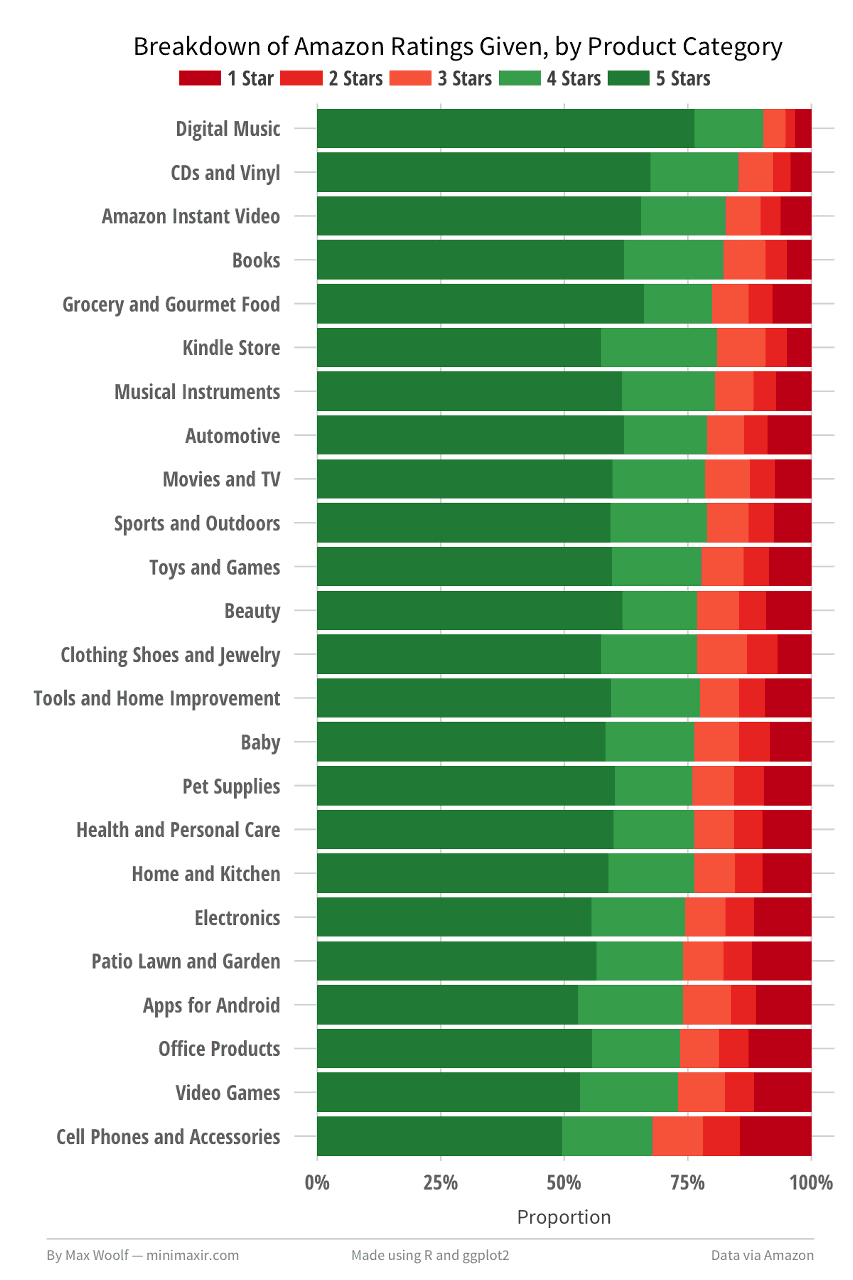
The average number of stars by genre is as follows. The highest score is "Digital Music (digital music)", the lowest is "Cell Phone and Accessories (mobile phone and accessories)". Regarding this result, "It is because natural products are not varied in quality in digital music, it is natural that evaluation is easy for favorite music, because accessories of mobile phones are greatly different in quality due to manufacturers" I pointed out.
Breakdown of stars by genre is like this. Dark green represents five stars and red represents one star.
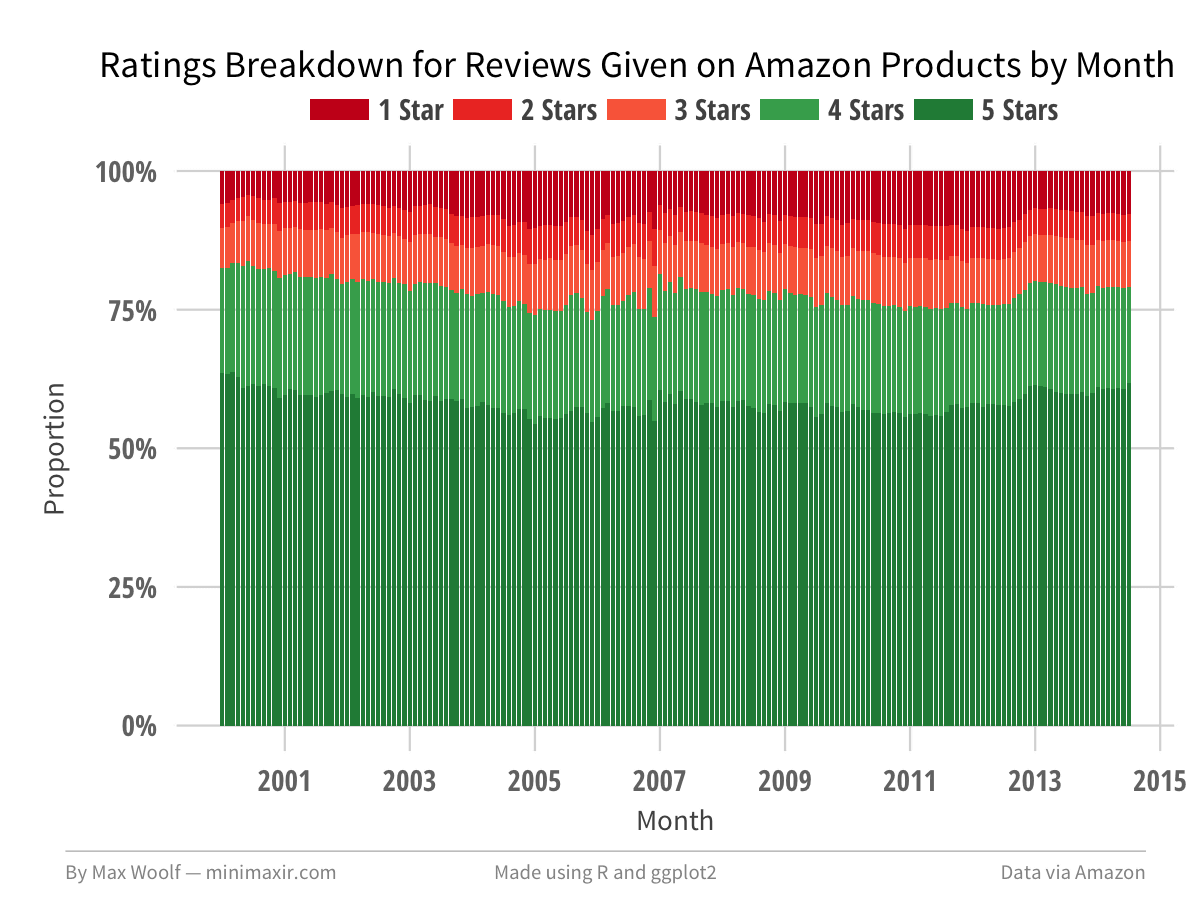
A figure showing the proportion of star evaluation with time. The proportion of five stars to one star has not changed so much over time.
For products that are rated at least 5 star stars only, this chart looks like a distribution of the average score for each item. The star's score of the whole product has become an average "4.16".

On the other hand, the distribution of star rating for each user is examined as follows. You can see that there are quite a few people who can only have five stars.

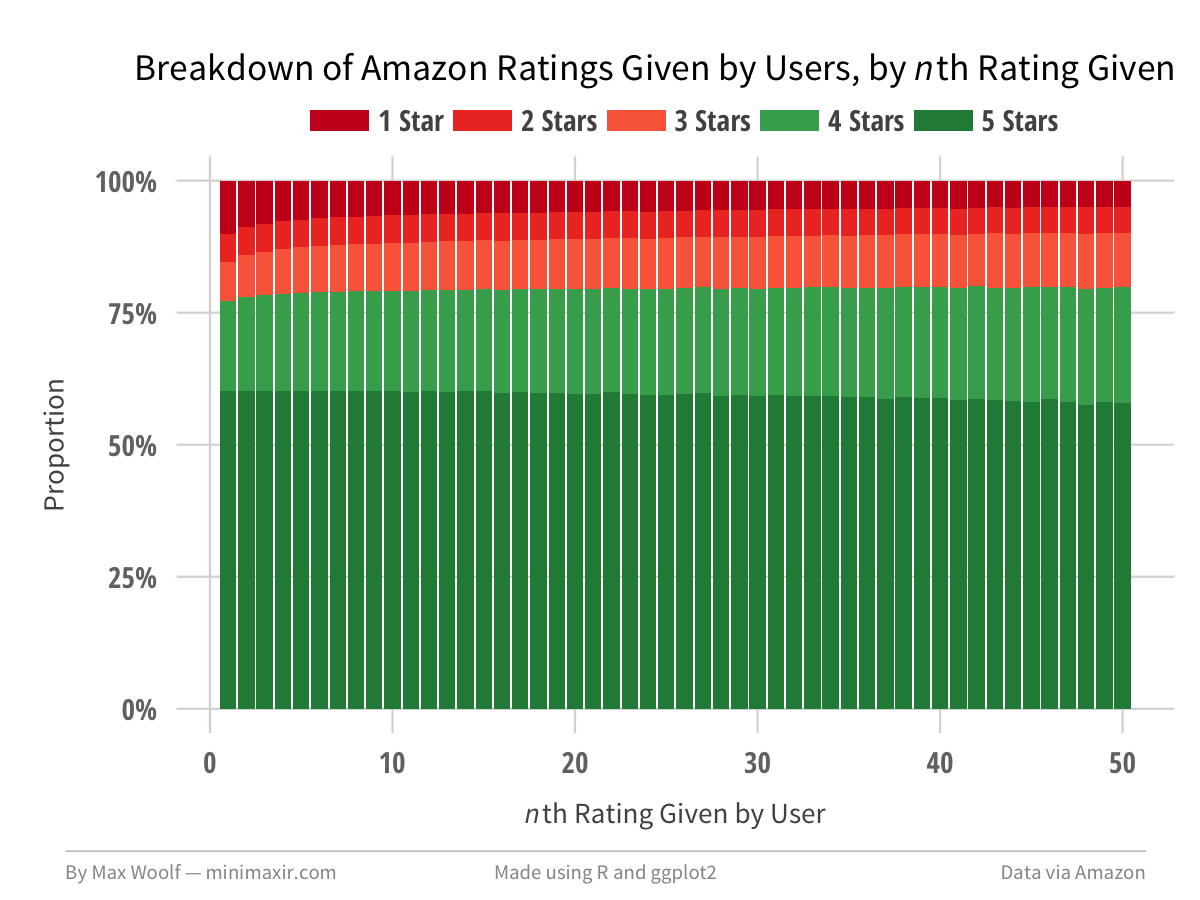
Customer reviews may be affected by past ratings. So, in order to examine the percentage of evaluation for each cumulative number of customer reviews, if you plot the number of reviews on the horizontal axis and the proportion by score of the review evaluation on the vertical axis, the proportion of the evaluation of one star And the tendency that the proportion of four stars increases as the number of evaluations increases.
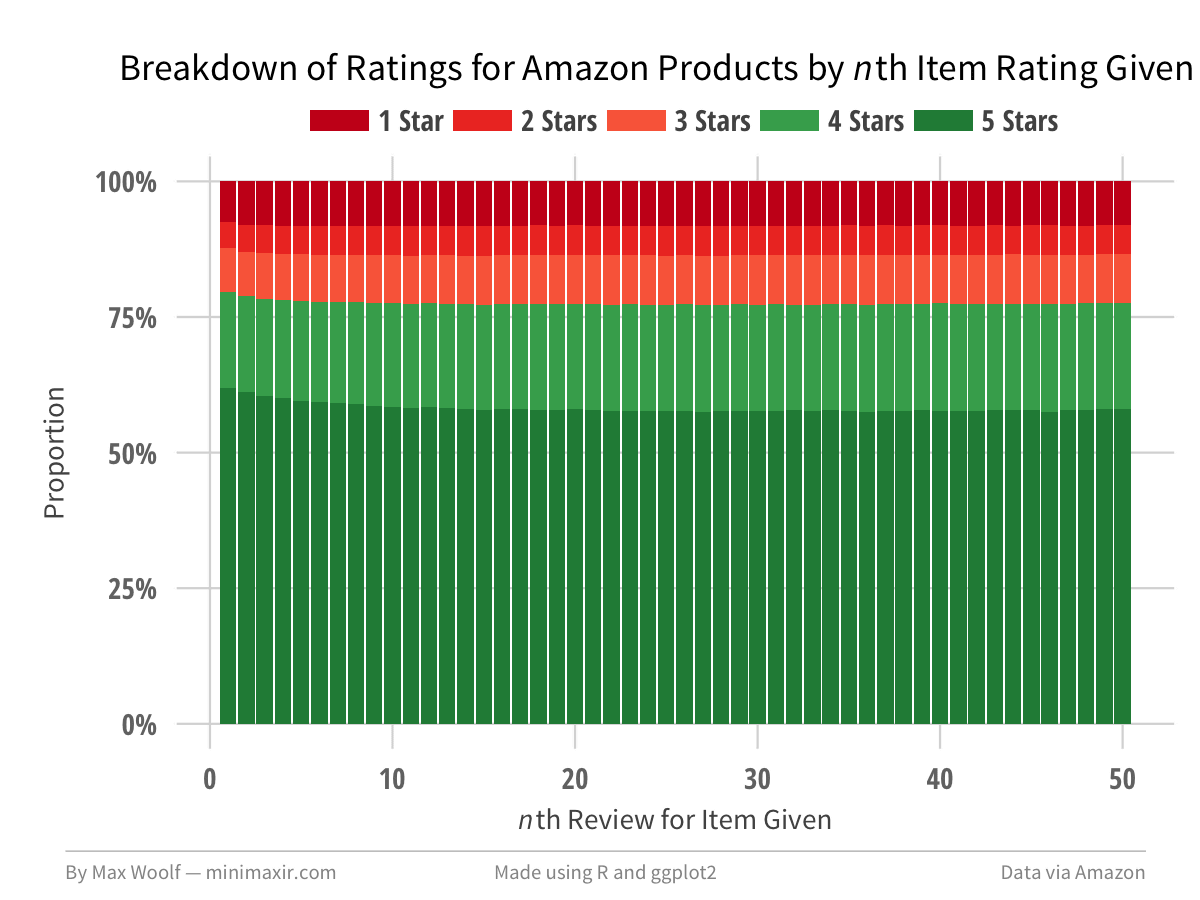
On the other hand, in order to check the proportion of the evaluation by the order of the review, the horizontal axis is the order of review and the ratio of the score is graphed like this. The first user can see that it is easy to put five stars.
Related Posts:


in Web Service, Posted by darkhorse_log