Global Footprint Network "which visualized" debtor country "or" creditor country "of the global environment
By comparing and comparing the "bio-capacity" that the original environment originally possesses and the capacity of waste to be consumed and the amount of human consumption and the amount of waste "ecological footprint", how much each region in the world is Whether it is burdening the global environment is "Ecological footprint"is. It is said that the ecological footprint of Japan is higher than the world average, and it is said that "If the world begins to live like a Japanese, the earth needs about 2.4 cores", but such an ecological · I made the footprint visually easy to understand "Global Footprint Network"Has been released.
Global Footprint Network
http://www.footprintnetwork.org/ecological_footprint_nations/index.html
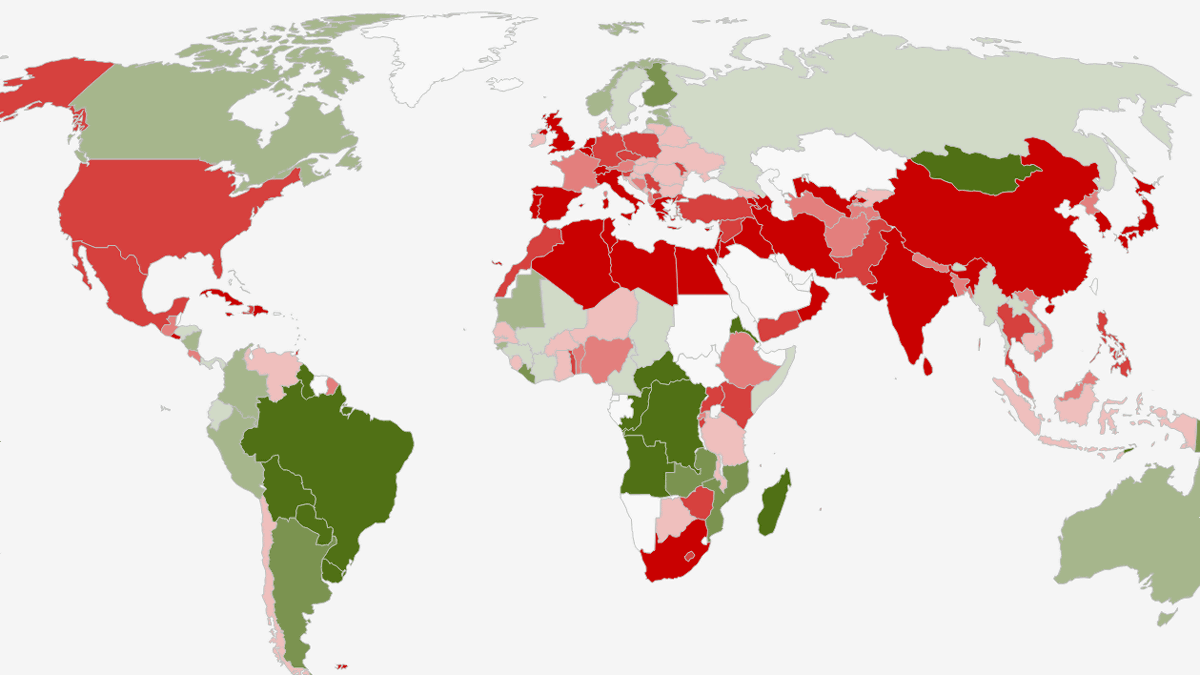
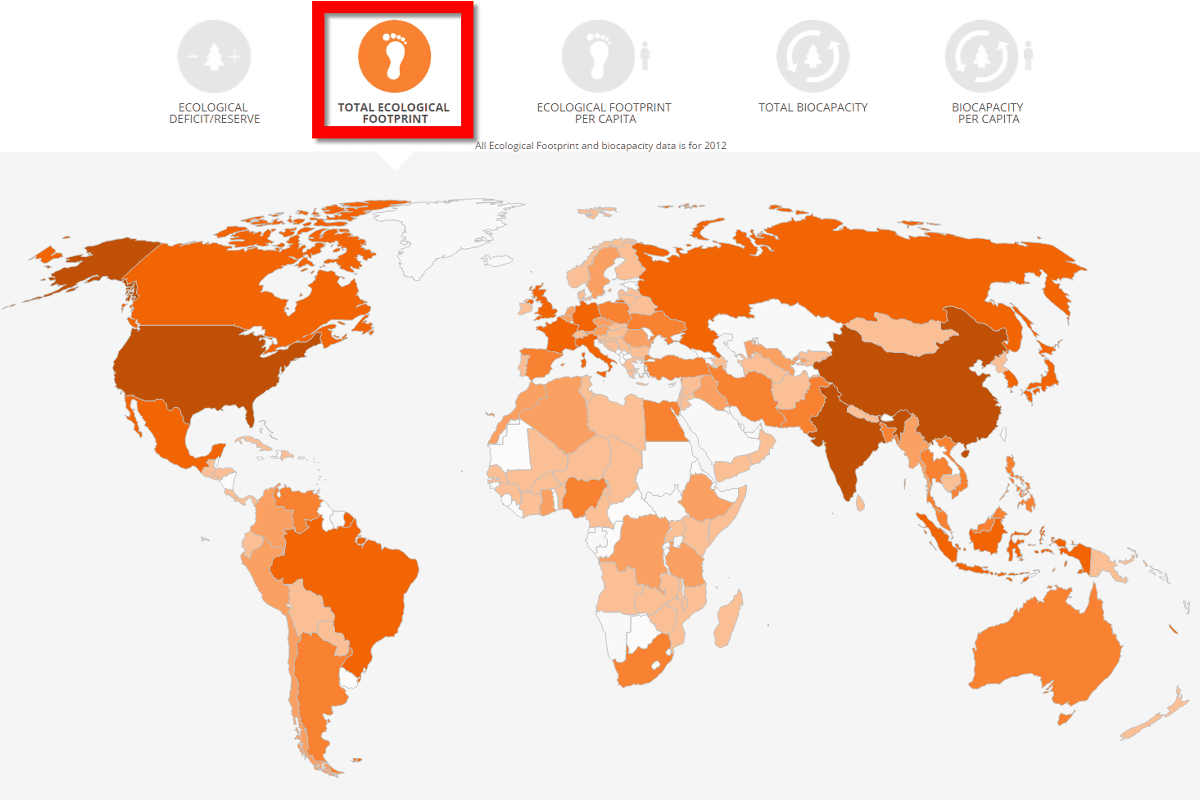
The top page of the Global Footprint Network looks like this. Each country is divided in two colors of red and green with different shades.
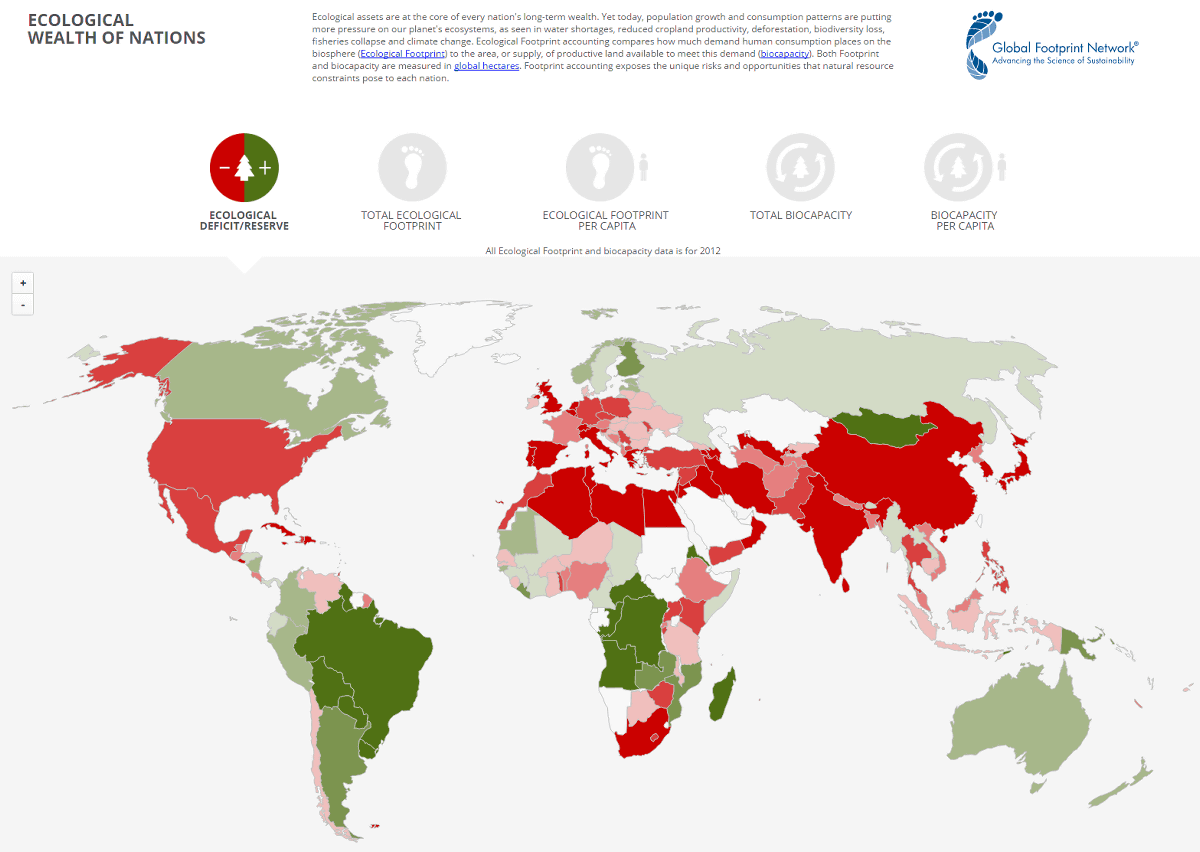
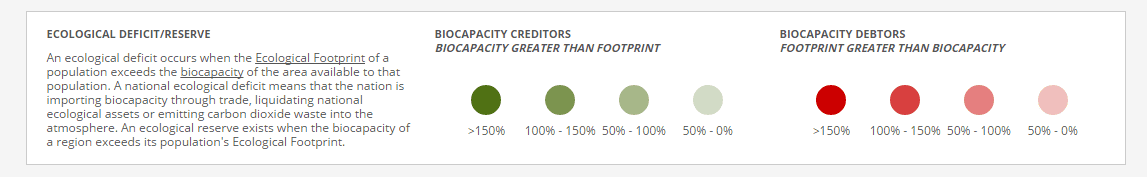
Green indicates the country in which the ecological footprint is within the bio-capacity (bio-capacity creditor country), red indicates the country where the collocative / footprint exceeds the bio-capacity (bio-capacity debtor country) . Bio-capacity Debtor countries import bio-capacity from bio-capacity creditor countries and liquidate carbon dioxide emissions and air pollution. In any country the tendency is stronger as the color gets stronger.
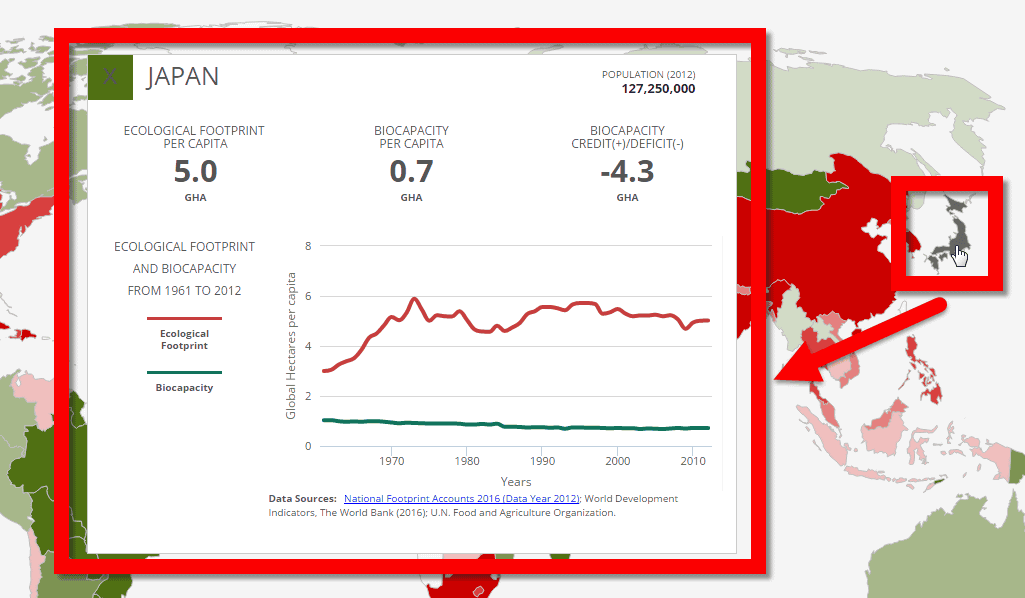
By clicking each country on the map, you can see the detailed data of that country. Looking at Japan, the ecological footprint per capita is 5.0 GHA (global hectare), the bioacapacity per capita is 0.7 GHA, and the ecological footprint greatly exceeds the bio-capacity You can see that. The bio-capacity debt is negative 4.3, and it has a considerable debt on a worldwide scale.
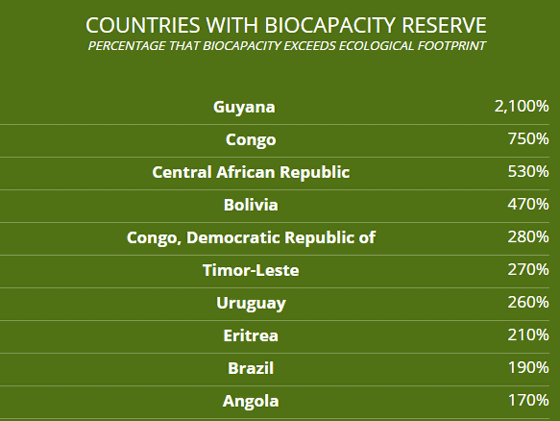
The bio-capacity creditor countries feel as follows. South AmericanRepublic of Guyana, Congo, the Central African Republic, Bolivia, the Democratic Republic of Congo, East Timor, Uruguay, Eritrea, Brazil, Angola and others.
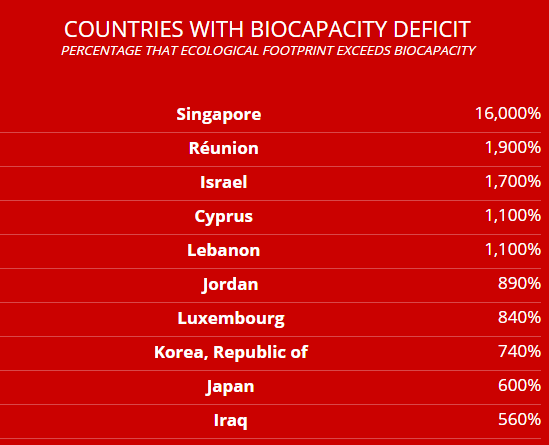
The bio-capacity debt countries are as follows. Singapore,Reunion, Israel, Cyprus, Lebanon, Jordan, Luxembourg, Korea, Japan, Iraq and so on.
By clicking the icon at the top of the screen, it is possible to make the world map a different color. In the map below, countries with more ecological footprints indicate deeper oranges.
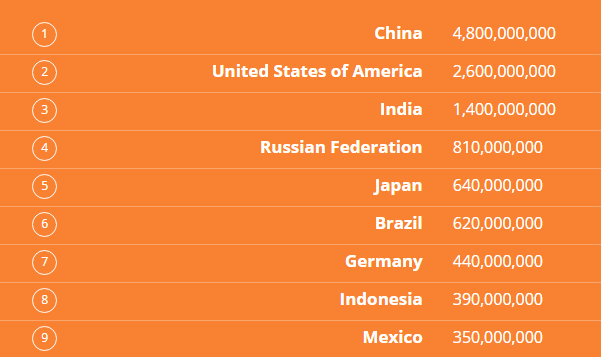
Looking at the ranking format, China, the United States, India, Russia, Japan etc were lined up.
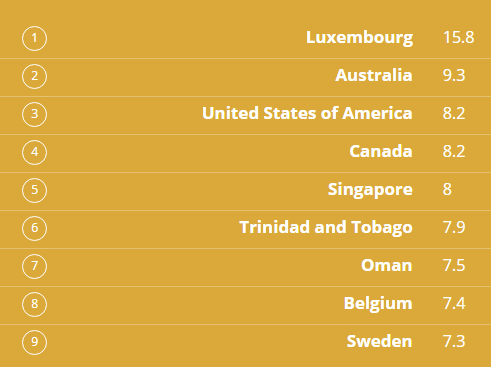
Coloring the ecological footprint by the amount per person is like this.
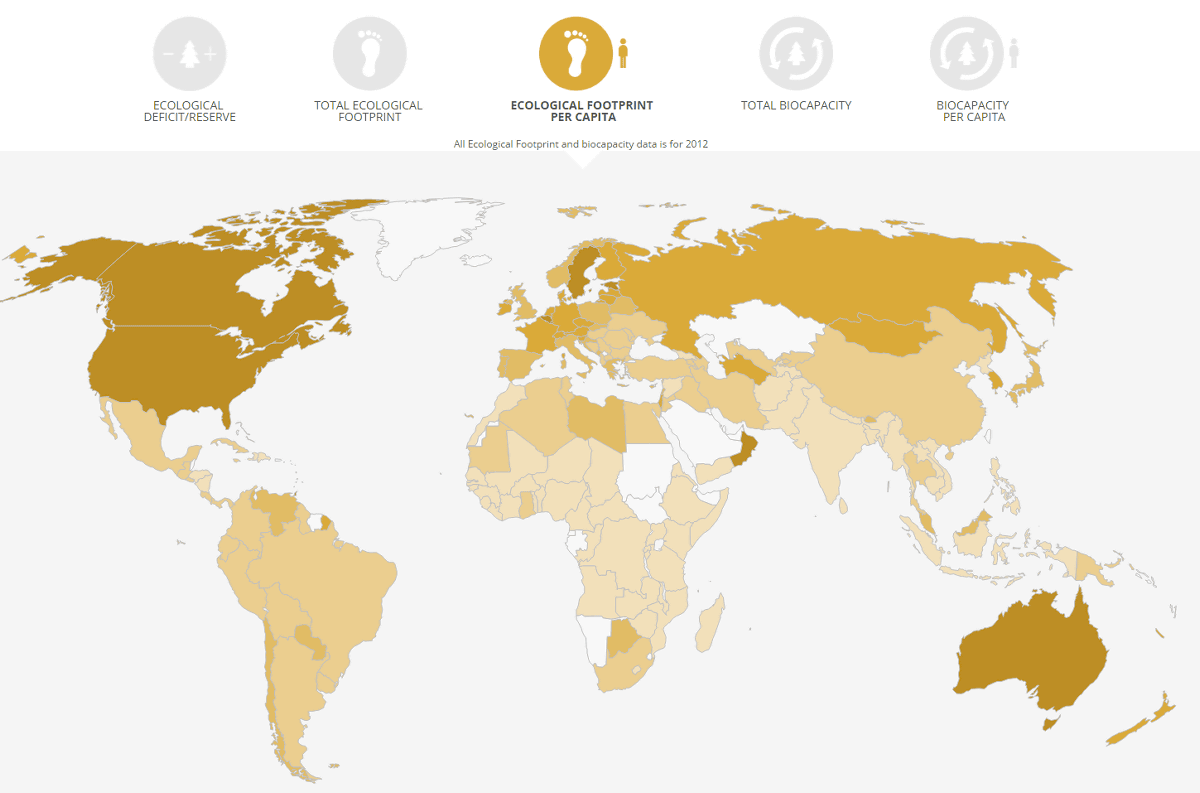
Unlike the previous one, you can see that China and India with many populations are out of the rankings. First place was Luxembourg instead of Australia and Canada ranking.
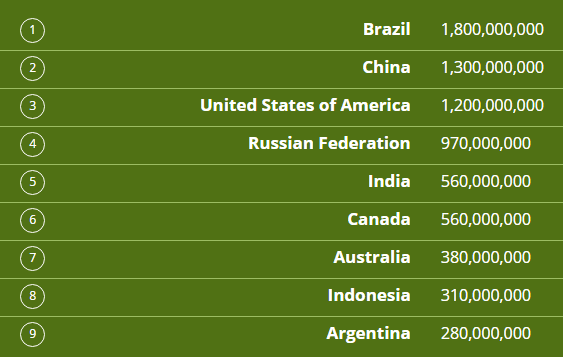
Subsequently, color coded according to the size of the bio-capacity. At first glance, countries with a large land area tend to have large bio-capacity.
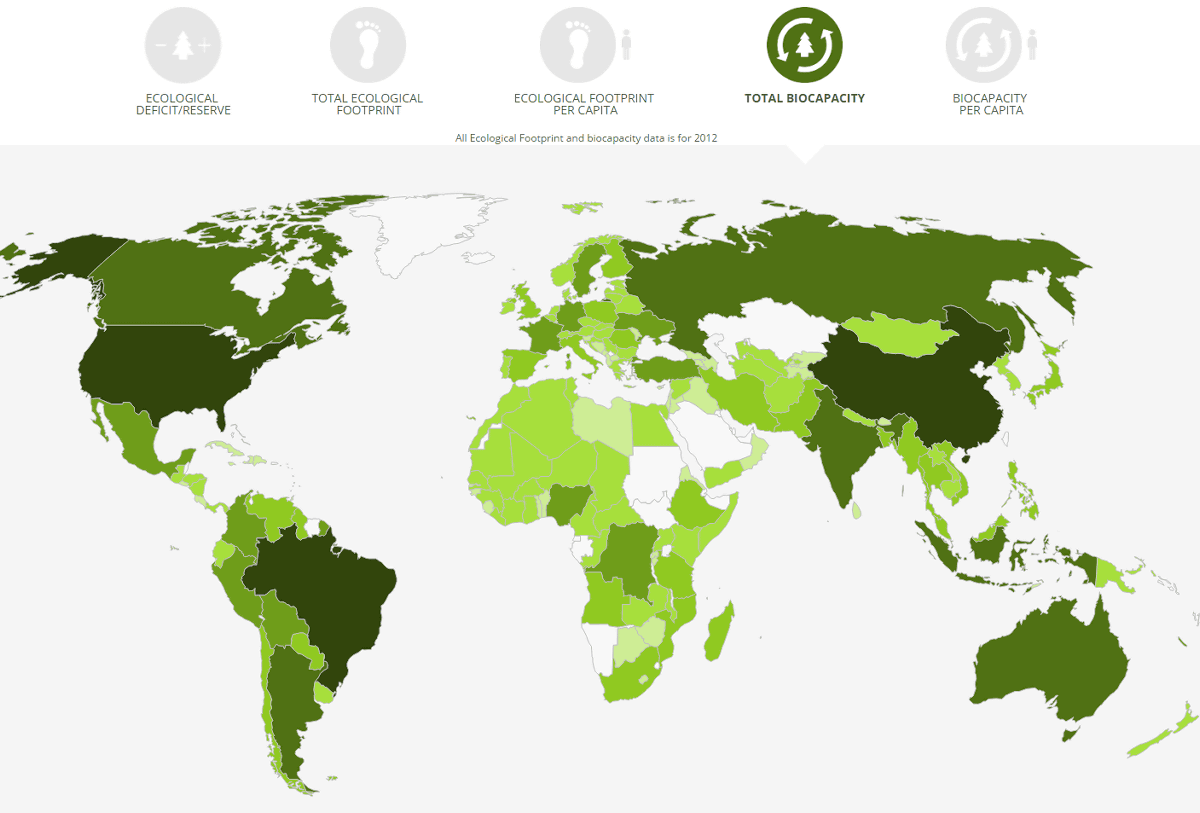
Brazil, China, the United States, Russia and others ranked even when looking at the ranking.
Coloring the bioacapacity per capita, China and India with a large population change slightly in color.
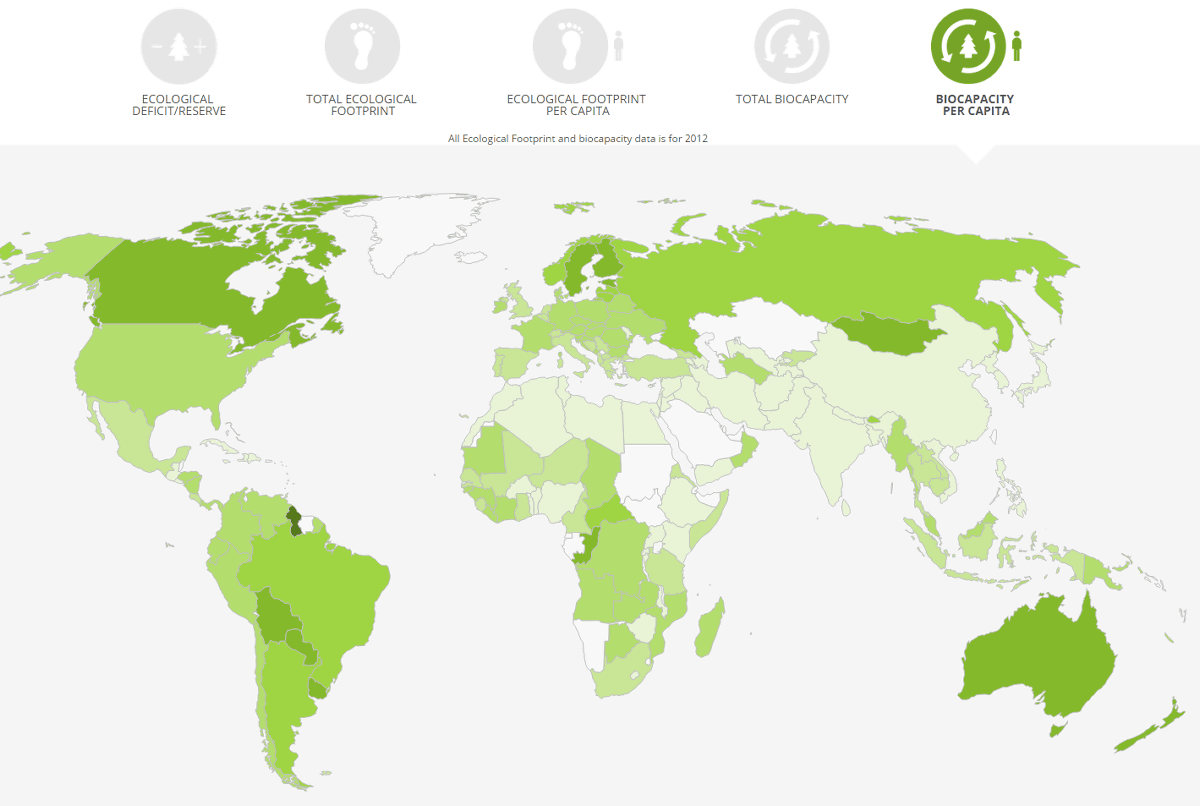
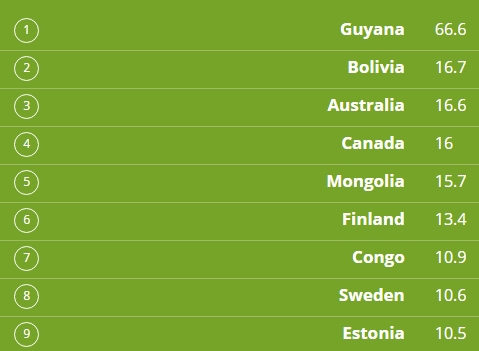
Despite being the third smallest country in South America, Guyana of Bio Capacity Credit Country is No. 1. As I looked at Wikipedia, Guyana's topography is characterized by the vast rainforest being separated by several rivers, streams and waterfalls, it seems to be a region full of nature anyhow.
Related Posts:


in Web Application, Posted by darkhorse_log