What is the result of "iPhone v. Android" benchmark confrontation found out from data of 3 million units worldwide?
ByKārlis Dambrāns
3D benchmark software corresponding to a wide range of terminals such as smart phones, tablets from PC "3D Mark"Futuremark announced the performance comparison result of the smartphone based on the benchmark result obtained from 3 million terminals worldwide in infographics.
Futuremark Press Releases - Apple vs Android insights from 3,000,000 results
http://www.futuremark.com/pressreleases/3dmark-benchmark-infographic-apple-vs-android
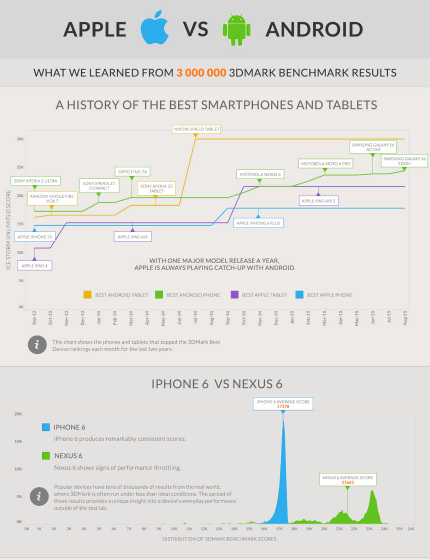
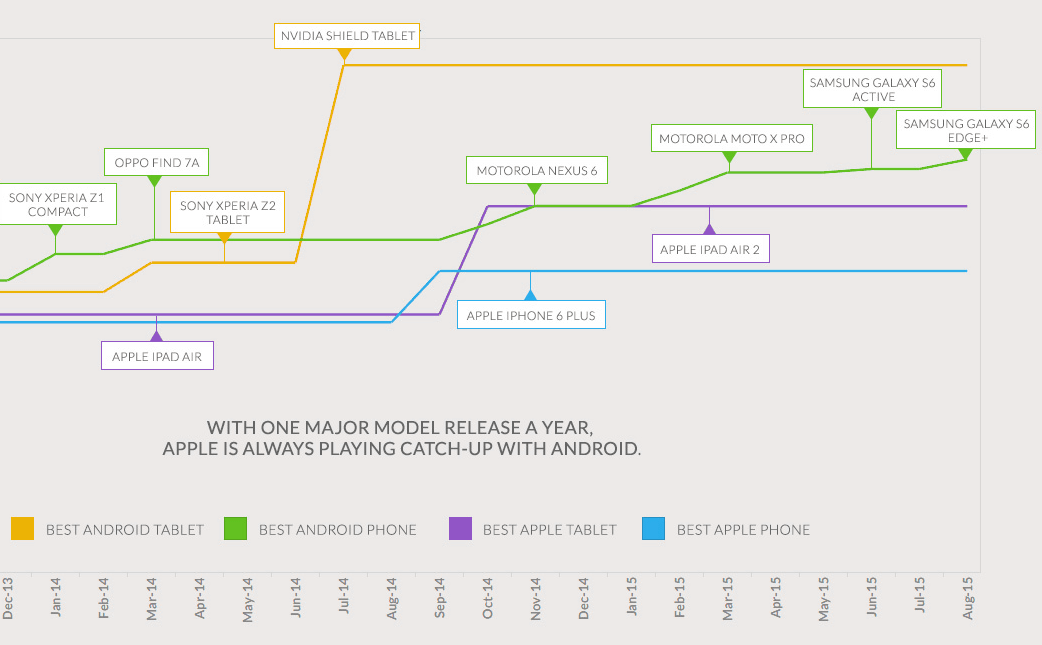
Futuremark analyzes measurement results received from users using 3DMark benchmark software "Ice Storm Unlimited" which measures the performance of CPU and GPU. In graphics, graphs plotting the results over two years from September 2013 to August 2015 are drawn first. In the graph, the vertical axis shows the highest score and the horizontal axis shows the flow of time, the orange line shows the transition of the Android tablet, the green is the Android terminal, the purple is the iPad series, and the light blue is the iPhone series score transition It is.
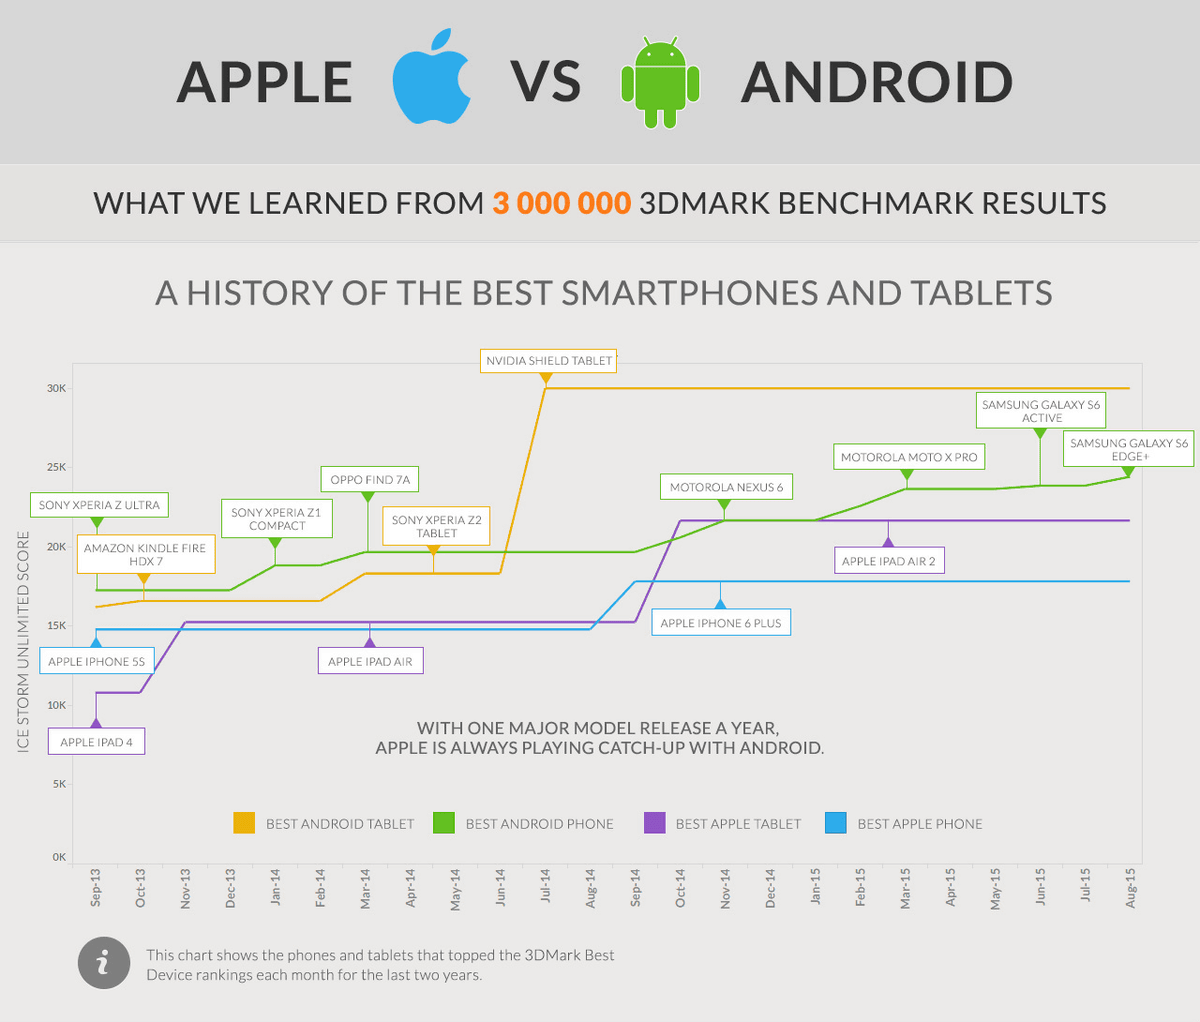
First of all, the jumping up of the performance of the Android tablet indicated by the orange line is to jump into the eye. It was released in July 2014NVIDIA SHIELDIt is due to the missing ability of the player, its score is about 30,000 points. It is an Apple tablet machineIPad Air 2You can see the state that it is running a top with a big difference to about 20,000 points of the top.
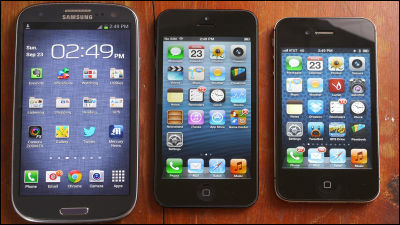
Looking at smartphones, the top in August 2015 will be equipped with a 5.7 inch displaySamsung Galaxy S6 Edge +(Japan not yet released), about 25,000 points. One iPhoneIPhone 6 PlusAlthough it shows the best performance, the score is about 16,000 points and it can be understood that Android terminal is also greatly drained water. In addition, the performance of Android devices has been improved frequently, whereas the iPhone / iPad only improved significantly in September and October 2014. This is, of course, due to the appearance of iPhone 6 and iPad Air 2, the characteristics of the development environment of both camps are well manifested.
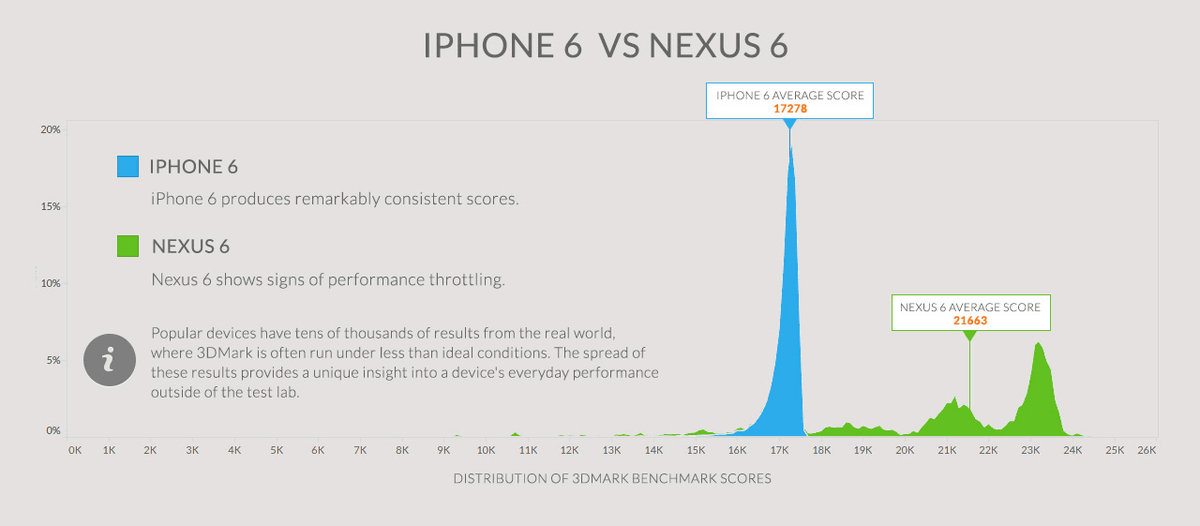
Next, iOS and Android's reference machine confrontation, iPhone 6 andNexus 6Compare. The average score isAround 17,000 pointsCompared to the iPhone 6 concentrating on, Nexus 621 thousand pointsAnd while it shows high numerical value, it shows that many variations occur. This is considered to be due to individual differences such as installation situation of applications and operation status of resident apps, and in some cases it is also interesting that solids with performance deteriorated as iPhone 6 is below. It seems to be said that the character of the stable iOS and Android OS greatly influenced by customization appears well.
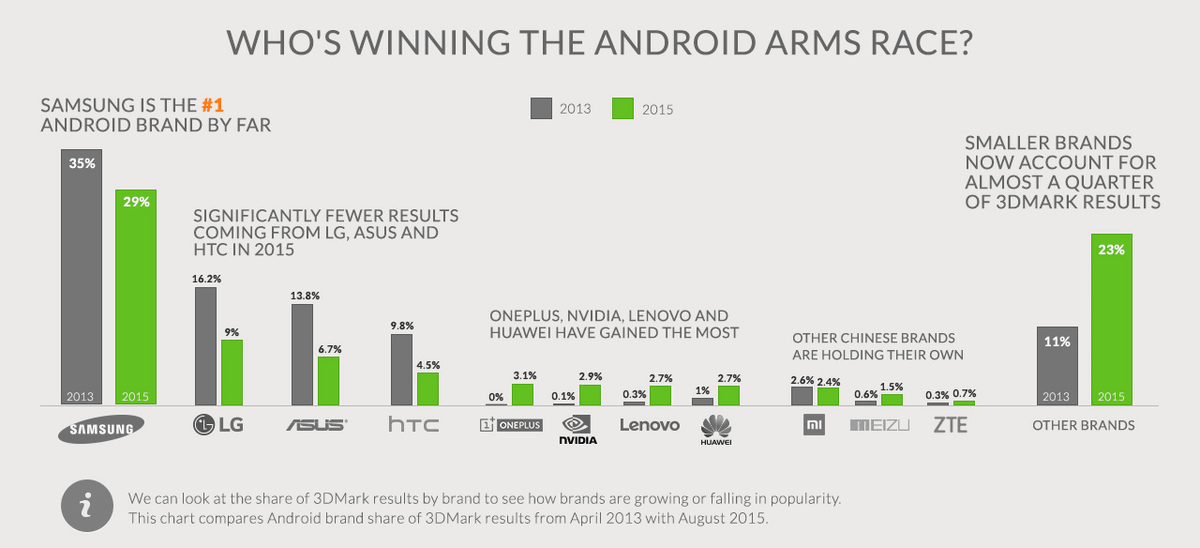
Looking at the share by brand in the Android terminal, as of 2013, it is in line with Samsung, LG, ASUS, HTC from the top. The top four will not change even as of 2015, but on the other hand, it turned out that the four companies dropped their share in two years. LG, ASUS, htc has fallen at levels that can be said to be almost halved. Meanwhile, it is also interesting that manufacturers such as NVIDIA, Lenovo and Huawei are increasing the market share, and the market share of small and medium-sized brands including these are about doubled.
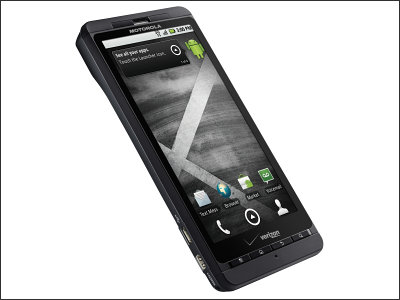
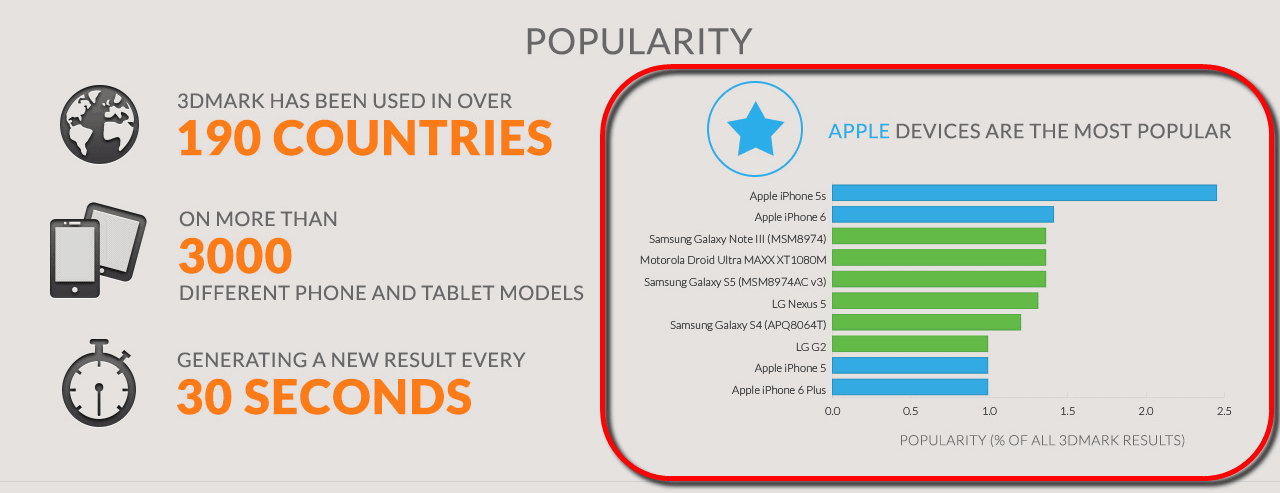
The share of Apple products including iPhone 5s, iPhone 6,Galaxy Note 3, Droid Ultra MAXX XT (Japan not yet released),Galaxy S5, Nexus 5 and so on, I know that Apple products, especially iPhone 5s, have a market share that has fallen.
From Apple, at the end of September 2015IPhone 6s and iPhone 6s Plus, And in November12.9 inch display iPad ProThere is a concern about the measurement result as to how much it is recovering with respect to the Android machine as it appears.
Related Posts: