When you visualize how fragmented the Android terminal in the world is, it becomes like this
Service of visualizing mobile communication quality on a mapOpenSignalBased on information obtained from 680,000 terminals, we have created infographs that can understand how much Android terminals are subdivided by one shot this year. According to it, apparently it seems that the details (fragmentation) has progressed in 2015 more than in 2014.
Android Fragmentation Report August 2015 - OpenSignal
http://opensignal.com/reports/2015/08/android-fragmentation/
◆ Terminal fragmentation
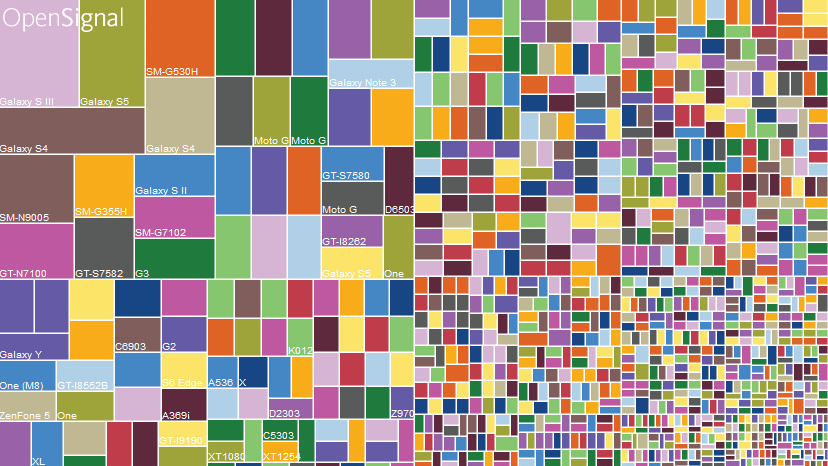
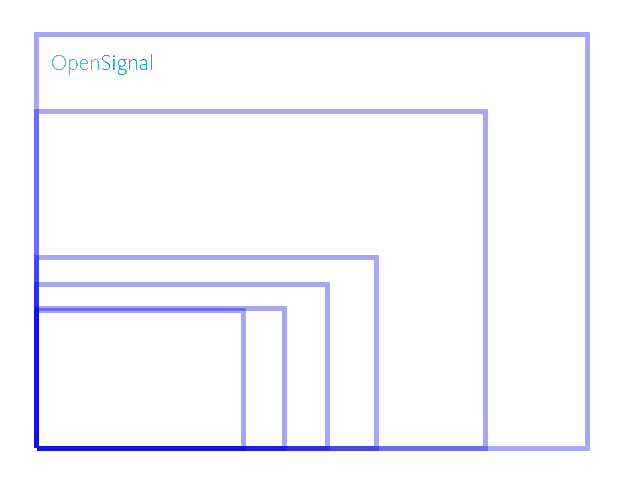
This is the 2015 version of the infographic "Device Fragmentation" which lists the number of Android terminals used around the world as an area. From the top left to the bottom right of the figure, terminals with large market share are displayed as rectangles. There are 20,4093 kinds of Android terminals detected in 2015 version.
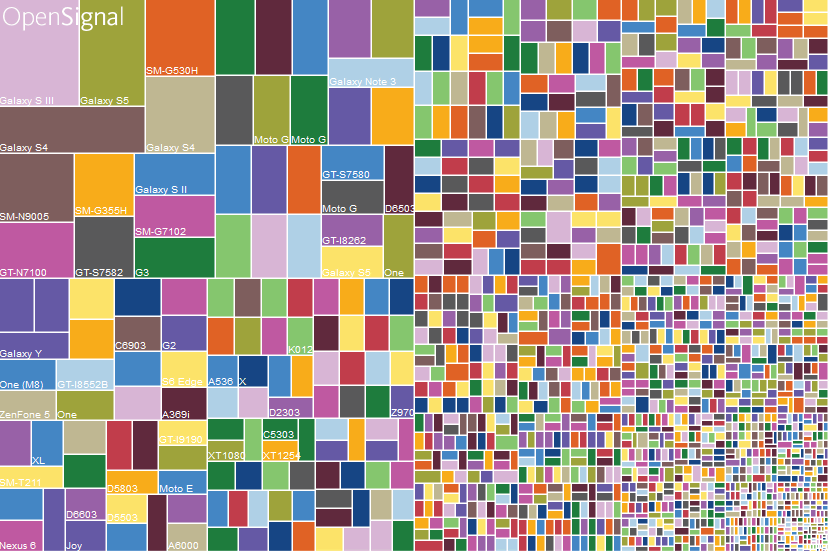
On the other hand, this is the same graph as the 2014 version. Since it was 18,769 types as of 2014, you can see that the fragmentation of the terminal increased by 28% in one year.
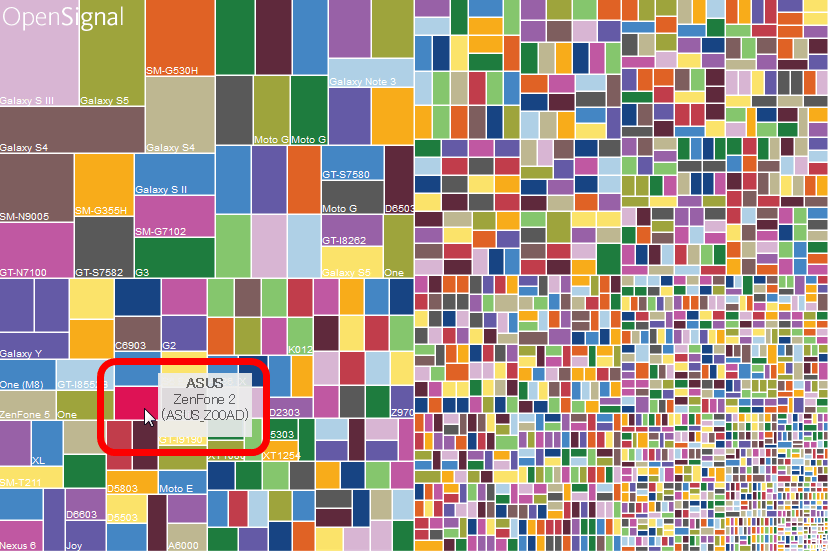
On the OpenSignal page, you can display the type of the terminal by placing the mouse cursor on the infographic graphic, so you can understand somewhat whether the terminal you are using is selling or not.
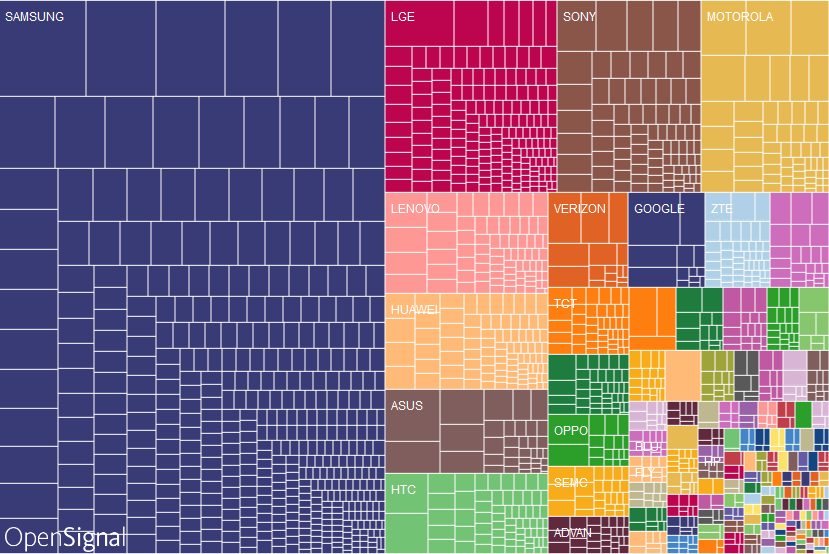
◆ Manufacturer share
"Brand Fragmentation" displays smartphone makers according to their share. Although Samsung is crying for a decline in market share, we can see that it has an overwhelming share of 37.8%. As the top brands in 2014 were Samsung, LG, SONY, Motorola, Huawei, Lenovo, TCT, MicroMAX, you can see the momentum of ASUS that made a breakthrough in the data of 2015 in the data of 2015. In addition, the number of manufacturers that first appeared in 2015 was 1294 companies.
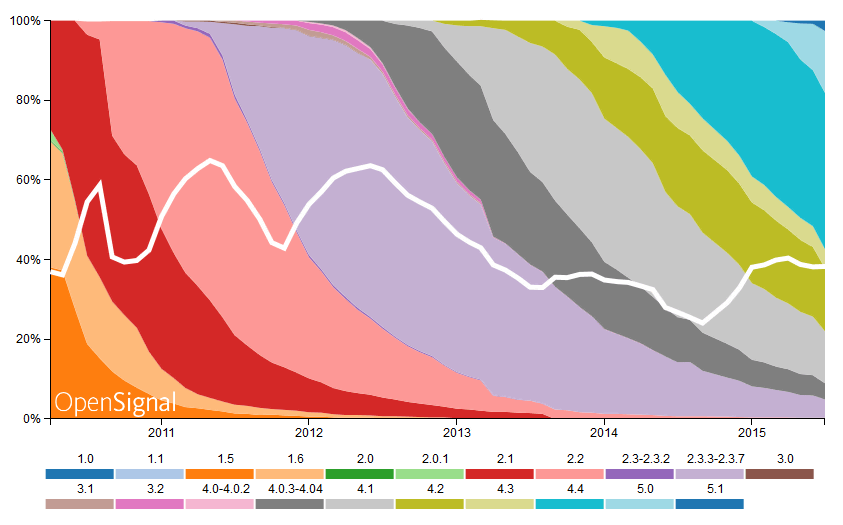
◆ OS version share
"Android Operating System Fragmentation" shows the share by version of Android. Android 5.0 / 5.1 (Lollipop) is increasing rapidly, but Android 4.4 (KitKat) is still the top in share.
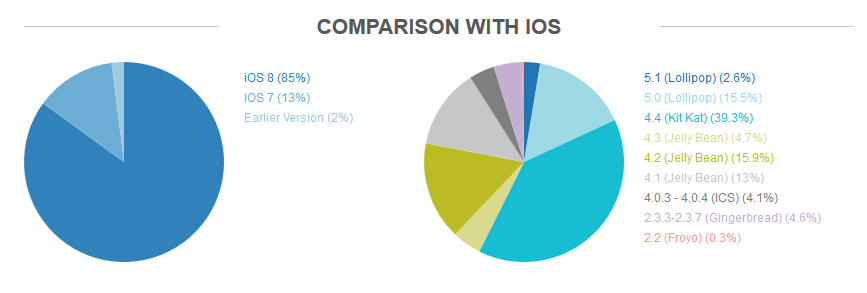
When comparing the version of iOS (left) and the version of Android (right), it is obvious that Android is more subdivided.
◆ Screen Size
"Screen Size Fragmentation" shows the segmentation of the screen size of the smartphone / tablet. Again, the screen size increased in 2015, but the maximum size is 21.5 inches of HP Slate 21.
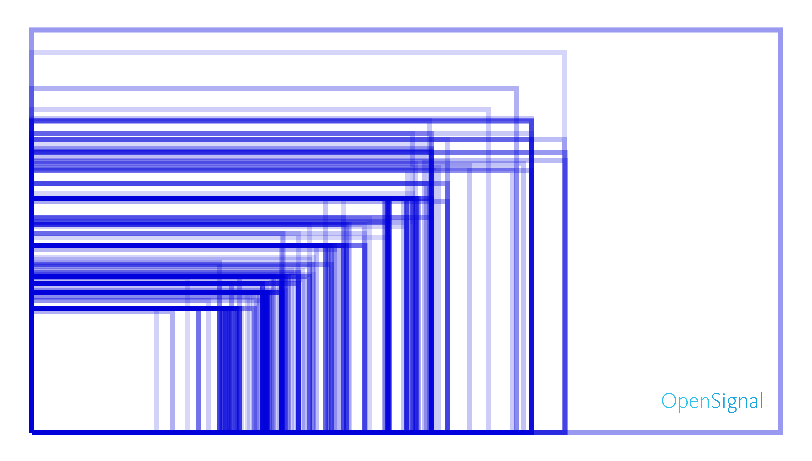
On the other hand, iOS has only 6 screen sizes.
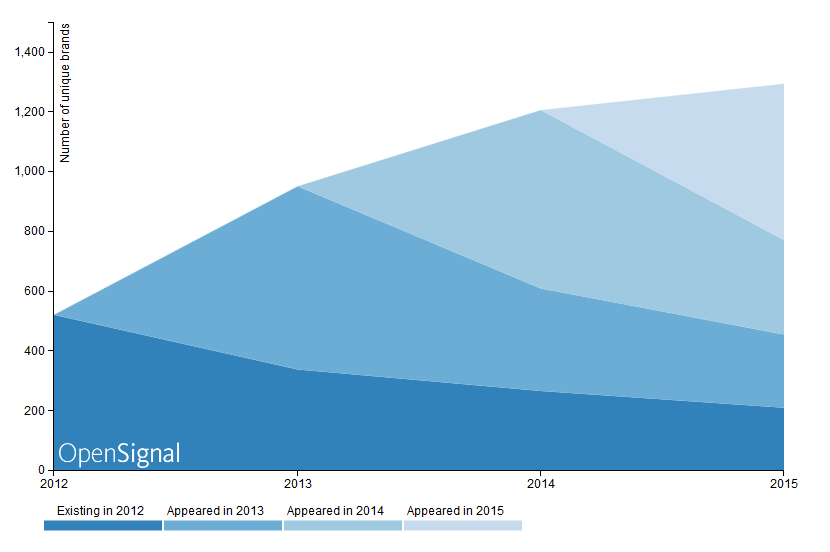
Number of terminal makers
Graph of the number of manufacturers who newly started manufacturing the Android terminal looks like this. Although the number of makers continues to increase as the number of manufacturers entering exceeds the number of manufacturers withdrawing, you can see that the rate of increase is slowing down.
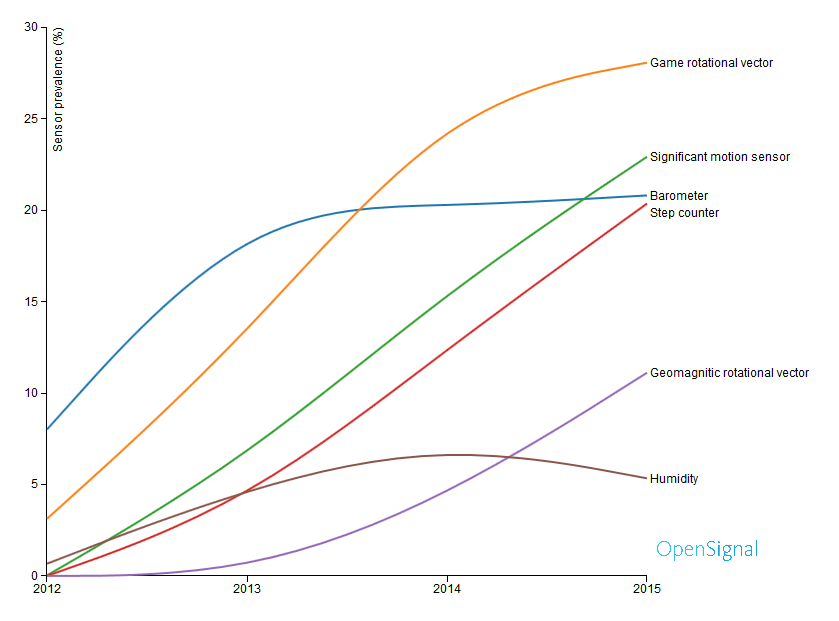
◆ Sensor
It is like this when charting sensors installed in Android terminal. It is the motion sensor, the pedometer, the acceleration sensor which are rapidly increasing, and the humidity sensor is decreasing trend.
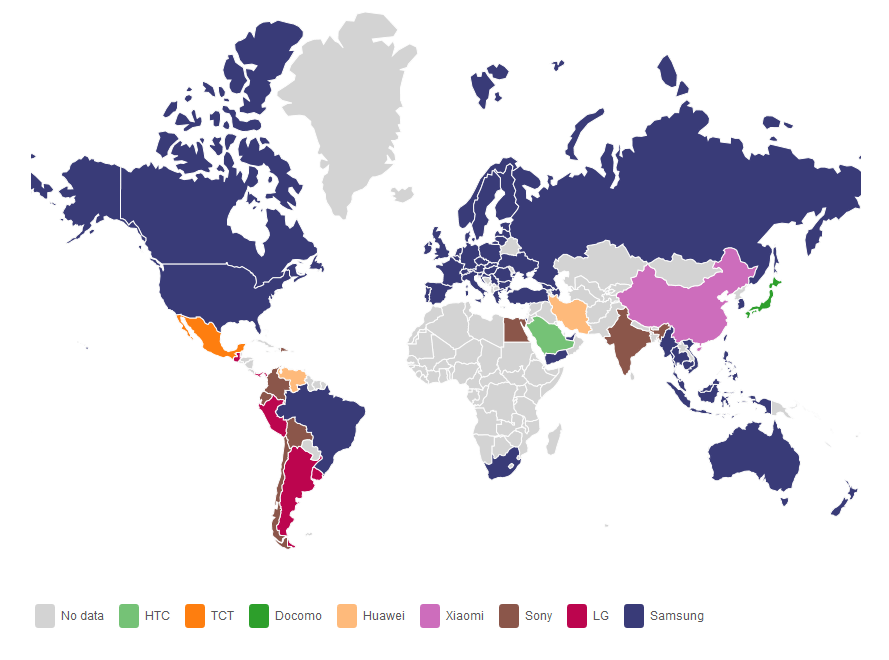
◆ Share by country
It is like this when separating country top manufacturer's top. Blue is Samsung's top share region, which shows that it dominates all over the world such as North America, Europe, Oceania. Xiaomi in China, SONY in India, HTC in Saudi Arabia has won the top share. Since the top share of green Japan is "NTT docomo", it seems that you can not investigate smartphone manufacturer correctly.
The Android terminal revealed fragmentation advanced in all fields more than 2014 years. However, since the diversity that we respect must inevitably lead to the difficulties of the application developer, it seems to be said that it can be an obstacle to obtaining excellent content.
Related Posts:

in Hardware, Software, Smartphone, Design, Posted by darkhorse_log