You can observe the state of rain clouds on the earth level with animation, "Forecast" as you can see the movements of the typhoon in hand
It is common to worry about weather movements and forecasts such as typhoon season, heavy rain, when heavy snow is expected, when traveling abroad and so on. Various applications that can see the movement of clouds are now released even with smartphone applications, but we can observe the movement of rain clouds at the global level on PC and smartphone browsers, weather movements around seven days in the front and back The site that can confirm the forecast is "Forecast"is.
Forecast
http://forecast.io
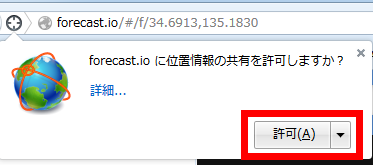
Forecast is a site that can be used without the need to register an account. At the time of initial access, I will ask if I will provide current location information, so click "Permit". In addition, since it is not always necessary to do so, people who care about privacy are OK even if you choose "Do not allow" or "Ignore this time".
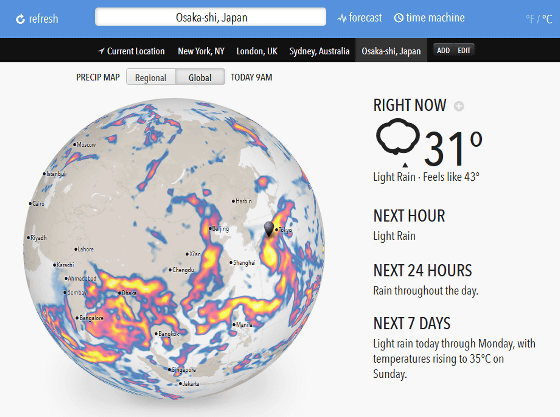
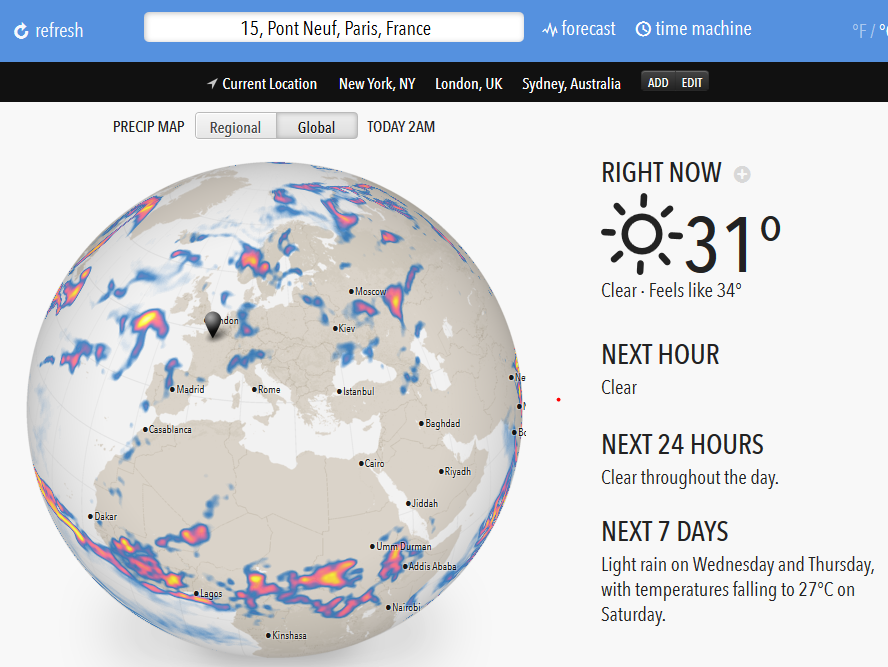
The top page of Forecast was displayed. On the screen, maps of the Earth around the Asian region, the current climate and temperature, and forecasts after 1 hour, 1 day, and 1 week are written in English.
When looking carefully, the display of the temperature is displayed as Ka, so the tremendous temperature is displayed. Since there is a unit change button on the upper right of the screen, click it.

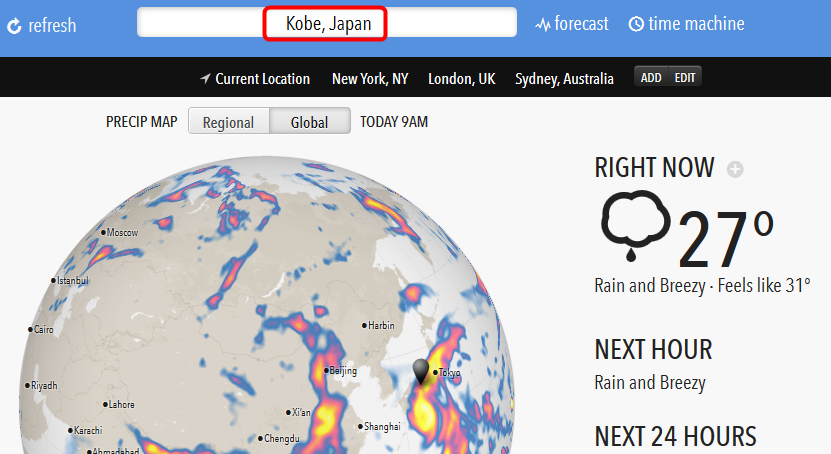
I was able to change to the temperature display in Mr. Se.

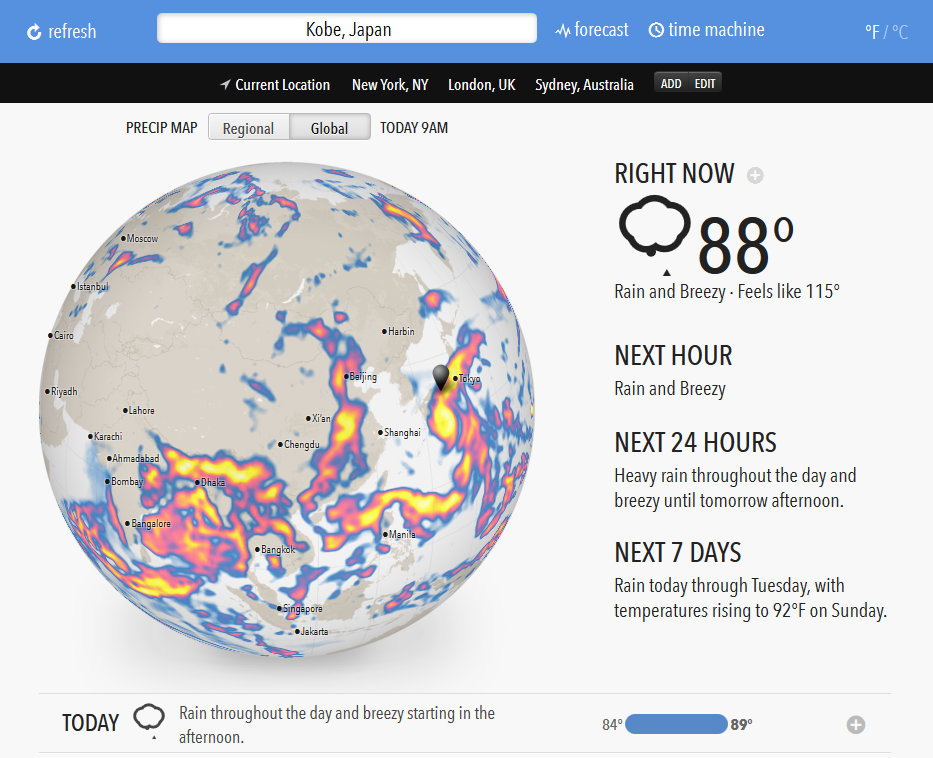
At the top of the screen, the approximate location determined from the IP address etc. is displayed, and the weather and temperature at this point are displayed. You can also enter the place name yourself here, so you can check the weather in the place you care.
Try entering "Paris" for a while and hitting Enter, the weather in France and Paris and a map centered on Europe were displayed.
Also, it is also possible to register frequently used items. In the initial state, America · New York, England · London, Australia · Sydney are registered. Click "ADD" or "EDIT" to register your favorite places.
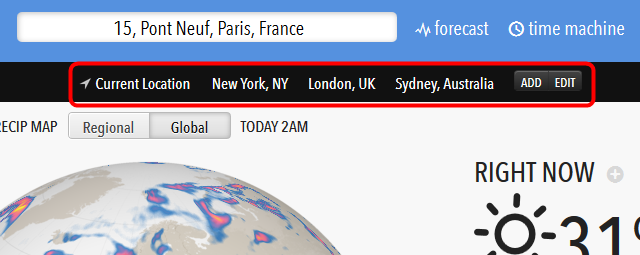
In this way, when you click "ADD" with the point you want to register displayed ......

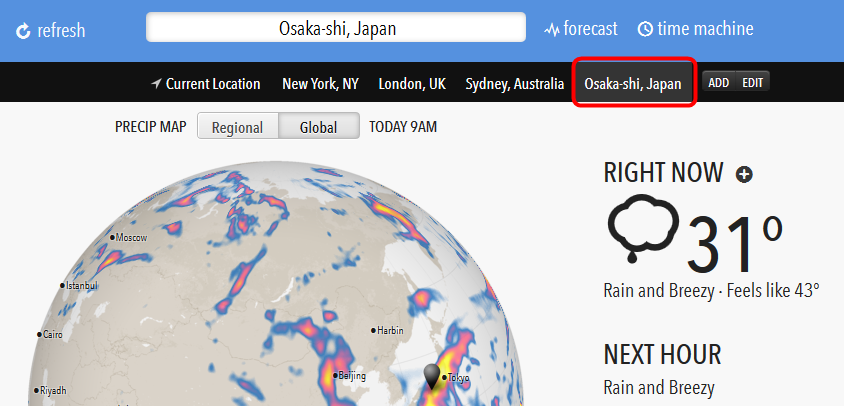
The desired spot name was added to the bar section.
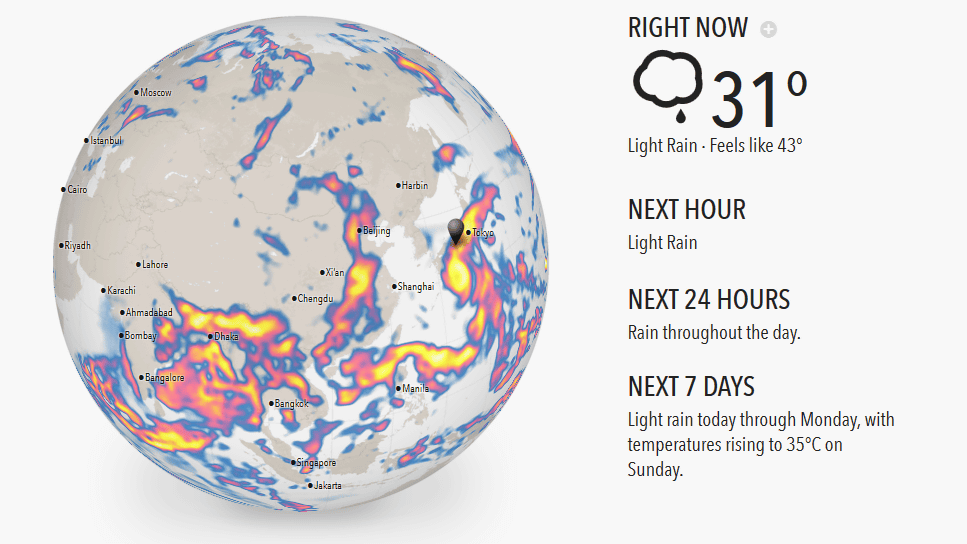
On the left side of the screen, a map showing the state of the whole earth including the selected area is displayed, and the current weather, temperature and sensible temperature are displayed in "RELE Like" in the "RIGHT NOW" portion on the right I will. Below that there was displayed "NEXT HOUR (1 hour later)", "NEXT 24 HOURS (after 24 hours)" and "NEXT 7 DAYS (7 days later)", forecasts at each timing.
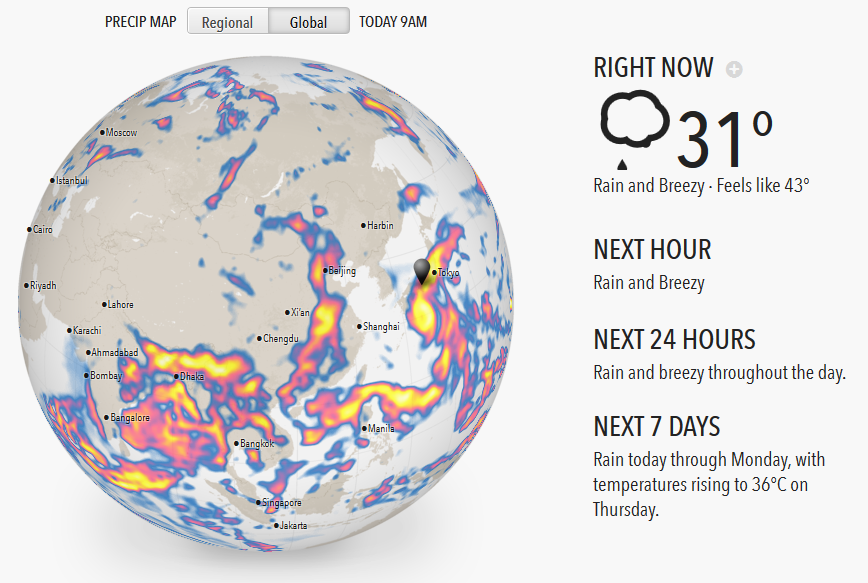
"Rain and wind", "Rain and wind throughout the day" and "NEXT 7 DAYS (7 days later)" for "NEXT HOUR (one hour later)" and "NEXT 24 HOURS Rain from today until Monday, the temperature will rise to 36 degrees on Thursday ".

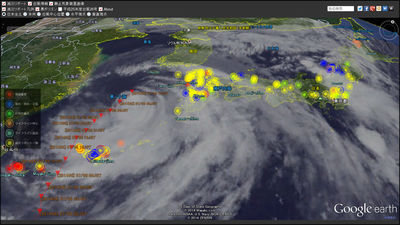
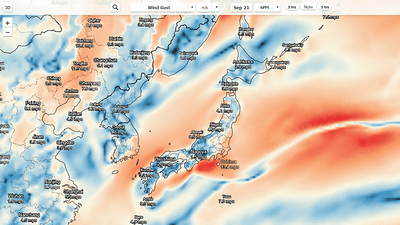
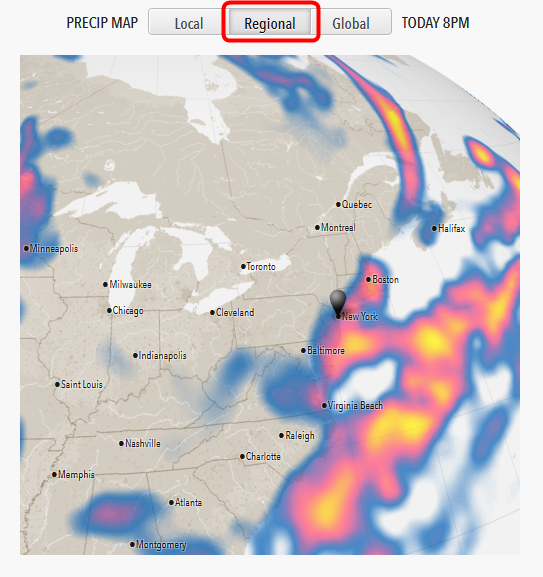
In the map, "Global" is selected in the initial state, but you can zoom in by selecting "Local". As the timing when typhoon 11 was closely approaching Chubu, Shikoku, Kinki region around 20 o'clock on July 16, 2015, the screen is tough.
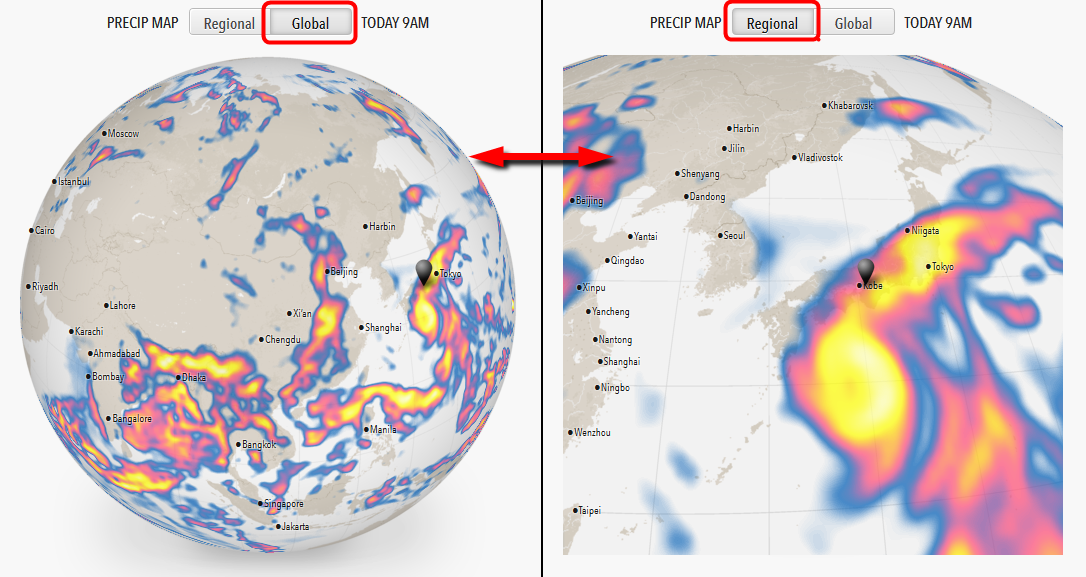
Depending on the location, you can also select "Regional" and see the intermediate map between "Global" and "Local".
And the main feature of this "Forecast" is the ability to reproduce the movement of rain clouds with animation. When clicking the "CLICK TO LOAD ANIMATION" at the bottom of the map or the replay icon on the top right, the change in precipitation for one week before and after the current time will be played back on animation on the map. The blue, red and yellow moyamoya displayed on the map is where rain is falling, and yellow is particularly the point where rainfall is particularly high.
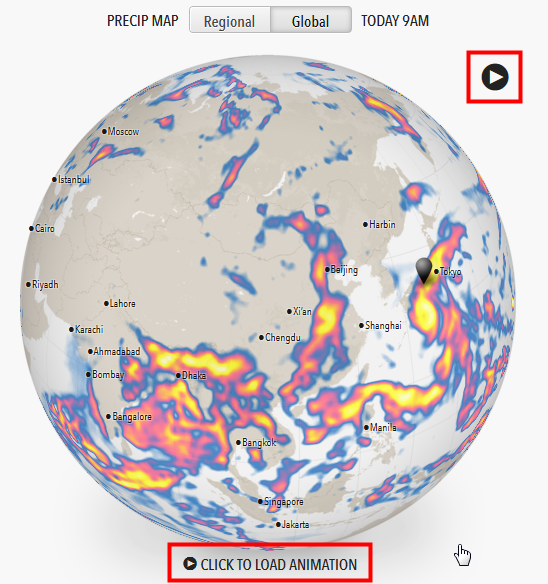
You can see how the actual animation was displayed in the following movie.
I tried to animate the movement of rain clouds at the global level in "Forecast.io" - YouTube
Below the map, the weather forecast for 7 days and the expected temperature are displayed one day at a time.
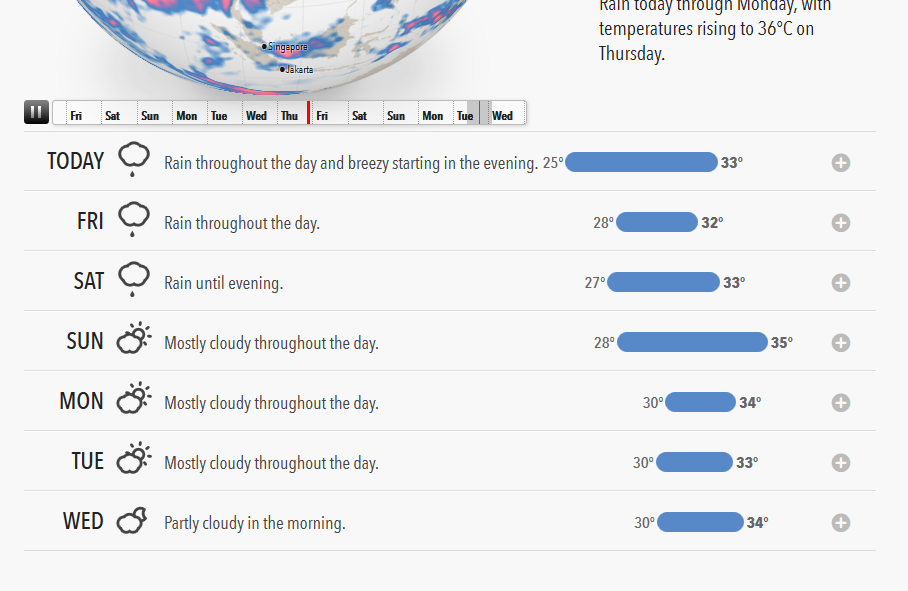
By clicking the "+" icon on the right side of the screen, you can check details of each day.
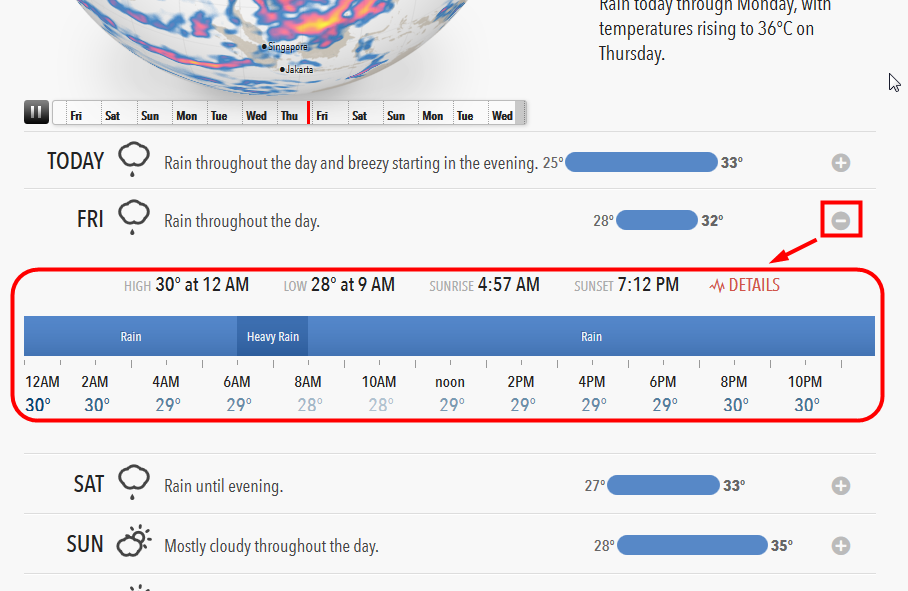
Under the weekly weather forecast, graphs are displayed to forecast the temperature and precipitation for the next 24 hours. If you want to see a more detailed graph, clicking "detailed forecast graphs" in the text ... ...
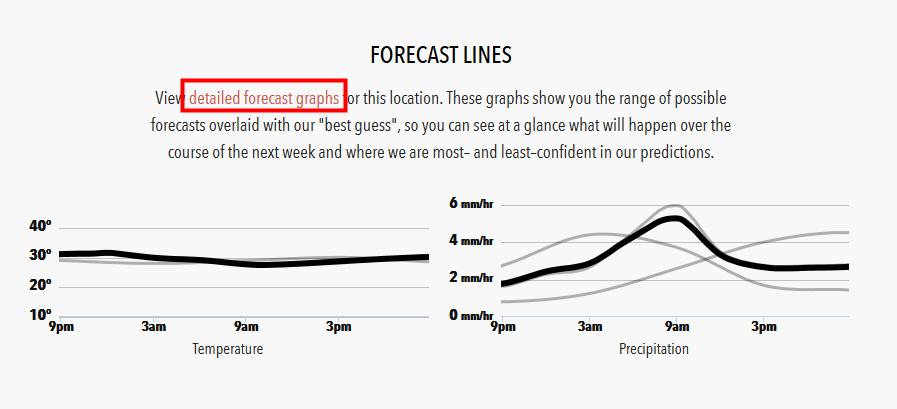
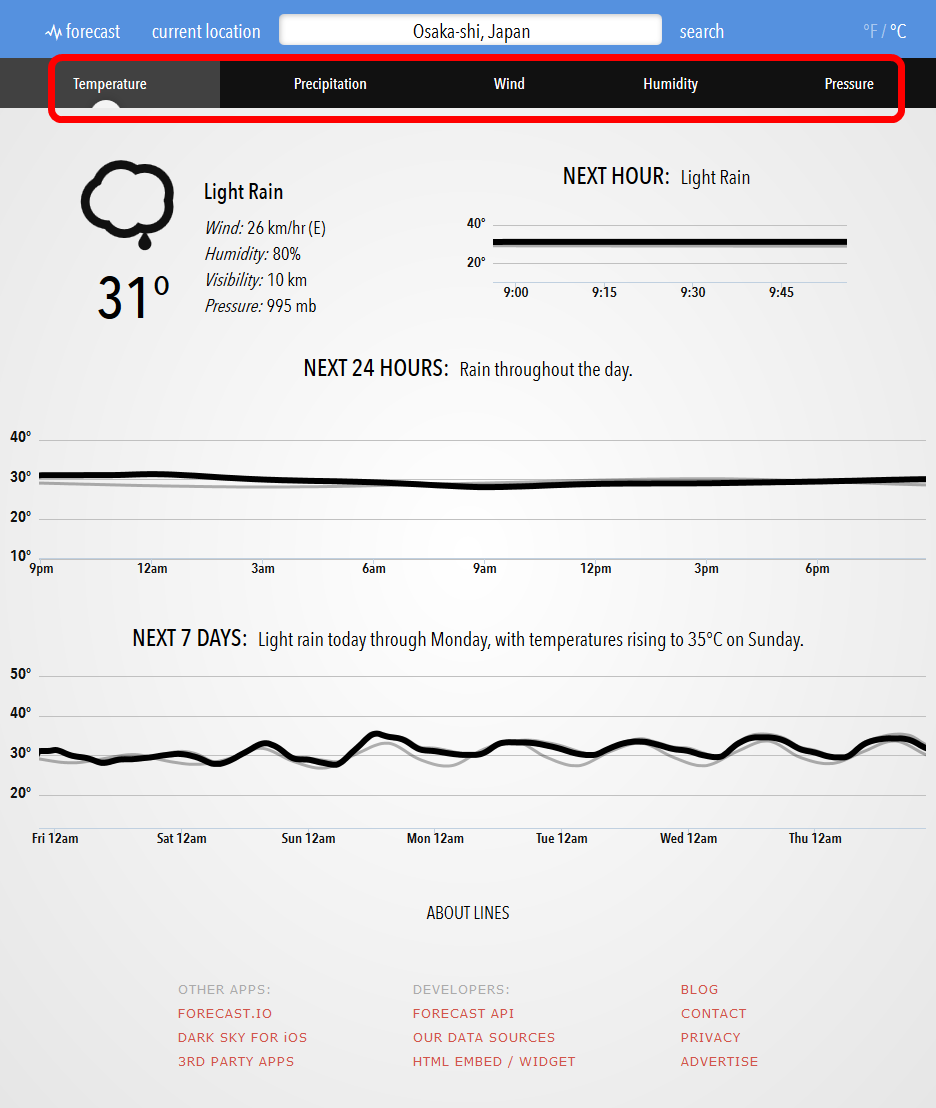
A detailed forecast graph was displayed. By selecting the tab at the top of the screen, it is possible to switch between temperature, precipitation, wind power, humidity, and atmospheric pressure.
◆ Forecats can also be embedded in your site
Because of the large number of requests received, the function of the embedded version Forecast has been released.
Forecast Blog: Forecast Embeds
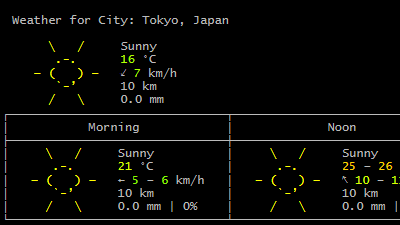
The image of the gadget embedded in the site looks like this. The place name is displayed in the upper left, the current weather and weather forecast are displayed at the bottom of the screen.
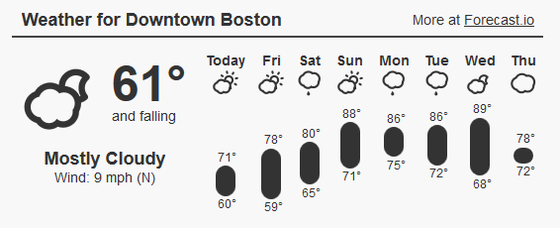
It looks like I actually embedded it. Since the transparent color is set except the display item, the background of the site is displayed as it is. When embedding this time, specify the width attribute as "560" (pixel), the place name as "Osaka station", the latitude as "34.701260", and the longitude as "135.496273". Besides being able to look up latitude and longitude in Google map etc.,ItouchmapIt is also possible to easily examine it using.
Related Posts: