"Gambletron 2000" which shows numerically what kind of game is exciting among all sports such as baseball, soccer, basketball etc.

ByGravitat - OFF
I think many people are looking forward to watching sports on weekends, but if there are no teams that support themselves, something that decides games to watch suitably somehow. However, only in such cases other matches will show tremendous excitement, sometimes you will miss the historic name game. In order to prevent such a thing, it is the number that gathers sports gambling data and quantifies the excitement of the game "Gambletron 2000"is.
Gambletron 2000
http://www.gambletron2000.com/
Production history of Gambletron 2000
On January 2, 2007,College footballofFiesta bowlBoise State University won the strong team of Oklahoma University in a big tournament. During the game, the producer of Gambletron 2000 got an online gambling siteTradesports.comofOddsIt seems that he was looking at the page on which it was displayed all the time.
In contemporary sports gambling during the gameBedYou can also do, the odds of each match will change constantly according to the direction of the game. So, the graph showing the odds of the Boise State University vs. Oklahoma University game violently fluctuates like an electrocardiogram, and if I think that the winning percentage of Boise State University has reached 90%, the winning percentage of the University of Oklahoma will be 95 It seems that it became%.
ByEd Yourdon
After this game it seems that Gambletron 2000 was to be made, thinking "It is a glowing match where the game is reversed after the reverse, as the fluctuation of the odds during the game is intensifying."
For example in 2014BCS National Championship GameFlorida State University vs. Auburn University got to be a thrilling match gathering worldwide attention, but the odds of the game continued to fluctuate violently until the end of the match.
The following graph shows the odds of Florida State University vs. Auburn University match, the vertical axis shows the probability that Florida State University wins, the horizontal axis shows time, and the odds fluctuation from the beginning to the end of the match It shows.
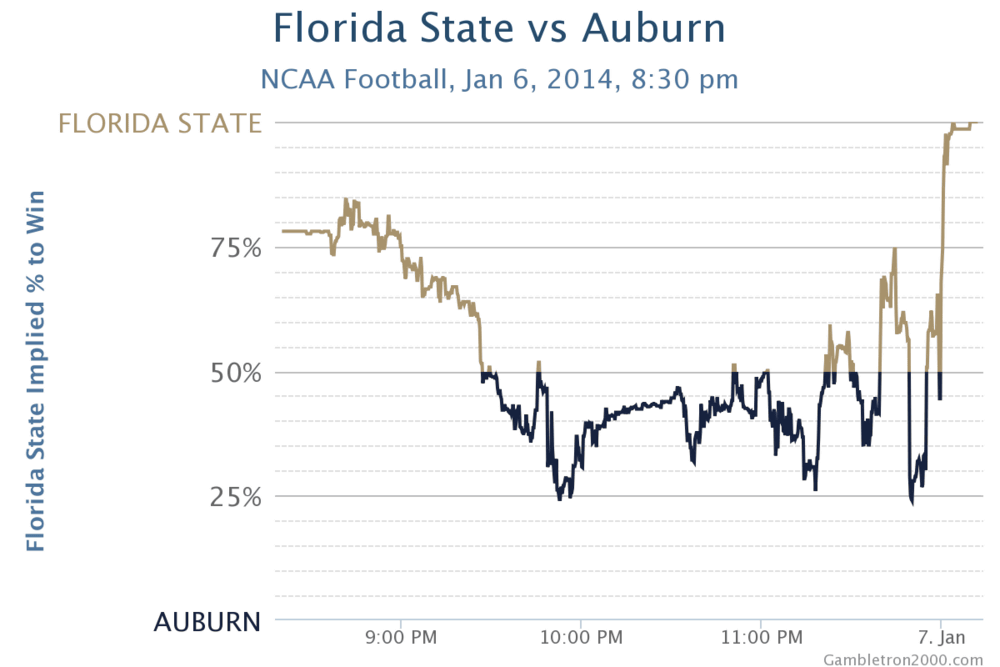
Until the start of the game, 78% of the gambler think Florida State University will win, but at the beginning of the game the Auburn university overwhelmingly led the opening age 21: 3. As a result, the winning percentage of Auburn University has risen to 75% at one time.
The highlight of this game can be seen from the following.
Florida State Seminoles vs. Auburn Tigers - Recap - January 06, 2014 - ESPN
http://espn.go.com/ncf/recap?id=340060002
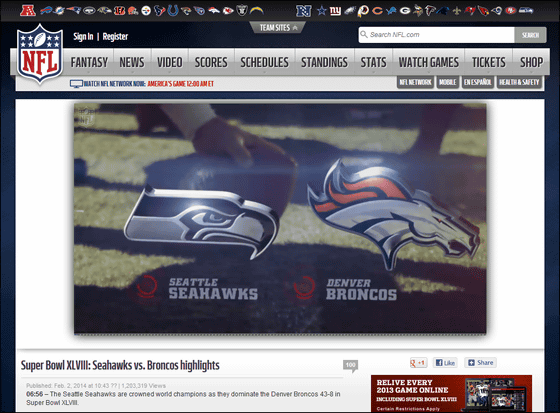
On the other hand, the graph belowSuper Bowl XLV IIIWas done atSeattle SeahawksversusDenver BroncosThe odds variation graph of warfare.
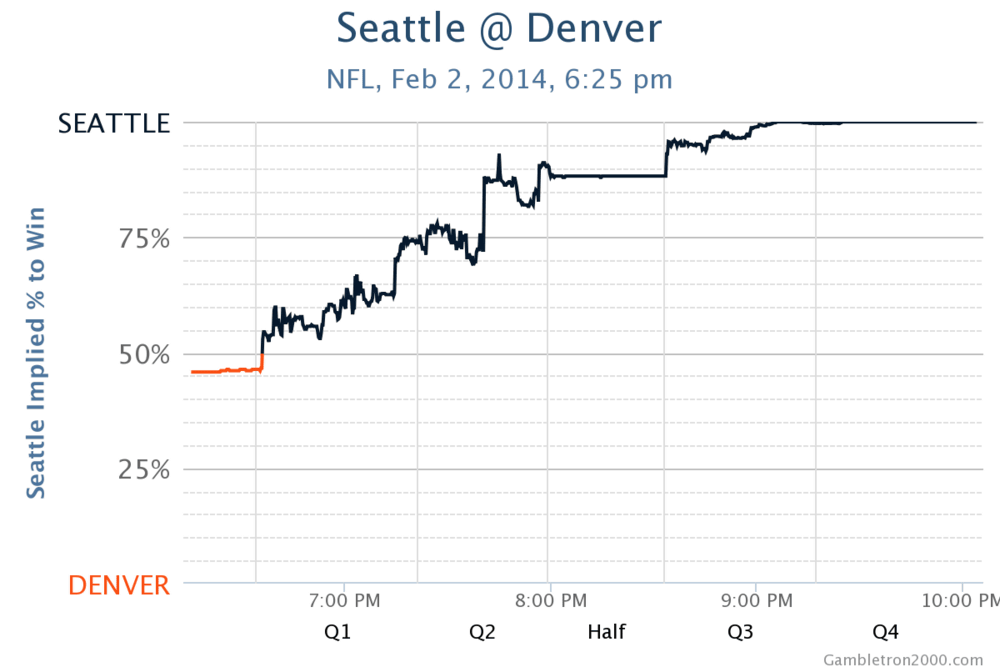
The final score of this game was 43 - 8, as this figure shows, the game was unilateral and odds did not fluctuate much. Below you can see that the Seattle Seahawks players are unilaterally attacking even if you see the highlight movie on the link.
Super Bowl XLVIII: Seahawks vs. Broncos highlights - NFL Videos
http://www.nfl.com/videos/nfl-game-highlights/0ap2000000323054/Super-Bowl-XLVIII-Seahawks-vs-Broncos-highlights
The data currently collected at Gambletron 2000 is the top league of American footballNFLAnd the top league of college footballNCAA Football, American professional basketball leagueNBAAnd college basketball leagueNCAA Basketball, Other professional hockey leagueNHLAnd professional baseball leagueMLB, Football'sPremier LeagueWhenUEFA Champions LeagueWe are gathering data on the real-time gambling market in Japan, so you can see "Which game has glowed up" or "Which is exciting in progress in real time".
◆ I actually used it
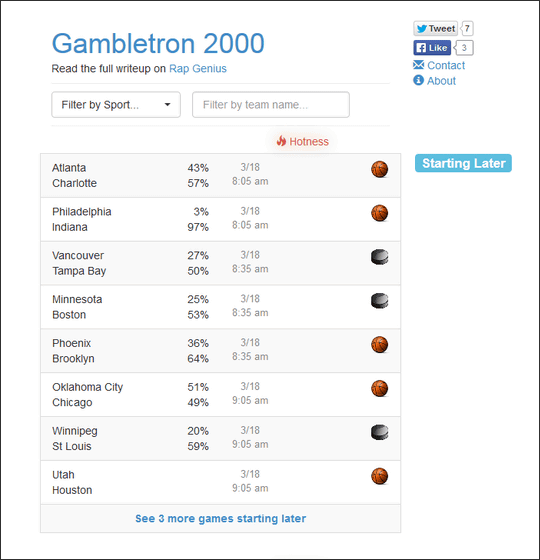
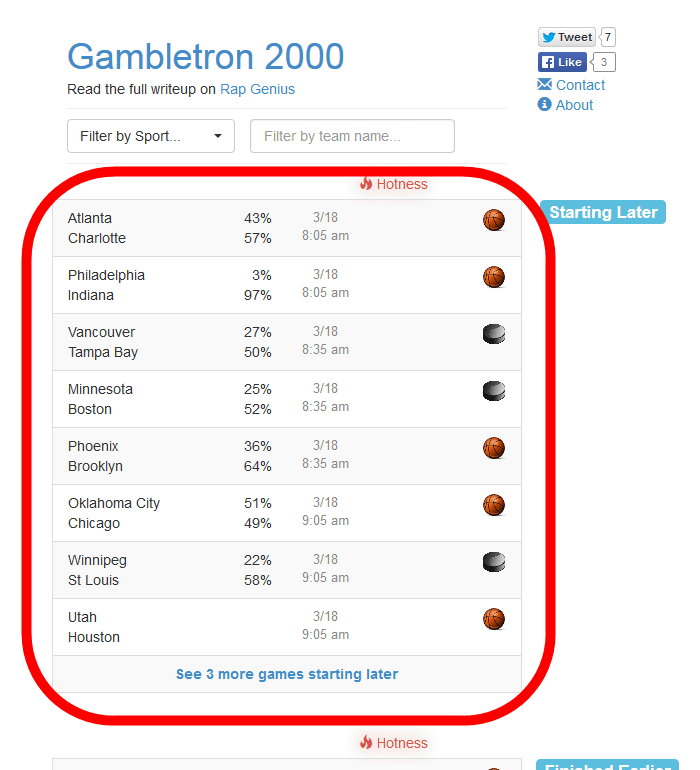
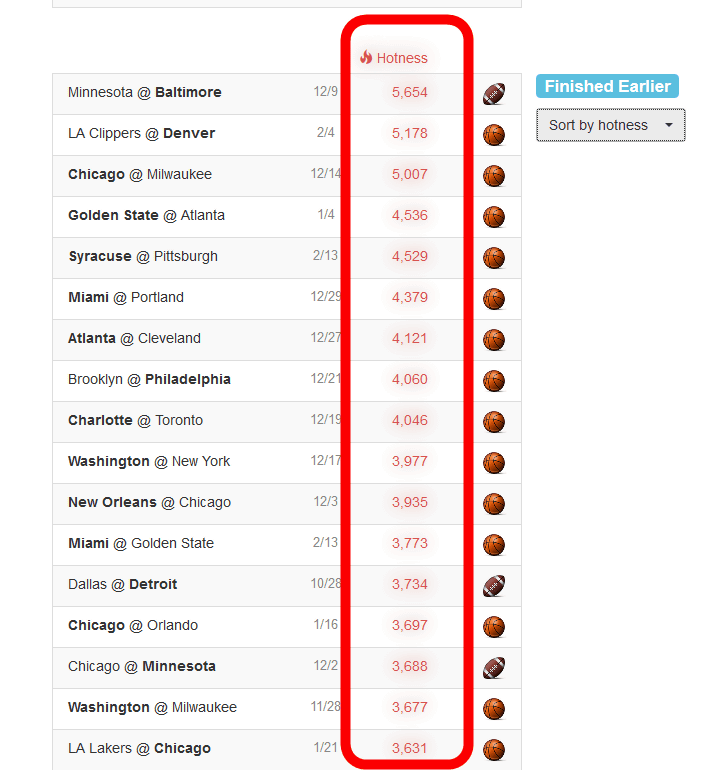
"Gambletron 2000Top page The red frame part displays the odds fluctuation graph of the sport currently playing, or the link to the odds fluctuation graph of the game scheduled to be held from now. You can see what kind of sports odds the link is displaying by looking at the icon.
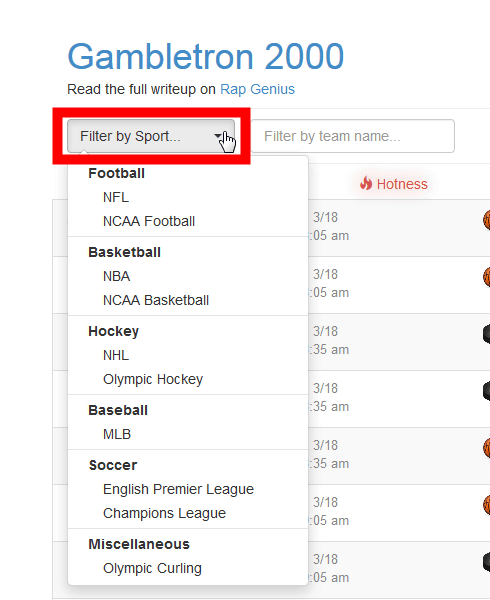
By clicking "Filter by Sport ..." at the top of the top page, you can display only specific sports.
In addition, click "Sort by start time" in the middle of the page.
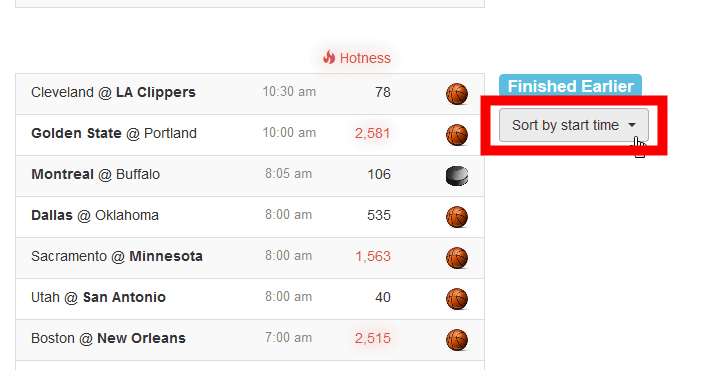
From here we can sort items by game 'start time' or 'hotness', so click on 'Sort by hotness' to show the game that was exciting.

Then the sorting is completed like this. The numerical value of the red frame part becomes the numerical value showing the degree of excitement of the game.
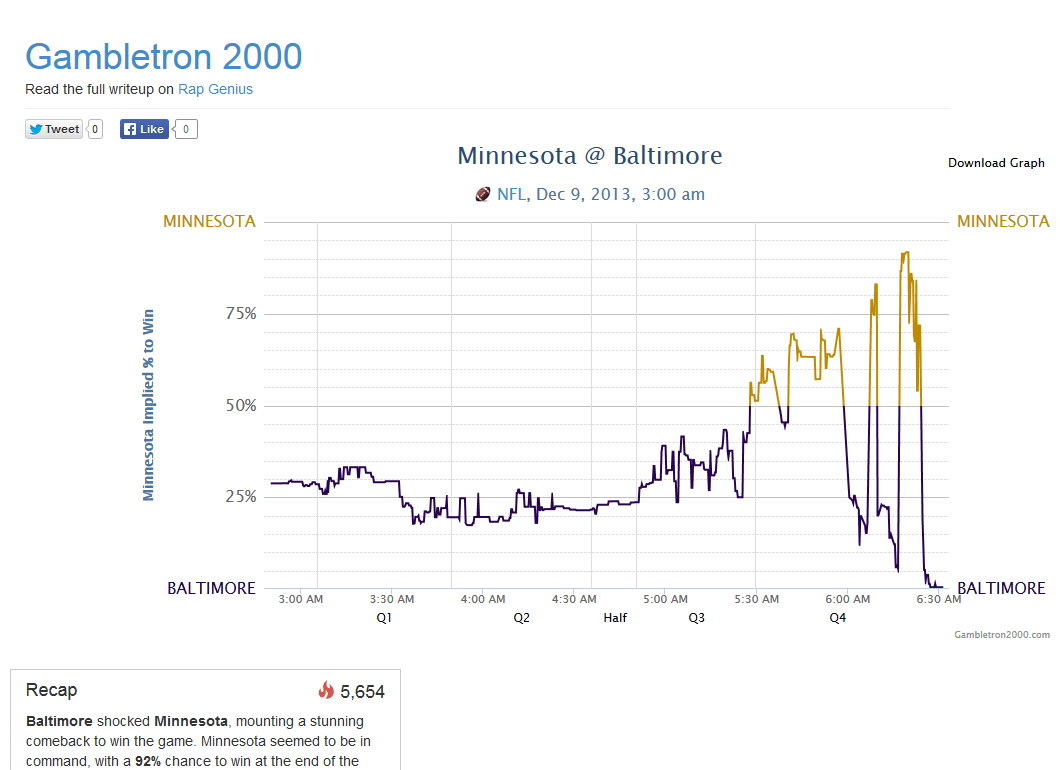
It was in October 2013 that Gambletron 2000 began collecting various sports data and it was said that the most exciting period in the period after that was done on December 8, 2013Baltimore · Ravens vs. Minnesota · Vikings match. In this game, the reversal followed by the reverse took place, and Ravens was leading the score at 45 seconds remaining, but we decided the touchdown 4 seconds before the match and won the reverse win.
Despite being the most inconspicuous match in this NFL match, the Gambletron 2000 database says NBA games are the most exciting sports. When you sort each item in descending order of the numerical value of "hotness", 40 of the top 50 are NBA games, and from the data of Gambletron 2000, NBA is the most exciting sports league It seems to be.
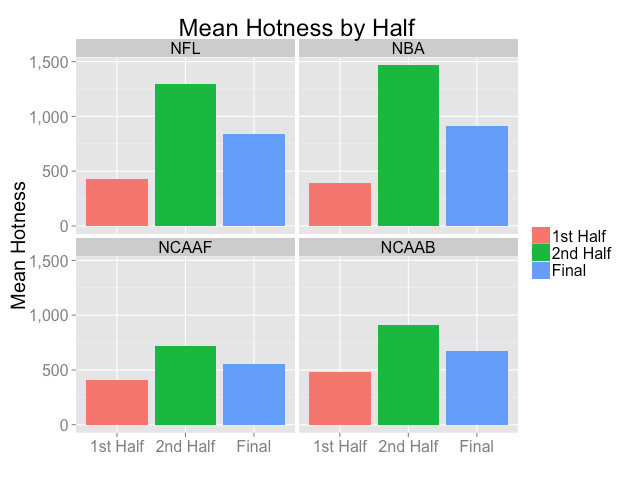
Furthermore, looking at the average value for each sports league, NBA is 908, NFL is 843, and although it is a small difference, NBA also knows that the value of "hotness" is higher than NFL. The average value of "hotness" of other sports leagues was 680 for NHL, 531 and 712 for NCAA Football and NCAA Basketball, which are university leagues respectively. There is a big difference between the teams belonging to the university league than the proficiency differences for each team of the pro league, so it is inevitable that the average value of "hotness" will be lowered, the creator of Gambletron 2000 describes It is.
ByRondo Estrello
Furthermore, when we divided the average value of "hotness" of each league into the first half and the second half of the game, the value of "hotness" in the second half of the league showed higher value than the first half. Especially NBA has an opening in the value of "hotness" in the first half and the second half, the first half shows the average value of the lowest "hotness" in all the leagues, whereas the second half gives a value higher than any league in the second half about. Based on these data, the creator of Gambletron 2000 commented "So the first half of NBA is boring".
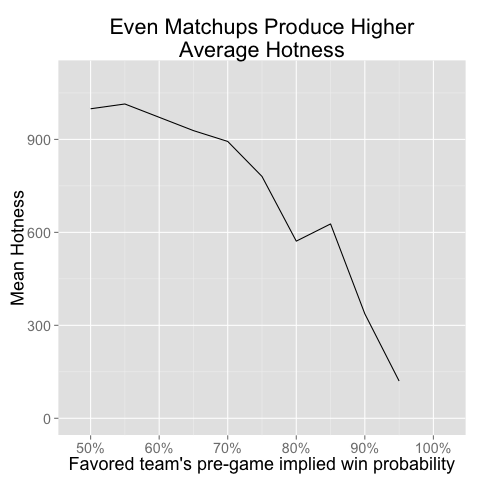
And this is the graph showing the relationship between the "hotness" value before the match and the final match result. As you can see from the graph, the higher the "hotness" before the game, the more you know that there are many developments that you do not know which team will win.
In Gambletron 2000, it is also possible to show the most exciting sports of all the sports being done in real time, so if you want to "get hot by looking at games that have gone hot anyway" or "When an exciting sports game is wanted I'd like to use it in scenes such as wanting to see.
Related Posts:


in Web Service, Posted by logu_ii