"Earthquake hazard chart" that tells earthquake risk level from the ground information etc. of designated place
Japan isPacific Rim Volcanic BeltIt belongs to an earthquake frequent area called "earthquake occurrence frequent area", and earthquakes occur frequently in the country since 2013Earthquakes with seismic intensity of 5 or more are 9 degreesWaking up,Earthquakes with a maximum seismic intensity of less than 6 in the Kinki districtThere are times when it happens. I want to use it because I live in Japan with many such earthquakes tell me about the earthquake risk of the designated place "Earthquake hazard record"is.
Earthquake hazard record
http://www.j-shis.bosai.go.jp/labs/karte/

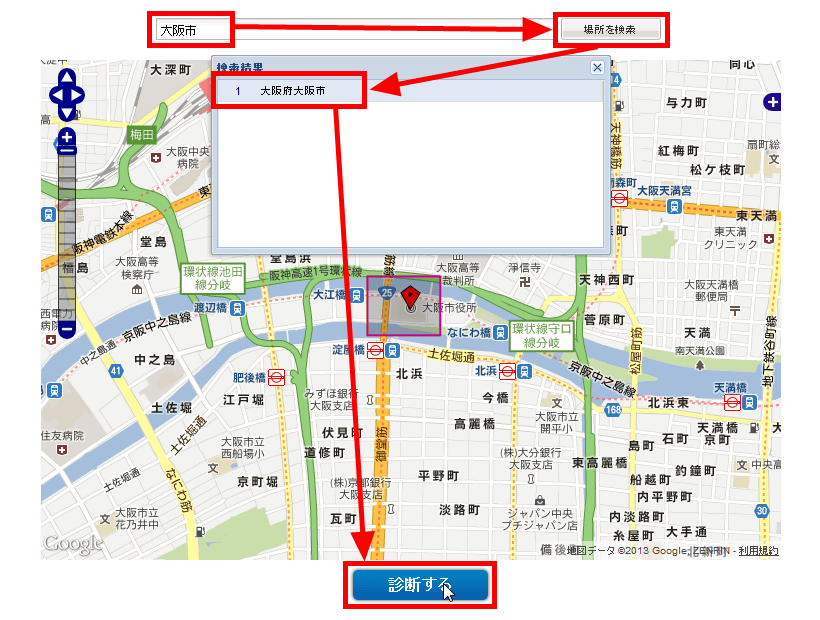
First, enter the address of the place you want to check with the earthquake hazard chart. This time I will check the earthquake risk in Osaka prefecture Osaka city, so when I enter the address, click "Diagnose".
Then this will display earthquake risk information of the designated place in detailEarthquake hazard recordis.
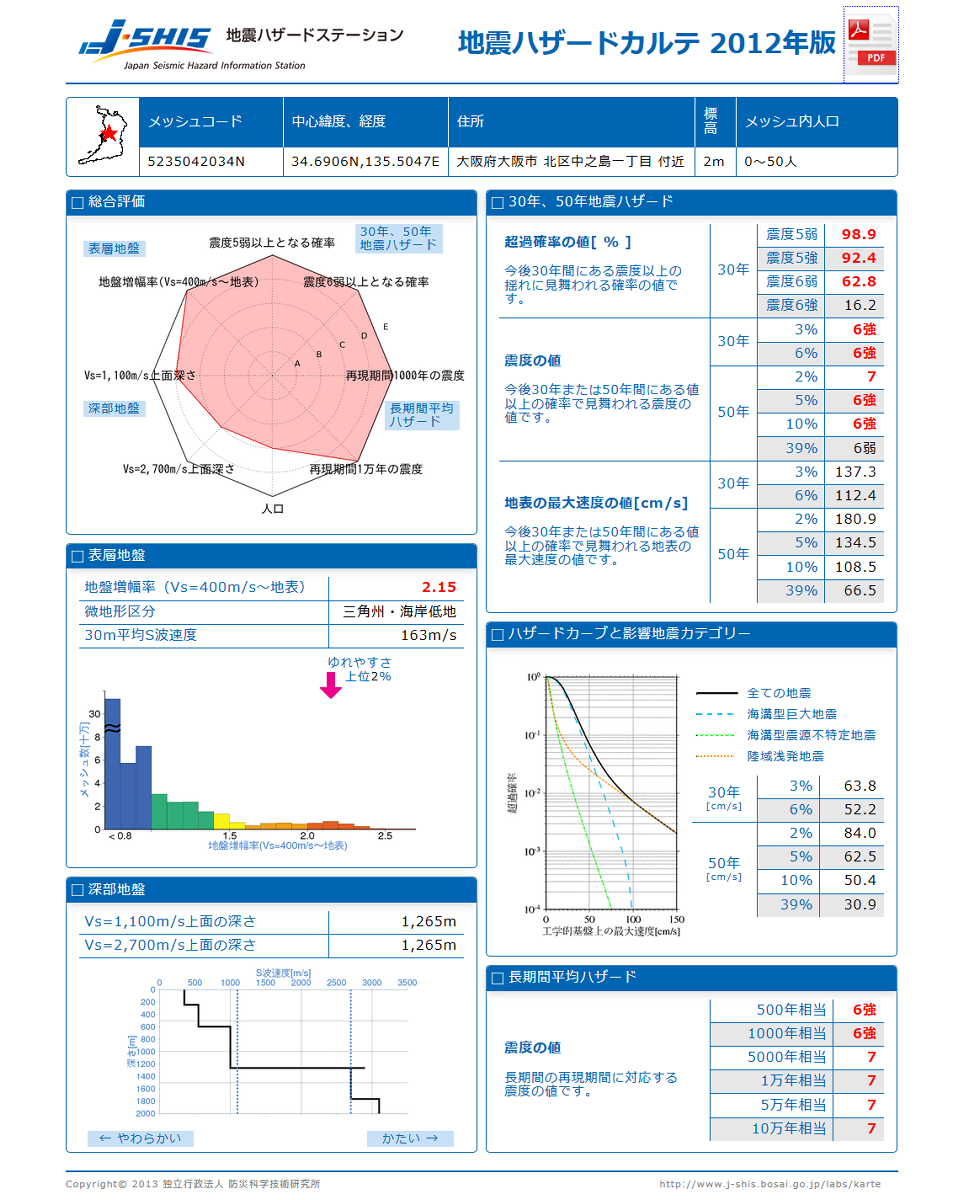
Information on the land on which the earthquake hazard information was diagnosed is displayed on the upper part of the chart, and it is about 250 meters square of the designated point that will be investigated.

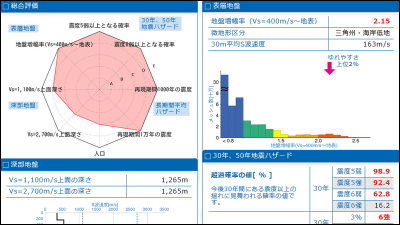
On the upper left is a graph showing the "total evaluation" of the seismic risk of the investigated land. Briefly, it can be said that the greater the red part of the graph, the more earthquake danger is. So it seems that the points surveyed in Osaka city were areas with considerable danger.

At the point where the risk of the earthquake is low, the comprehensive evaluation graph will look like this. However, because the graph is small, it does not indicate that there is no danger from the earthquake, so be careful there.

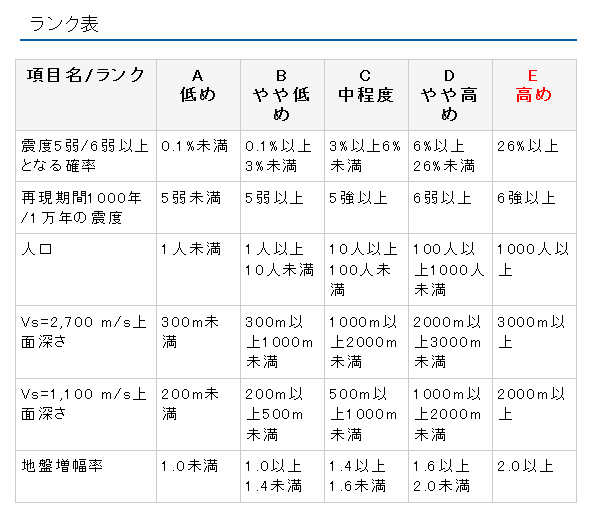
The comprehensive evaluation graph is evaluated according to the following table, and the graphs other than the comprehensive evaluation graph display these values finely.
Next, the graph on the left side center of the chart shows the "surface stratification ground amplification rate". The larger this value, the more likely the earth's surface to shake even if the same scale of earthquake occurs. Osaka city has a ground amplification factor of 2.15, and the fluctuation is the top 2% and seems to be a point that is quite easily fluff ... ...

At places where the ground amplification rate is low, where the amplification factor is 1 or less is also ant.

And the graph written about "deep strata" is on the bottom left of the chart. This graph shows the speed of the S wave (main movement) caused by the earthquake by depth of each ground. In this graph, the S wave is slowing down at a depth of approximately 1200 to 1400 meters in the ground, so the ground here becomes soft and the speed of the S wave is increased You can see that it is dropping greatly. If the deep strata are soft, the ground will shake violently, so the closer you are to the "L" shaped graph, the more dangerous the land will be.
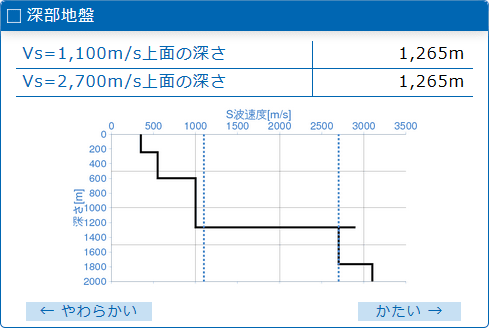
The graph of the hard ground deep part (relatively safe place) looks like this, and it turns into a graph that shows that the speed of the S wave is falling at a stroke near the ground.

This is the "30 year, 50 year earthquake hazard" table on the upper right of the chart. As shown in the table, 30 years later 50 years laterExcess probability· The value of the seismic intensity · It shows the value of the maximum speed of the ground surface.

Considering that there are also points where the probability of occurrence of earthquakes with seismic intensity of 5 or more even after 30 years is 22% or less, Osaka city seems to be quite an area to watch out for earthquakes.

And in the center of the right side of the chart this is "Hazard curve and influence earthquake category". This is a graph showing the excess probability for each type of earthquake, which indicates that the probability that a swing larger than a certain value will occur is higher as the graph goes upward.

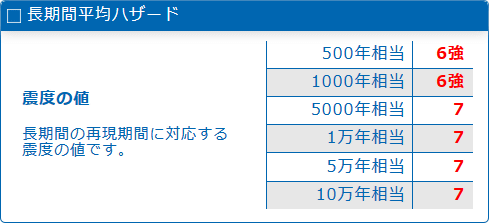
And "long-term average hazard" is in the lower right of the chart, this means that once each year the earthquake of each value seismic intensity occurs. In this table, it means "a place where an earthquake with seismic intensity of 7 or more occurs once in 5000 years".
Although I am using too much unfamiliar words, information on earthquake risk is written using tables and graphs for easy visual judgment,GlossaryIt is prepared. If you use this service, you can look at the earthquake risk level anywhere in detail, so it may be good to investigate near the house, workplace, school, etc. as a preliminary knowledge before preparing for the earthquake Hmm.
Related Posts:

in Review, Web Service, Posted by logu_ii