You can see the relationship between weather and reaction on Twitter and Facebook "C ° F"
The topic of the weather is to speak without obstacles in real conversation. The same thing happens even on the net, and the topic of the weather has become a hot topic in social media. Focusing on this point, investigating conversations on social media, infographic that visualized the relationship between people's reactions to the weather "C ° F"is.
CLEVER ° FRANKE | Design for complexity |
http://www.cleverfranke.com/cf/en/index.php
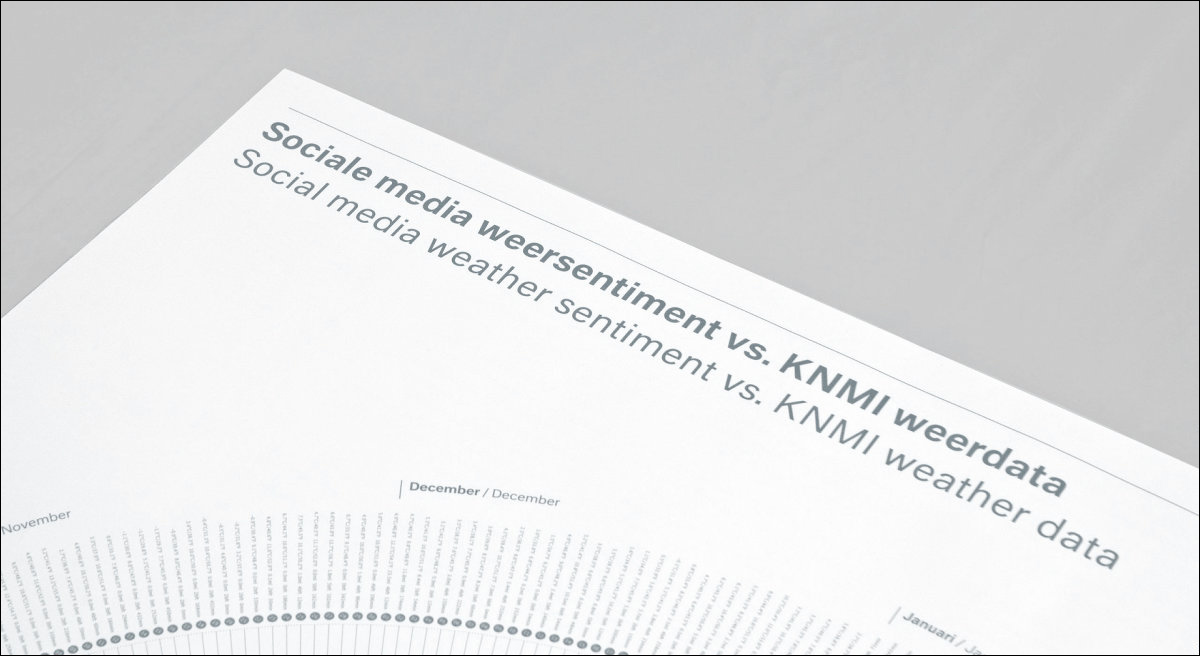
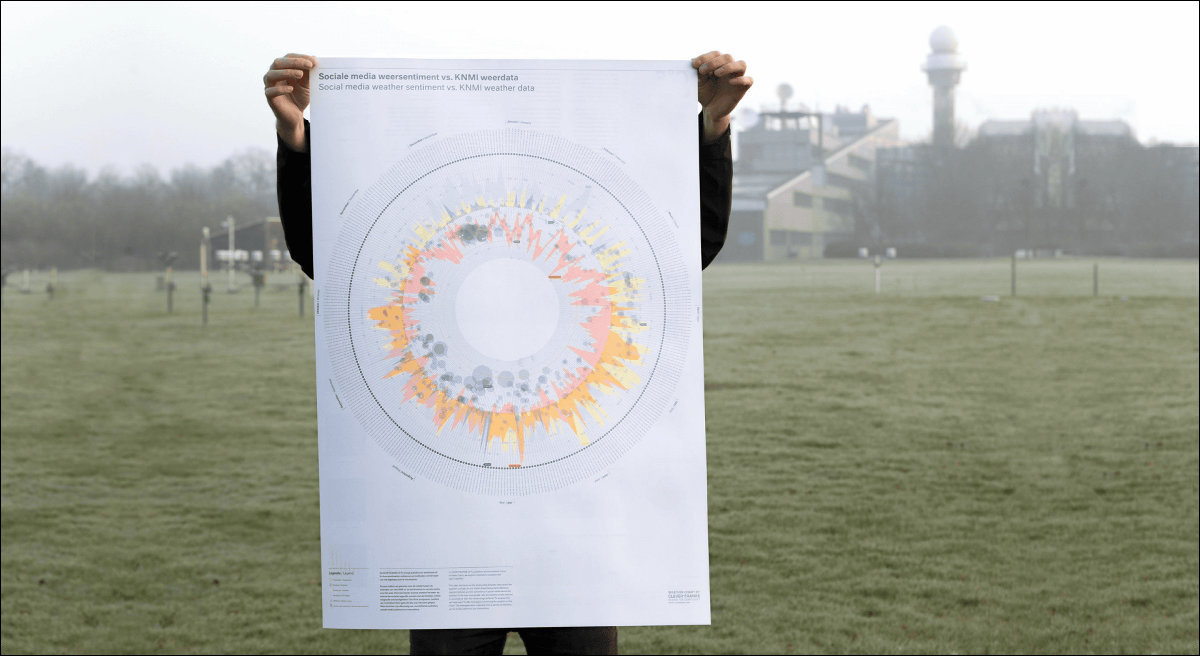
C ° F is a graph showing the relationship between the daily weather of the year published by the Netherlands Meteorological Research Institute and the response of social media to it.
CLEVER ° FRANKE who created C ° F is a design company in the Netherlands, but this weather calendar concentrates on and stops receiving orders from clients each year. I'm enthralled.
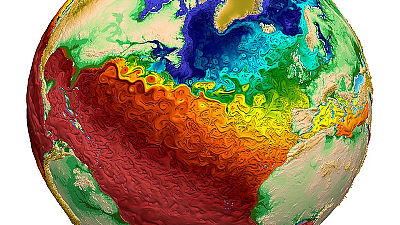
Infographic is like this.
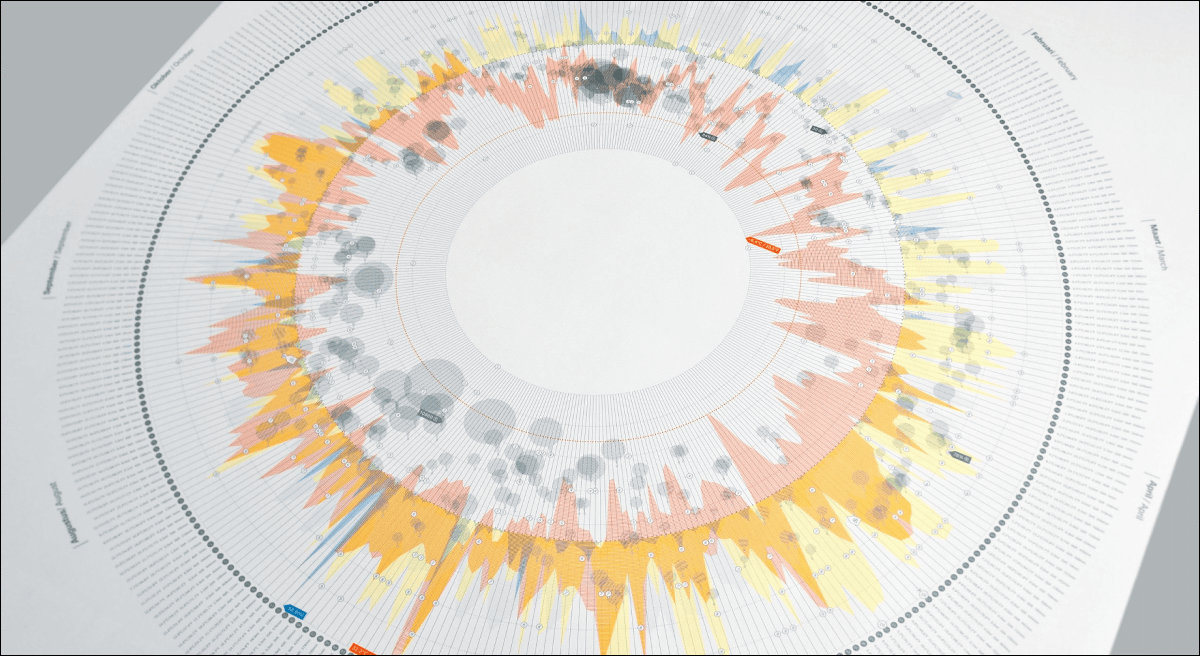
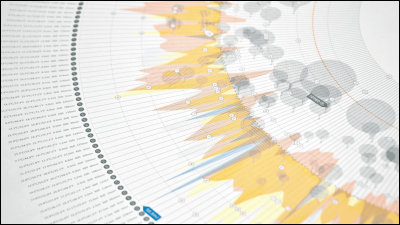
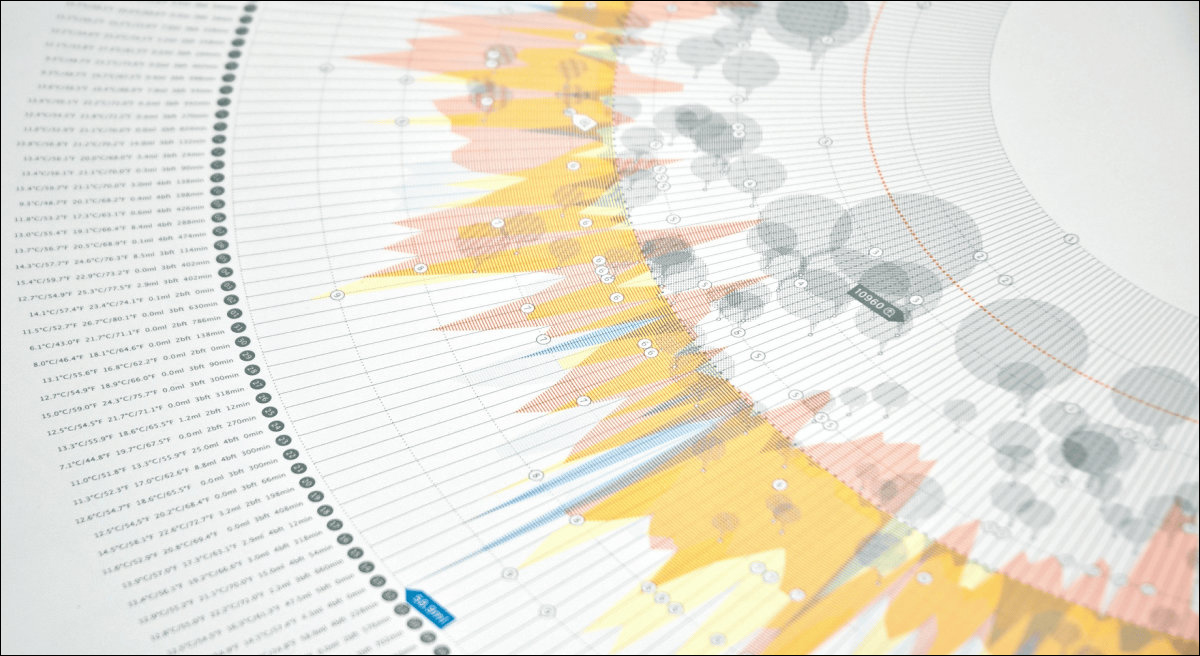
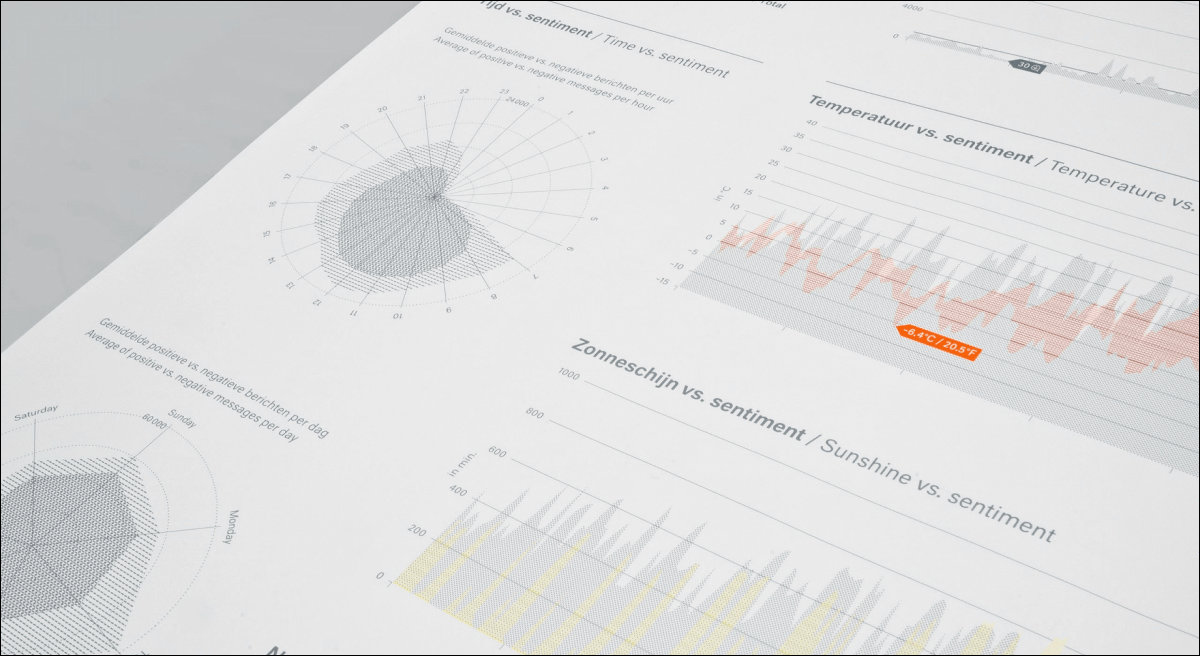
The radial graph shows the amount of comments on temperature, precipitation, daylight hours, wind speed, weather rating (10 levels of weather rating), and online weather.
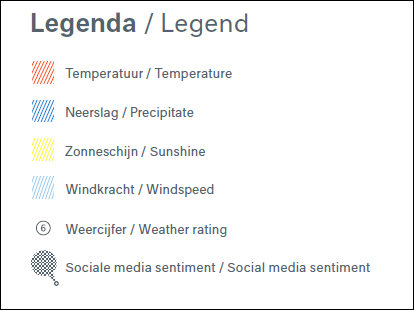
Weekly weather and comments on 710,443 weather items collected from websites and social mediaAi AppliedAs a result of the analysis, I understood the following things.
People tend to return negative reactions rather than positive reactions to the weather.
There are many positive comments on the weather in March and April, especially negative in December.
Comments on the weather are on weekdays from 7 am to 8 am in the morning and the lunch time is the largest, while holidays have few comments on the weather.
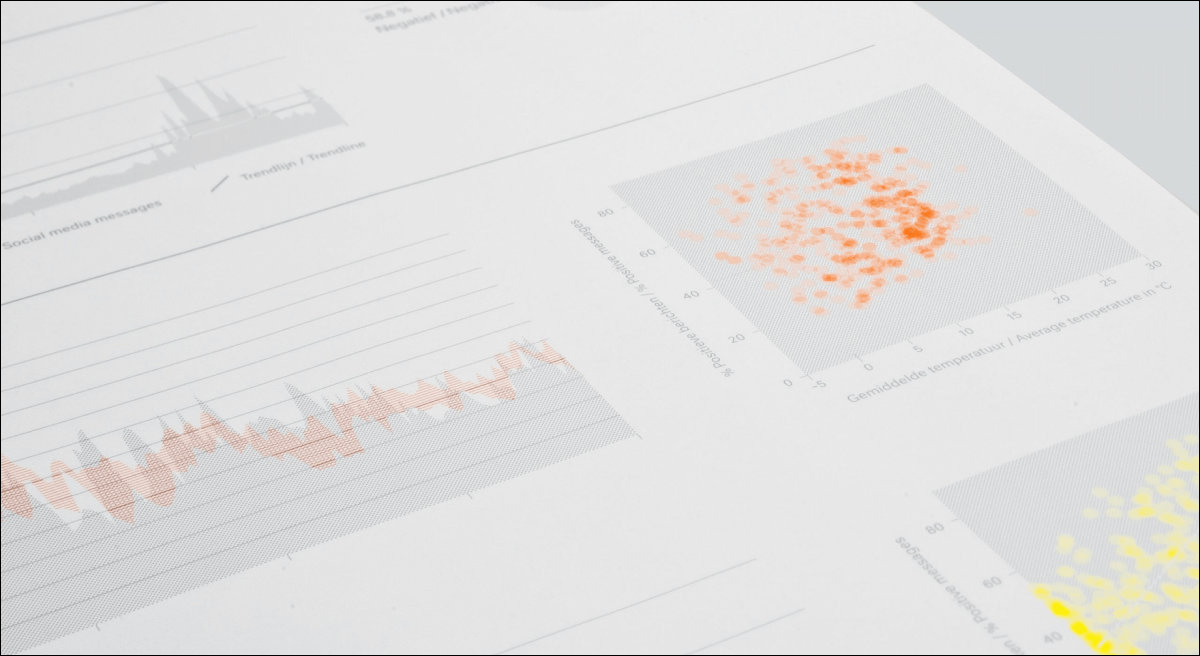
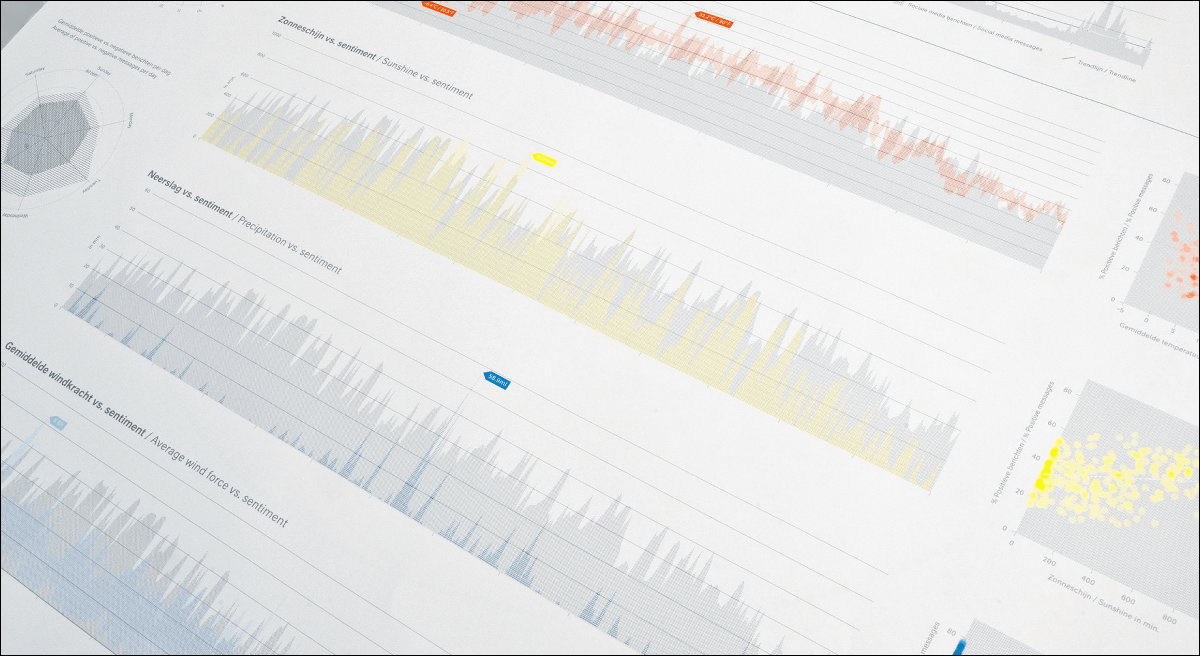
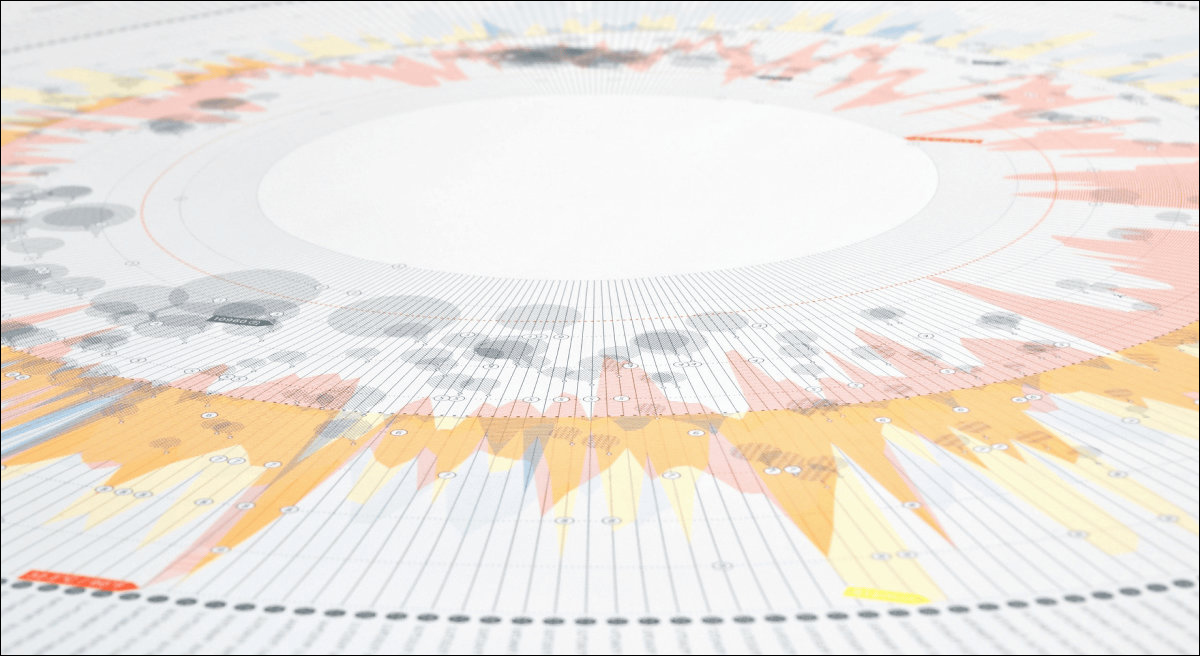
It is the sunshine time that has the most correlation with the reaction on social media, and the longer the sunshine time, the more positive comments.
Note that this infograph is actuallySaleThe size is 100 centimeters by 70 centimeters in height and the price is 27 euros (about 2700 yen).
Related Posts:


in Design, Posted by darkhorse_log