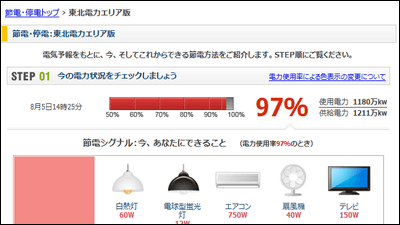
Tokyo Electric Power Company announces "Power usage status graph" showing power usage record on the Internet
About TEPCO's planned blackouts, we will display "Power usage graph" on the day showing "Electric power usage record for each hour", "Supply power at peak time", "Electric power use record per hour on the previous day" I began publishing it on above.
Access is from the following.
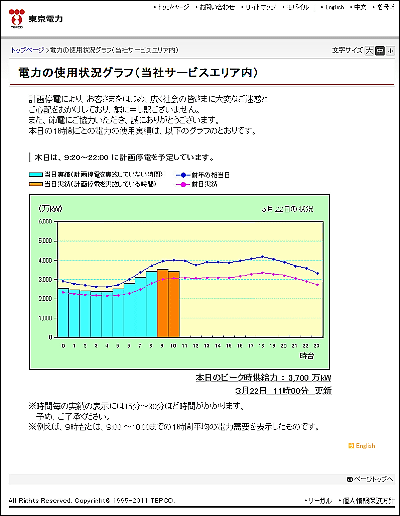
Power usage graph (within our service area) | Tokyo Electric Power Company
http://www.tepco.co.jp/forecast/index-j.html
TEPCO Press ReleaseAccording to, it is written as follows.
Due to tight power supply and demand due to the occurrence of Tohoku Region Pacific Offshore Earthquake, after March 14,
We are carrying out planned blackouts. Everyone in society, including our customers, widely
We apologize for any inconvenience and serious inconvenience. We also cooperate to save electricity
Thank you very much for your help.
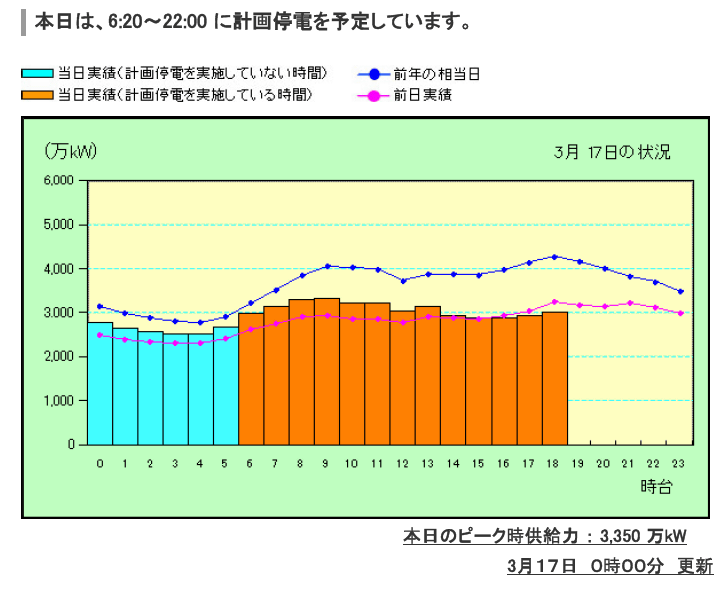
From today, "Power usage status graph" will be posted on our website.
In the graph, the "Electric power usage record per hour" on the day in our service area
In addition, "peak supply capacity" and "previous hour's power usage record" etc. are displayed
By doing so, we will use your electricity widely, reflecting your cooperation for energy saving and planned blackouts
I will inform you. We can deliver electricity steadily as soon as possible
We are doing our utmost to restore work so that we can do it, so it was inconvenienced
Continue to continue your cooperation to save electricity and understanding of planned blackouts
I hope.
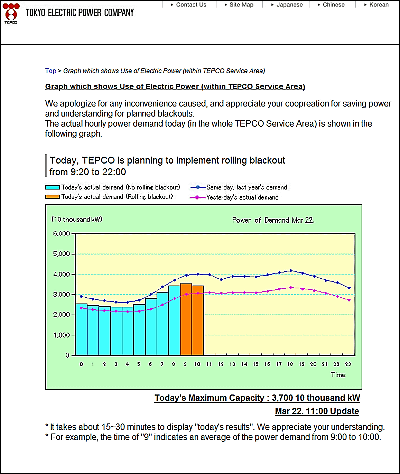
Also, the English version is published at the following address.
TEPCO: Graph which shows Use of Electric Power (within TEPCO Service Area)
http://www.tepco.co.jp/en/forecast/html/index-e.html
Related Posts:

in Web Service, Posted by darkhorse