NASA confirms that there is water in the "moon", unpublished data on newspapers and televisions are released on the net at once
The interior of the crater "Cabeus (Cabeus)" in the moon's south pole is in a state (light permanent shadow) where light does not hit by the relationship with the sun for a long time, and maybe it is water State) is not there? It was predicted as such. In order to confirm this, we launched the observation satellite "LCROSS (Elcross)" in June 2009, hit the booster and the observation machine itself on the south pole part of the moon on 9th, observed the chilled soap, As a result, the water vapor vaporized by the heat is observed, and there is water in the moon, it also has more water collectively than expected It turned out.
On NASA's official website this is delivered as top news, and various images and survey results are released.
Details are as below.
NASA - LCROSS Impact Data Indicates Water on Moon
http://www.nasa.gov/mission_pages/LCROSS/main/prelim_water_results.html
This is a camera taken with visible light after 20 seconds from the collision.
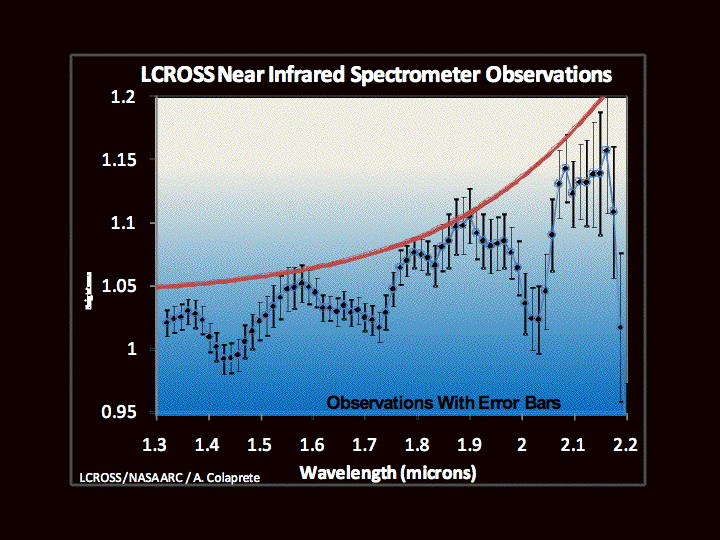
Data from near-infrared spectrometer for low-sky. It shows the spectrum of dust clouds as if the red curve is "gray" or "colorless", and the yellow area shows the water absorption zone (water is absorbed by dust).

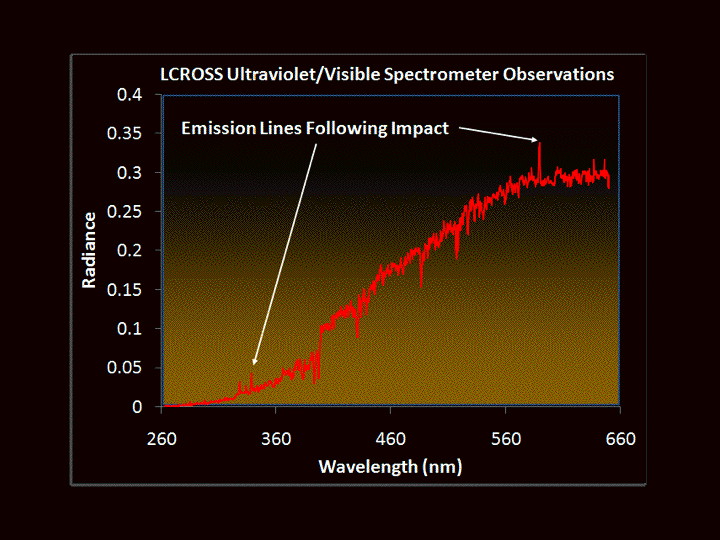
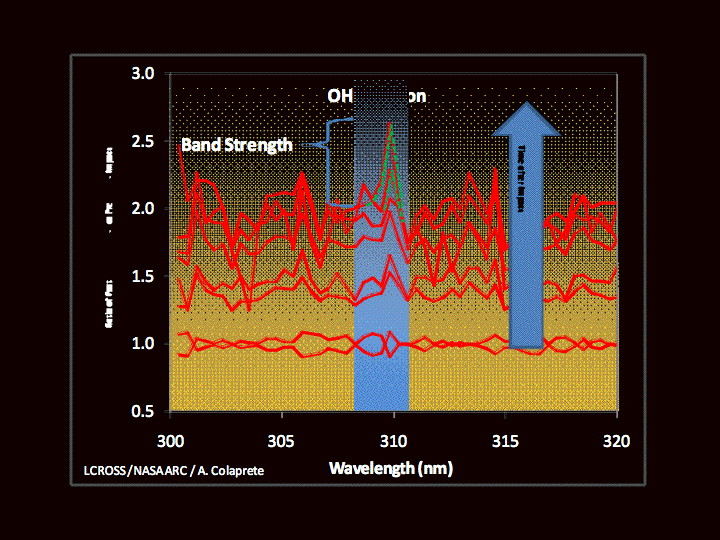
Immediately after collision, data from ultraviolet / visible spectrometer. The tip of the arrow indicates the presence of a compound in the vapor / debris cloud.
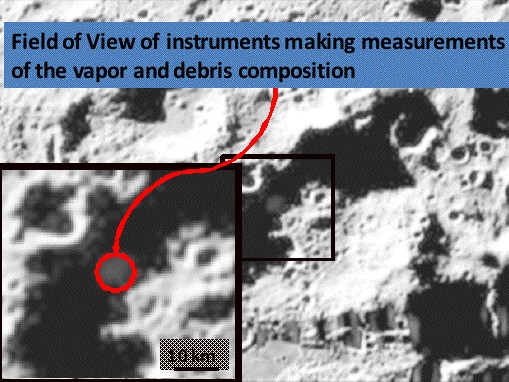
The field of view of the spectrometer is indicated by a red circle.
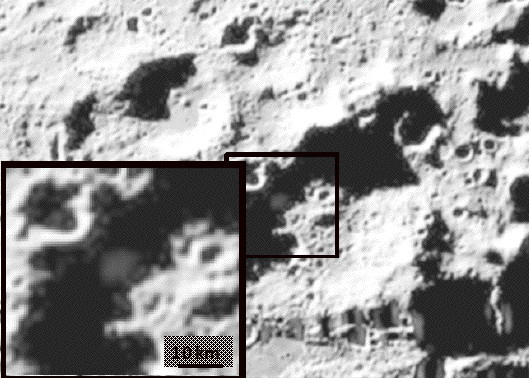
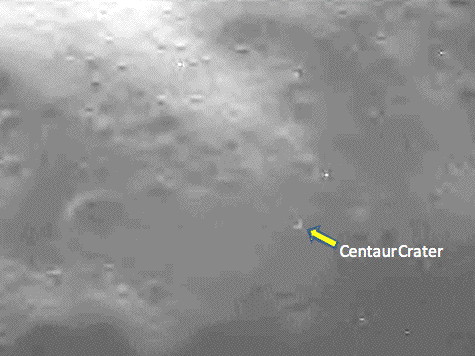
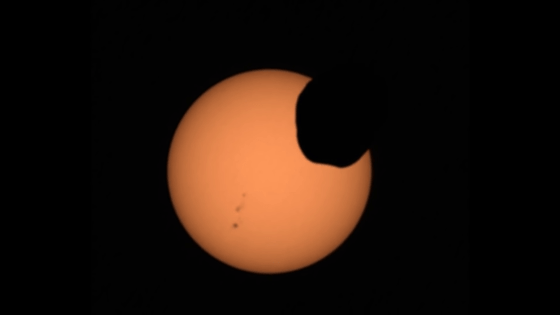
Crater "Cabeus" seen through the near infrared camera of "LCROSS". By collision of this observation machine it is like this.
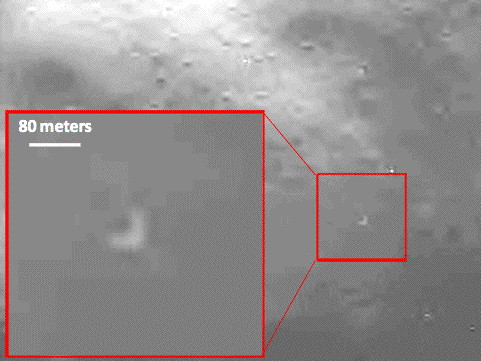
I am seeing by zooming in the results of this collision. The white line in the enlarged view is 80 meters long.
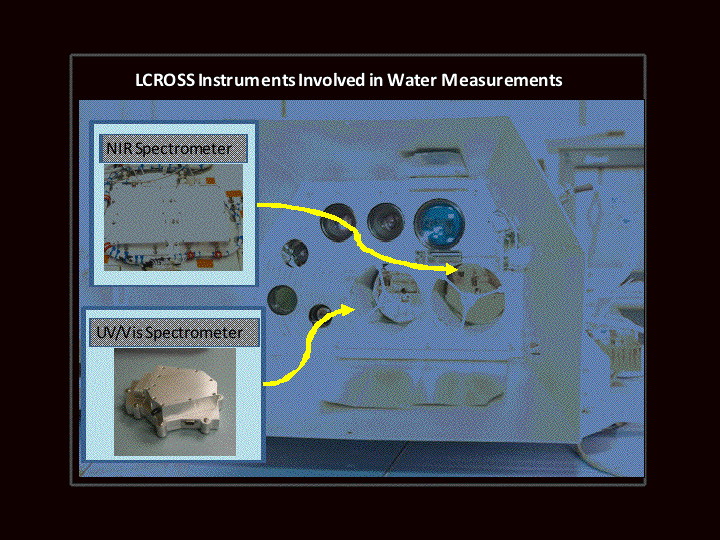
This is the state of the spectrometer installed in "LCROSS". It was observable with this.
Data from near-infrared spectrometer for low-sky. What is inscribed vertically on each data point (black dot) indicates an error. The valley part and the slant part of the graph are the result of various compounds absorbing NIR light. These data are the average of spectra obtained between 20 and 60 seconds after collision.
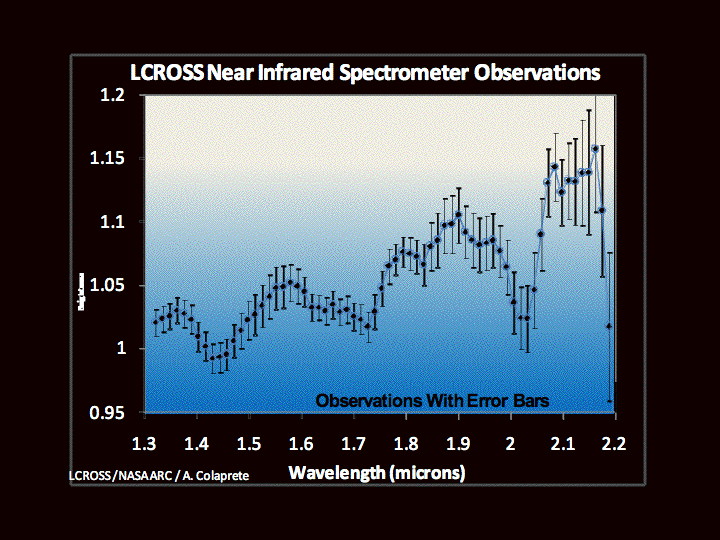
For the data from the near-infrared spectrometer for low-sky, the red curve is a graph showing what the spectra of the dust clouds are like. If this curve is smooth, it means that nothing contained foreign matter in the dust.
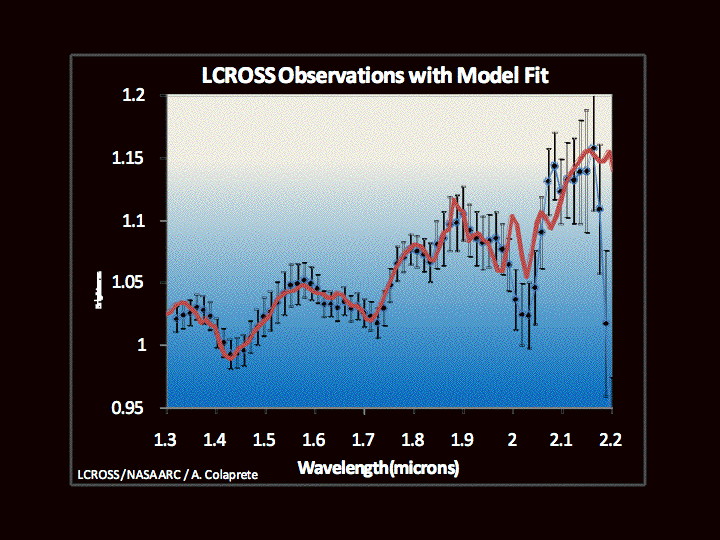
However, the data from the near-infrared spectrometer for low altitude actually shows that it contains more synthetic compounds, and in addition, various synthetic materials which are the cause of spectral features It takes a lot of time to identify it.
This is ultraviolet / visible ray data just before the collision. It is said that the increase with time is the result of sunlight reflecting from the dust particles in the ejecta cloud. Sharp vertical parts shown in the darkened blue area and appearing immediately after the impact are related to "OH (oxygen and hydrogen)", and as a result, it turned out that water was present.
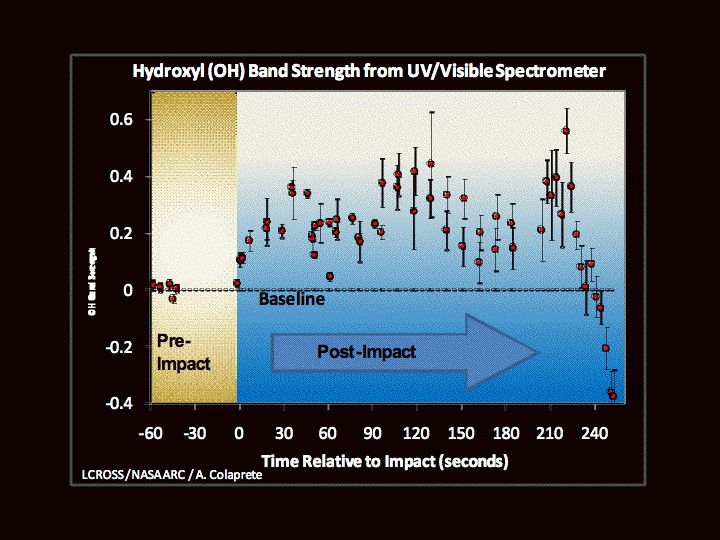
This shows the strength of "OH". Before the collision, the line is flat, that is, there is no "OH" state, but the line strength grows after collision, you can see that "OH" existed for several minutes.
Related Posts:

in Science, Posted by darkhorse