"NetWorx" Monitors Your Network Usage and Tells You When to Stop Net Surfing
As you know, there's no thing like "Unlimited Connection Plan" for Internet. Regretfully the only thing we got is an "Unlimited Connection Plan(but UL and DL limited to blah-blah-blah GB)". it's true that GB class bandwidth is too big to use up in a daily life, but it's also true that contents on the Internet is getting bigger and bigger every day and we still have to be careful not to over the limit.
This "NetWorx" is a software which visualizes your network usage, enables you to understand your bandwidth in a glance and warns you when the limit is near. It will calculate when will your download(or upload) finishes, make a hourly, daily, weekly...whatever period of report you wish. You can even synchronize multiple "NetWorx" software on different machine to maintain your LAN.
Read on for download and detail.
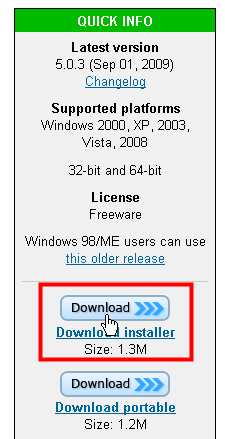
Bandwidth monitor, bandwidth speed test, bandwidth and traffic monitoring tool for Windows
♦Download and Install
Click the link on the page above and download the installer.
Click and run the installer.
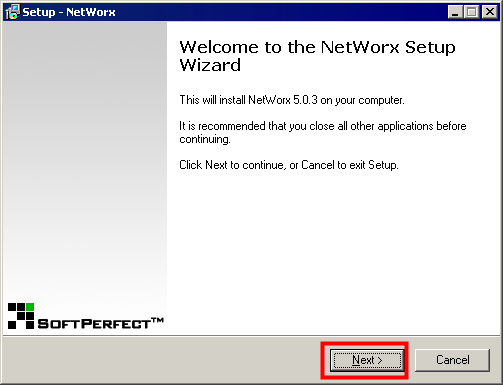
Click "Next".
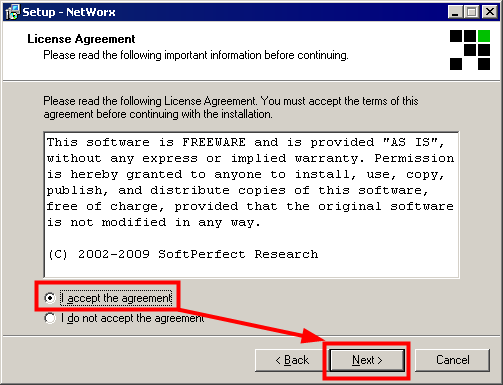
Place mark on "I accept the agreement" and click "Next"
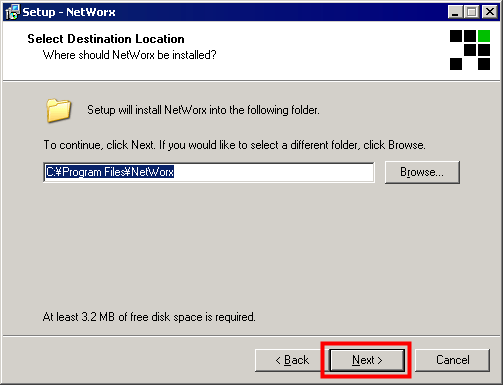
Click "Next".
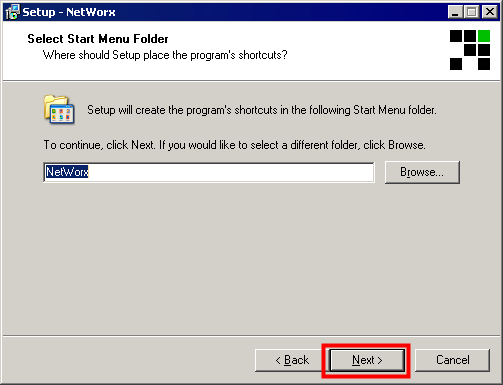
Click "Next".
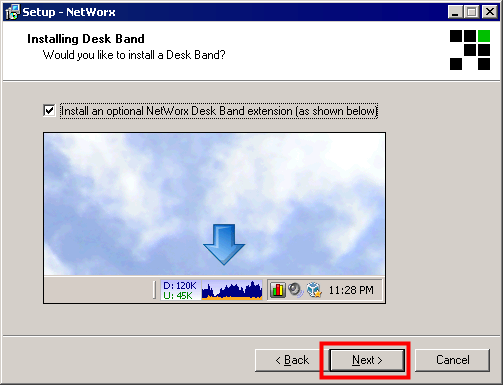
Click "Next".
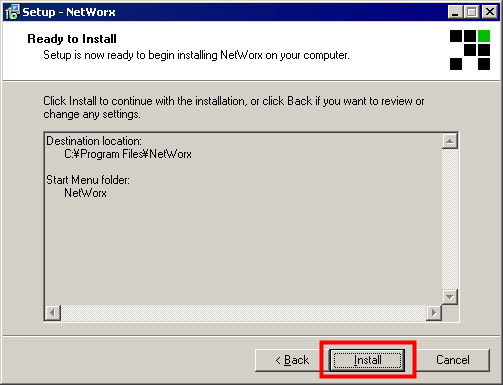
Click "Install".
Click "Next".
Now click "Finish" to run the software.

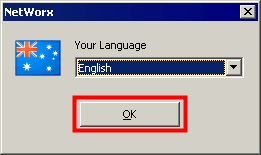
Select your language and click "OK".
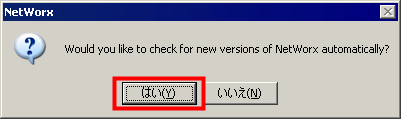
Select whether you want to update your software via network.
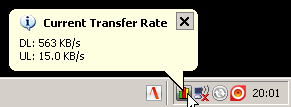
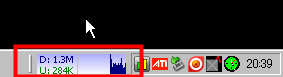
So the icon will show up in the task tray. Hover the mouse cursor on the icon to show pop-up monitor.
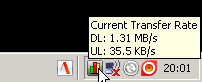
Left-click will do.
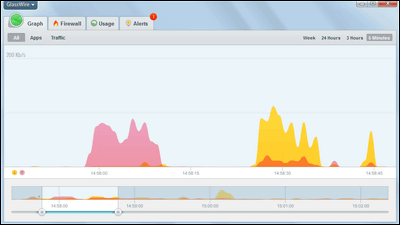
♦Real time Visualization of bandwidth
Click task tray icon and click "Show Graph"
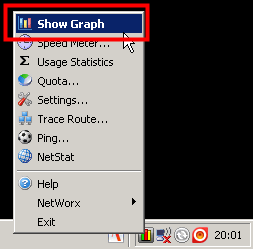
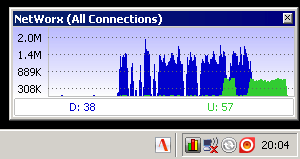
That's it. The blue graph shows download rate and green is Upload. The window is resizable and movable. The position and size of the window will be recorded.
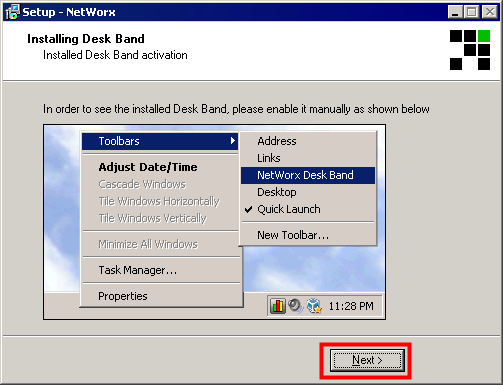
♦Show graph on the task bar
Right click task bar icon and Select "Tool Bar -> NetWorx Desk Band"
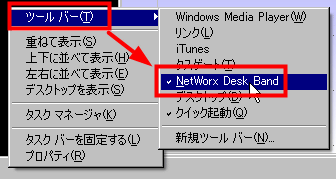
The resizable bandwidth graph will be shown on the task bar.
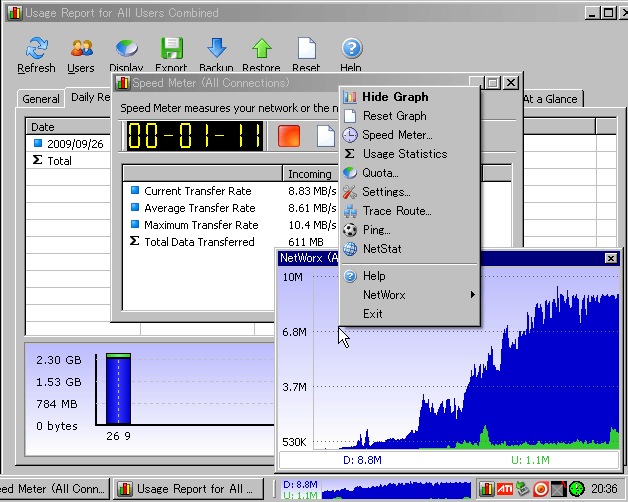
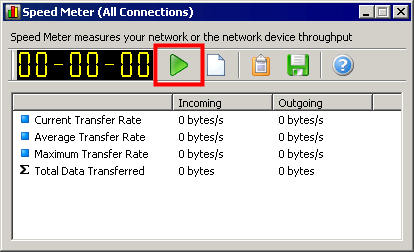
♦Transfer Rate Measurement
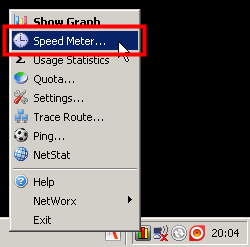
Click "Speed Meter"
Click this button to measure transfer rate.
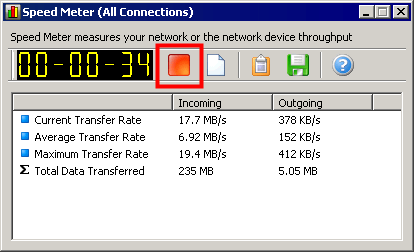
Click again to quit measuring. The report can be copied to clipboard or you can just save it to the text file.
♦Showing Previous Bandwidth Reports
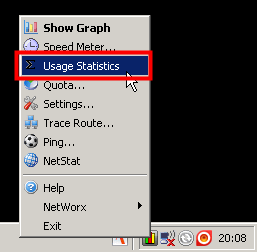
Click "Usage Statistics"
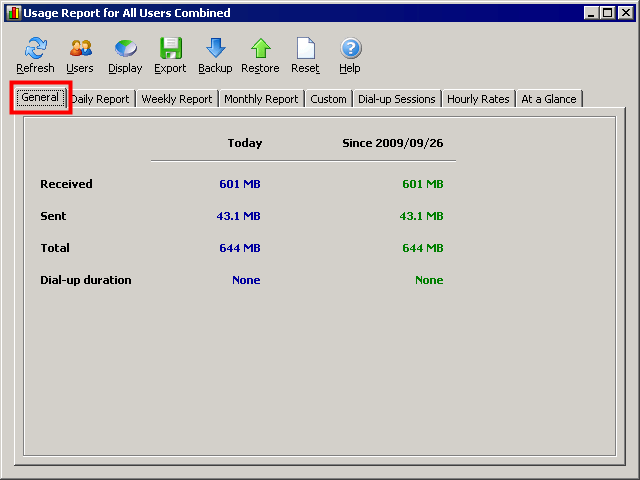
On "General" tab, you can see the whole bandwidth from the day you started using the software, and today's bandwidth.
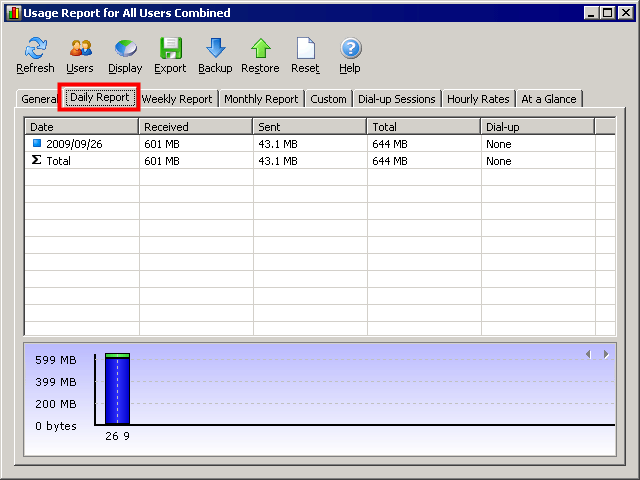
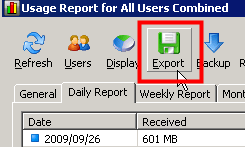
You can see daily report on this tab.
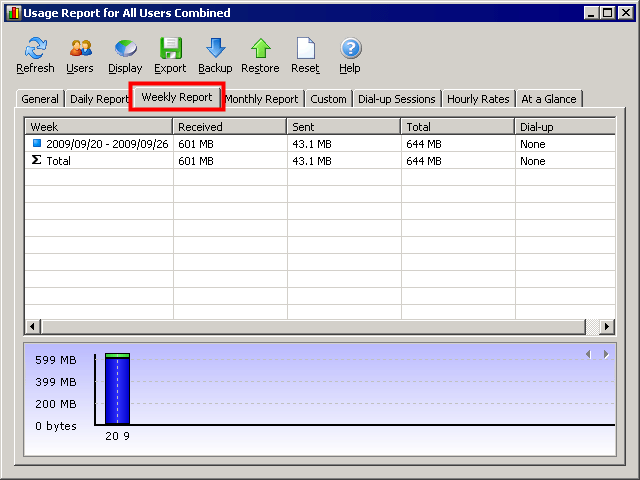
"Weekly Report" is here.
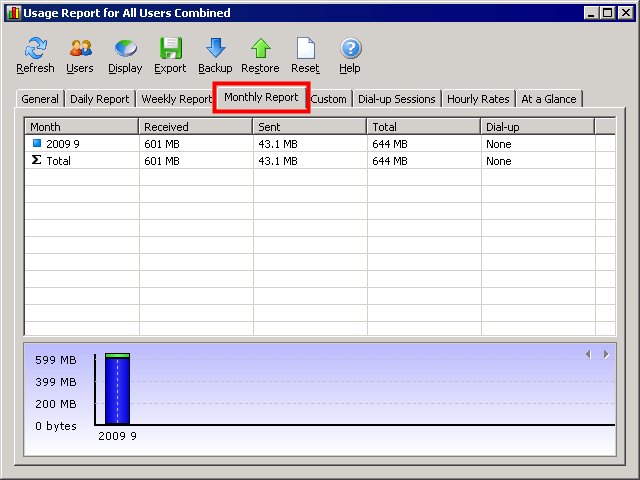
"Monthly Report" is here. Good for re-planning your ISP fee.
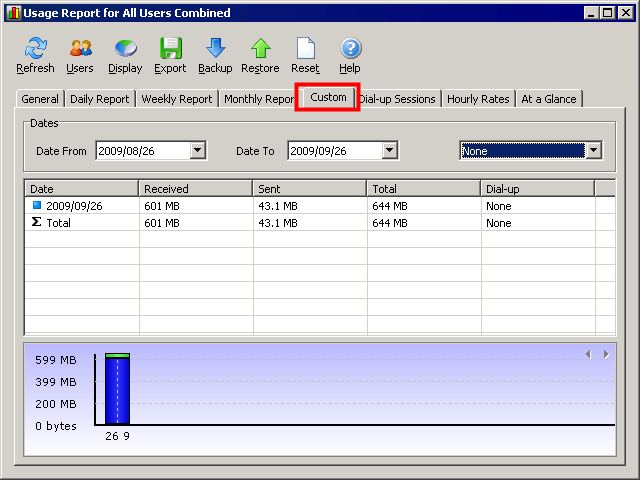
"Custom" enables you to specify the period you want to see the report.
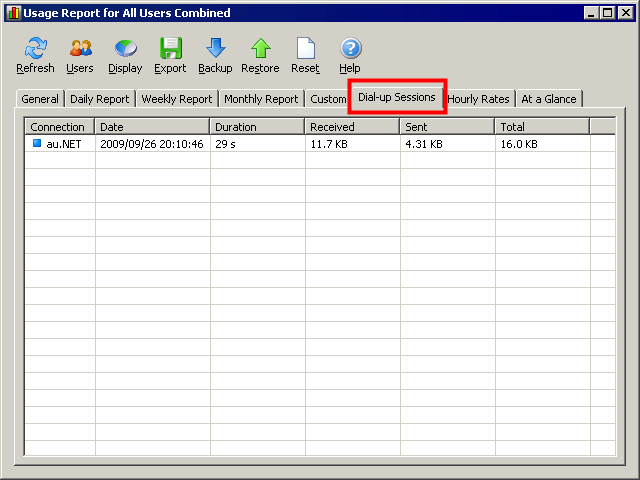
Not only LAN connection, Dial-up via modem is also supported in "Dial-up Sessions" tab.
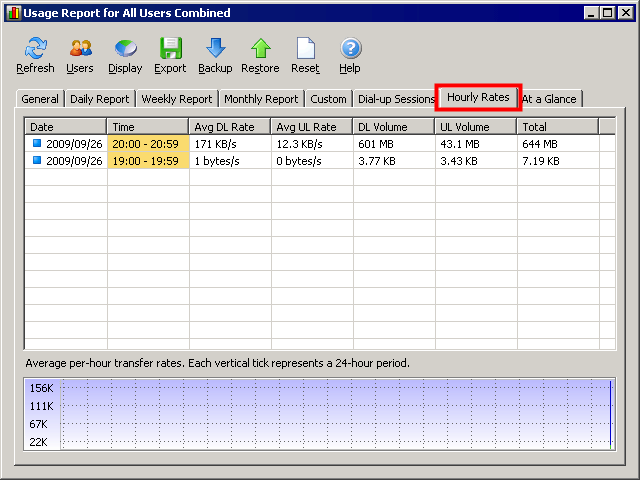
"Hourly Rates" tab.
"Export" button will export the usage report in Excel, Word, HTML, CSV or plain text format.
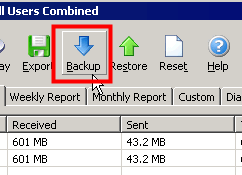
The whole setting will be saved to the file when you click "Backup" button. Click "Restore" and select the backup file to restore the software.
♦Set Warning when you came near the limit
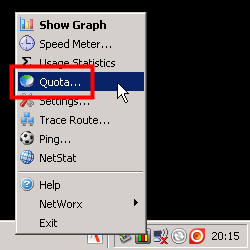
Click "Quota".
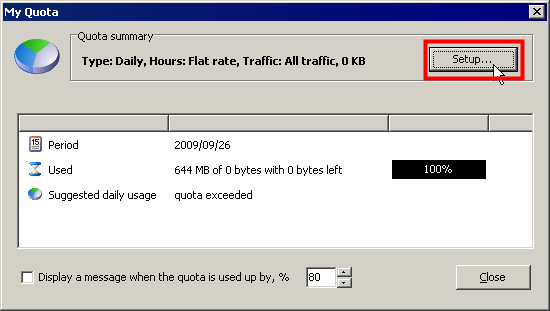
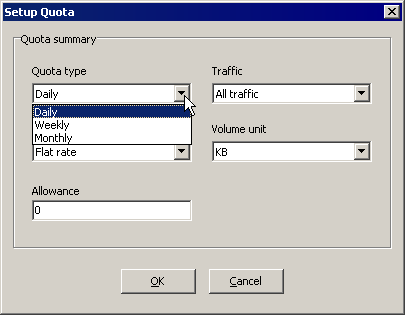
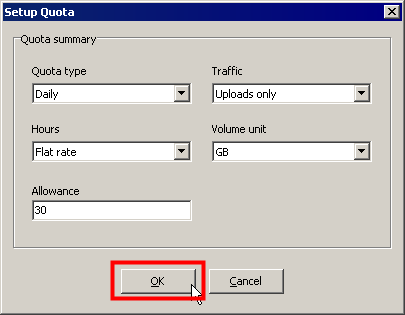
Click "Setup".
Select "Quota type" first, from "daily", "Weekly" and "Monthly"
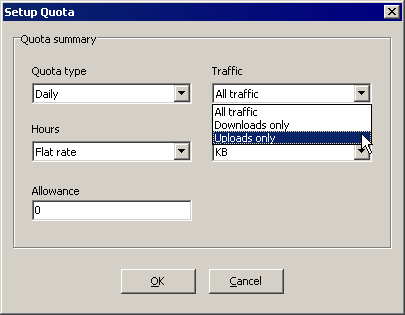
Now select the direction of transfer you want to monitor from "All Traffic", "Download only" and "Uploads only".
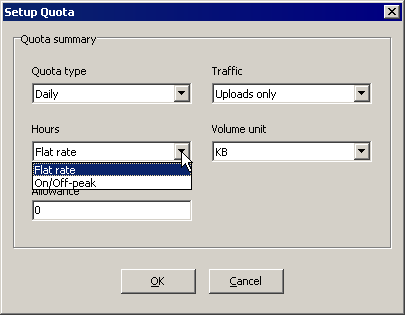
If you have different bandwidth limit in peak hour and off-peak hour, change "Hours", otherwise choose "Flat rate"
Change whichever volume unit you want.
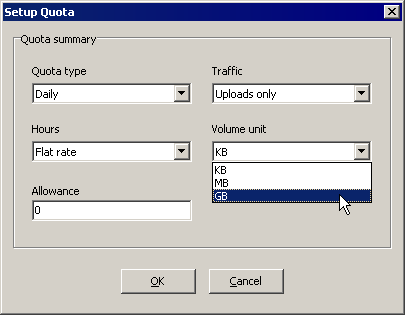
Complete "Allowance" form and click OK to finish basic setting.
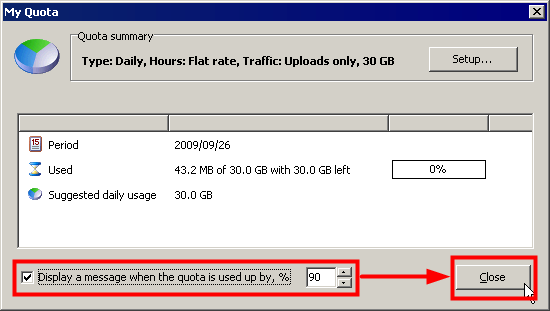
Set the percentage to the limit bandwidth to show notification.
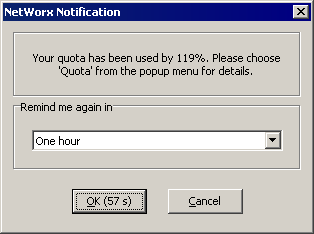
The actual warning.
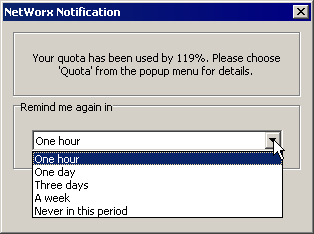
Also has reminder feature.
♦Other useful settings
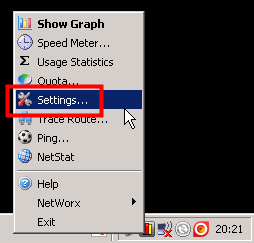
Click "Settings" for miscellaneous settings.
Boot settings. Change here when you want to boot the software with operating systems.
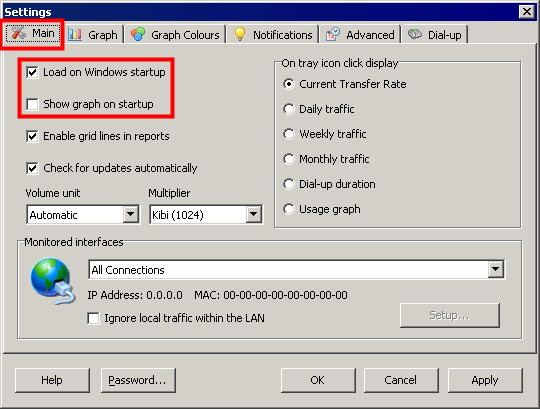
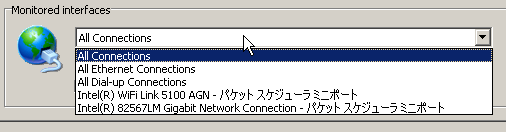
If you want to specify the device you want to monitor, change here.
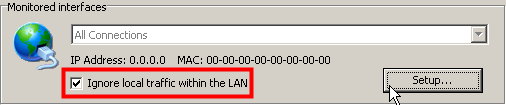
If you don't want to measure traffic to local network, check here.
To restore default visual settings, click here.
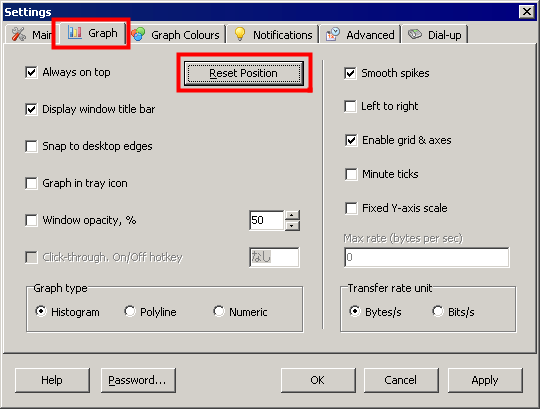
Not only taskbar display, you can change task tray icon to graph. If you want to do so, check here.
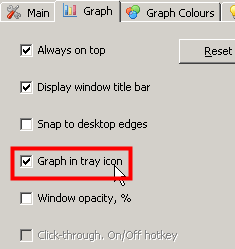
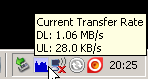
This will make the tray icon like this.
Graph colors can be changed from here.

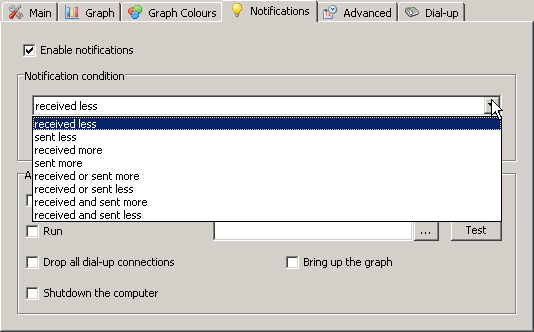
You can custom the action related to bandwidth change here.
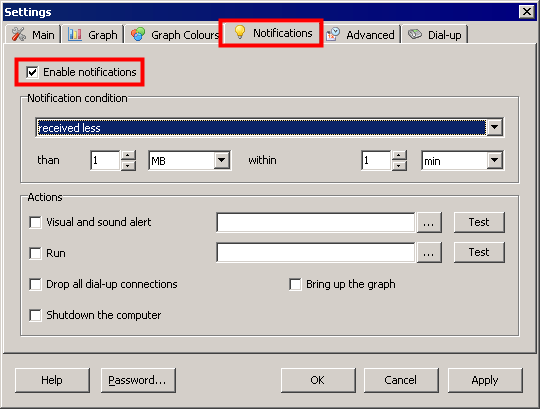
For example, when you upload big video file to YouTube and want to shut down the computer when it's finished, this menu will do.
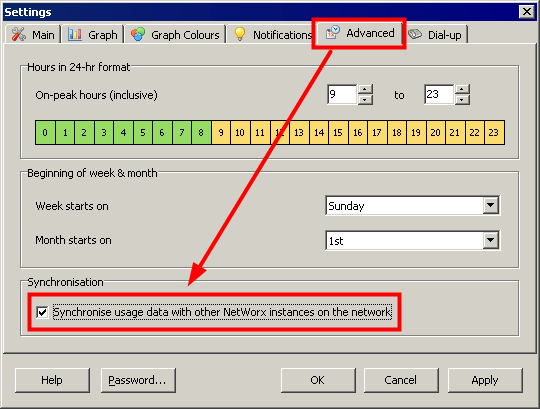
♦Report Synchronization
If you are running multiple machines and using only one WAN connection with bandwidth limit, this feature will make it easier to monitor your network.
To activate the function, just check here. It will use port 8703 to communicate with other machines.
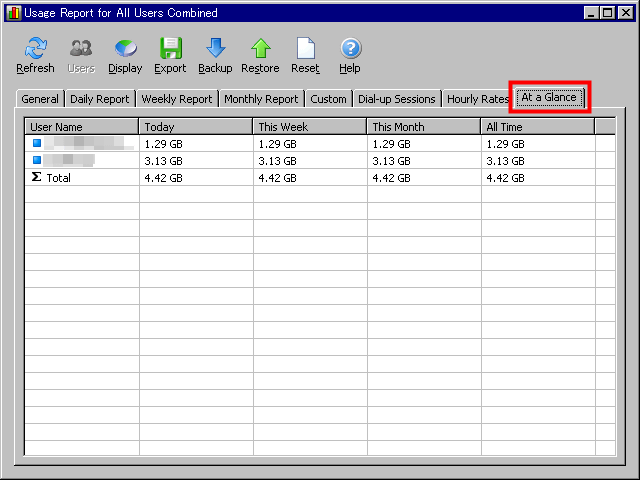
Once you synchronize machines, every usage report will show the total amount of bandwidth used by machines. Of course you can see each machine's condition by changing "Users" button above(the button is clickable when you are looking to periodical reports)
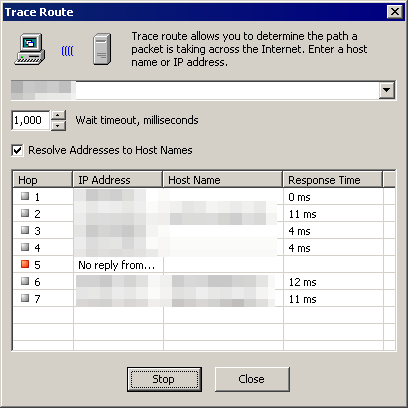
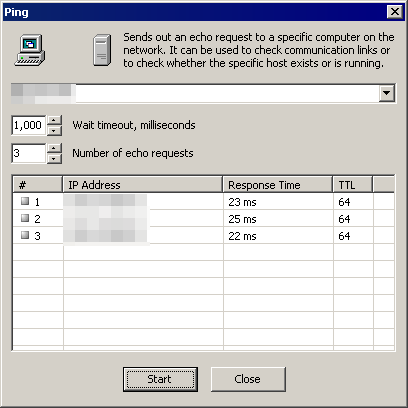
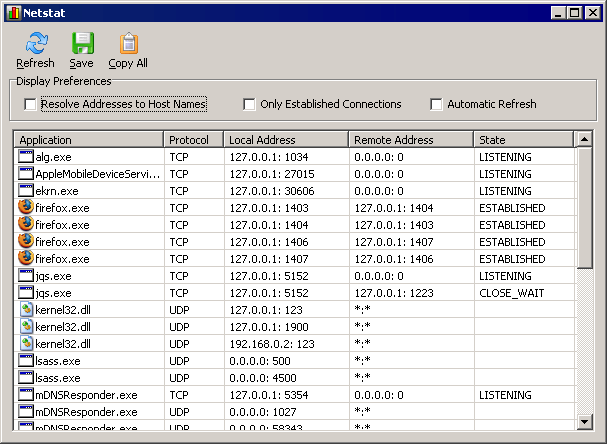
♦Other Network Tools
Common network tools like tracert, ping and netstat are prepared and used via GUI.
Click these function to use it.
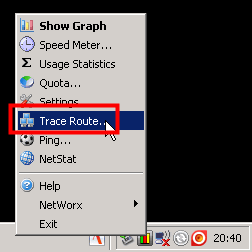
Trace Route result. You don't have to run console to use tracert any more.
Ping result.
Netstat result.
Related Post:
No more outrage; “BlueScreenView” will tell why you got BSoD - GIGAZINE
WPA encryption broken completely: Japanese Academic Researcher implemented falsification attack - GIGAZINE
Which CAT7 cable is the most flexible and easy to handle? - GIGAZINE
“Process Hacker” will help you unveil mysteries of “svchost.exe” - GIGAZINE
Related Posts: