Free high-speed log analysis software "Visitors" that processes 100,000 rows in 1 second
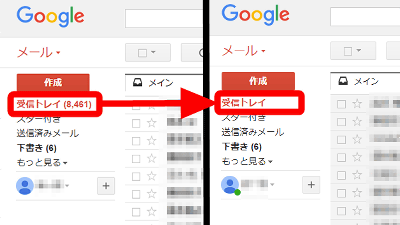
Since the log of GIGAZINE has become enormous amount, I used "ApacheLogViewer"I felt uneasy when considering the daily access analysis takes too much time and further increase in logs in the future, so as a result of various trials,"Visitors"Access log analysis software was super fast and it was nice.
In general, it handles 100,000 lines in about 1 second to 2 seconds. It is also possible to flow flow of people to the site. In addition to analyzing on a unique user base, it is also possible to exclude search bots, or to count up a specific referrer as a black list. It is very wonderful.
Also, not only Linux version, Windows version is provided at once. It is also possible to analyze in Windows if you want to do it.
So, I will make a note of the procedure until actually installing and actually using it. Hopefully it will be helpful.
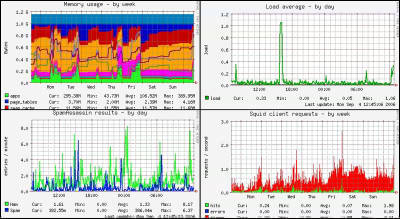
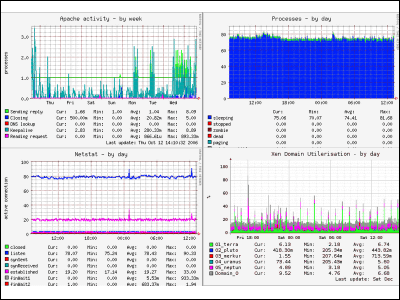
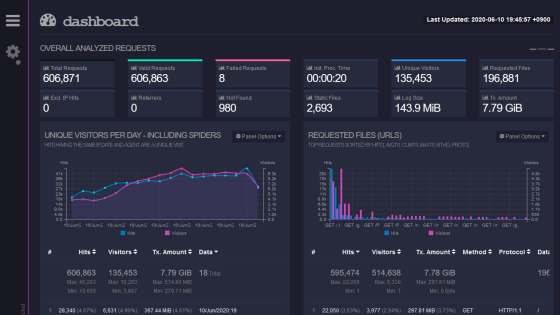
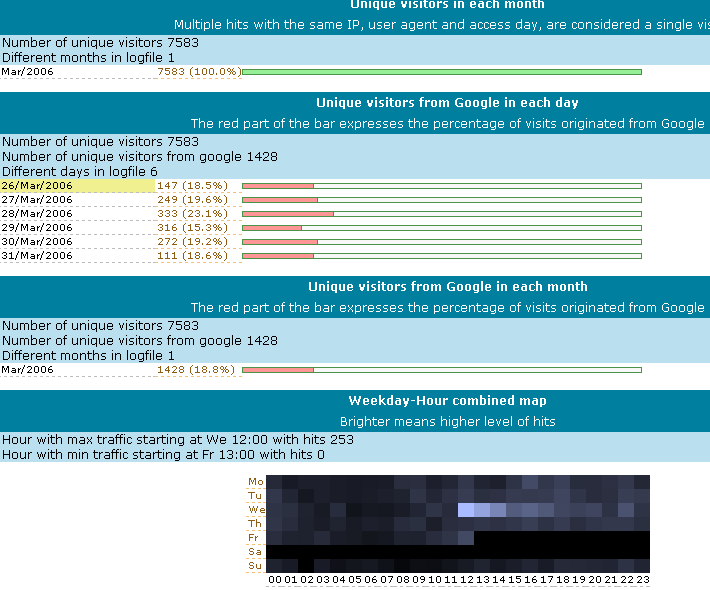
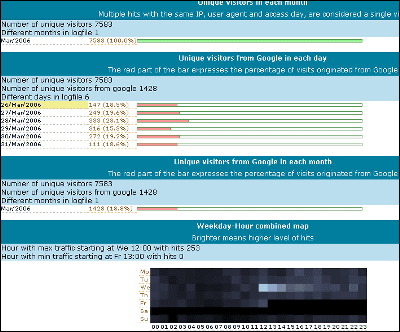
■ Analysis report examples
This is a standard access analysis report. HTML or text can be selected.
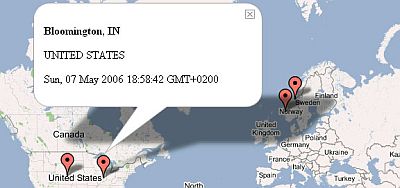
The behavior analysis of the visitor's behavior on the website is made into a flowchart as follows.

■ Installation
Visitors - fast web log analyzer
http://www.hping.org/visitors/index_jp.php
You can download it from the middle of the page. Installation in RHEL 4 is like this. Would not it change so much on other Linux?
wget http://www.hping.org/visitors/visitors-0.7.tar.gz
Tar xvzf visitors - 0.7.tar.gz
Cd visitors_0.7
Make
Cp visitors / usr / bin /
Download it with wget, decompress it with tar, go to directory "visitors_0.7" after decompressing, execute make and generate the created "visitors" file to / usr / bin / That's it. Basically this alone.
■ How to use
Actual usage is listed on the official page as "example", but for more detailed usage see the documentation.
Visitors, on line documentation for 0.7
I will use it like this.
Visitors - A - m 30 access.log - o html> report.html
"-A" means attaching all the options, meaning that it has the same meaning as adding multiple options "-GKUWRDOB" in addition to basic analysis information such as page view and unique user. This allows you to analyze Google and AdSense crawlers, analyze search phrases from Google, user agents, weekly time-series access maps, referrers, domains, OSs, and browsers. "-m" means the maximum number of items to display, this time it is "30", so the top 30 items are displayed for each item. "Access.log" specifies a file to be analyzed for each environment. Multiple specifications such as "access.log. *" Are also possible. "- o" means to output the result to a file, and "html" or "text" can be chosen. This is output as "report.html" at the end.
To analyze the usage pattern of your site, how much it is coming from circulation and external links on internal links, how much it is coming from Google, etc.
visitors -A -m 30 access.log -o html --trails --prefix http://gigazine.net > report.html
"--trails" is an option to analyze usage pattern, after "- prefix", enter the domain of your site address to be targeted. By doing this, you can see how the page is being patrolled. You can see how many people get to a specific page on what route.
However, it is hard to understand if this is the only one, so let's display it as a flow chart display.
■ Flow chart generation by Graphviz
First, download and install Graphviz from the following page. It can install even with yum etc.
Graphviz
http://www.graphviz.org/Download..php
In the case of RHEL 4, it is like this.
wget http://dag.wieers.com/rpm/packages/graphviz/graphviz-2.2-1.2.el4.rf.i386.rpm
Rpm - ivh graphviz - 2.2 - 1. 2 .el 4. Rf. I 386. Rpm
First of all, we create "graph.dot" which is the source of the flowchart creation.
visitors access.log --prefix http://gigazine.net -V > graph.dot
Then I will create a PNG image.
Dot - Tpng graph.dot> graph.png
Completion with this alone. Is it easy?
■ Devices for actual operation
It is easy to register this series of commands as shell script to Cron if you actually want to analyze the log every day, but in the case of GIGAZINE the date to be output is dated in the output file. Excerpts are as follows. "Date - date '1 day ago' +% Y% m% d`" is the part of date processing.
visitors -GKZWMRDXYS -m 30 access_log --trails --prefix http://gigazine.net -o html > `date --date '1 day ago' +%Y%m%d`report.html
visitors access_log --prefix http://gigazine.net -V > graph.dot
Dot - Tpng graph.dot> `date - date '1 day ago' +% Y% m% d` graph.png
With this, the numerical values such as "20070304" appeared at the beginning of the file name, making management easier. "1 day ago" is attached because the analysis log on March 5 is the access log of March 4th, so we have returned the date one day ago.
Related Posts: