I tried using 'PostHog', which allows easy introduction of session replay and A/B testing, and is open source and self-hosted.
PostHog - The open source Product OS
https://posthog.com/
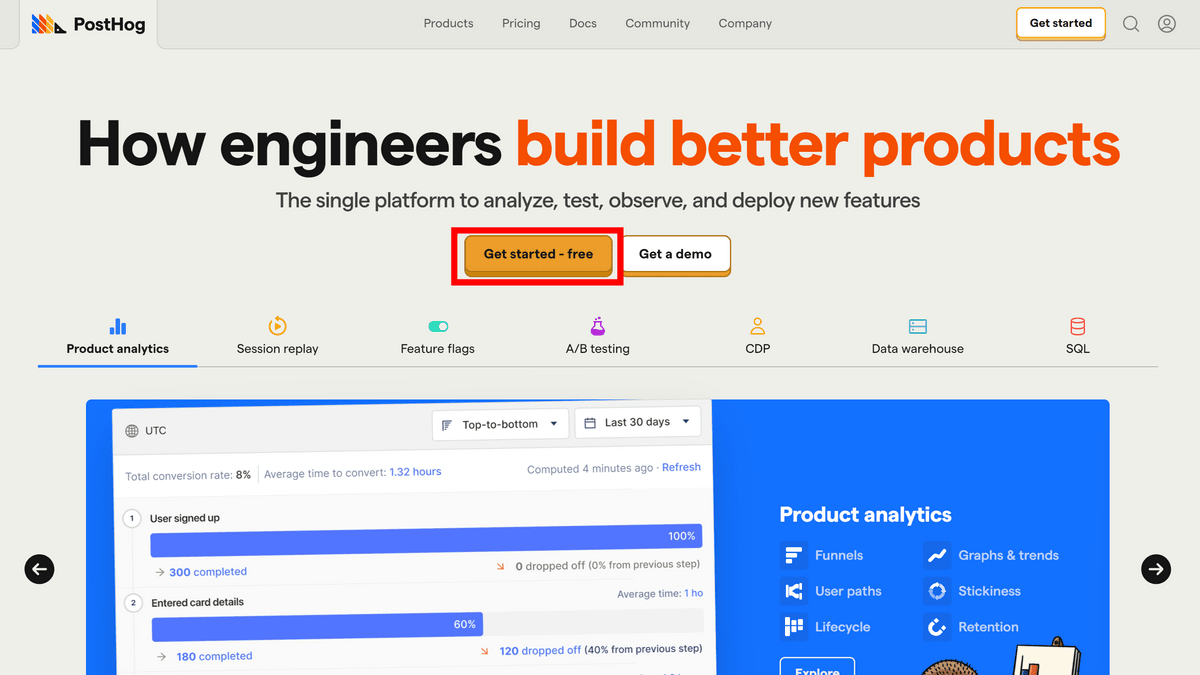
Access the PostHog home page and click 'Get started - free'.
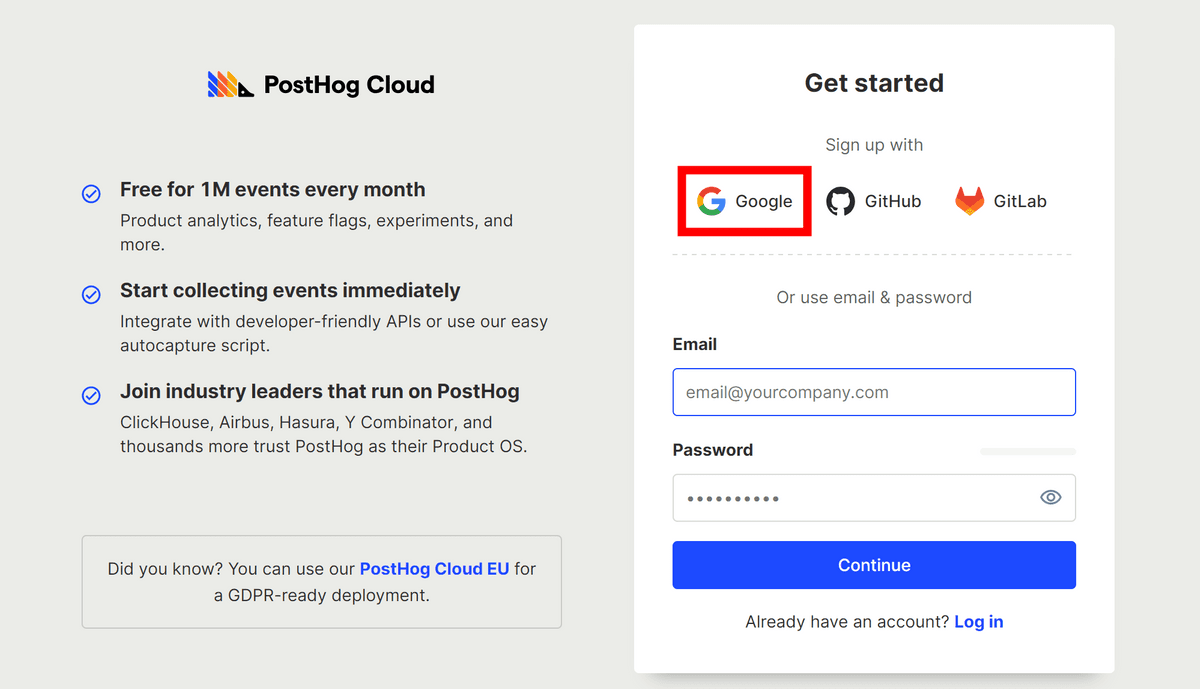
You will be asked to register for an account. This time, we will register using a Google account, so click 'Google'.
Select the account you use to log in.

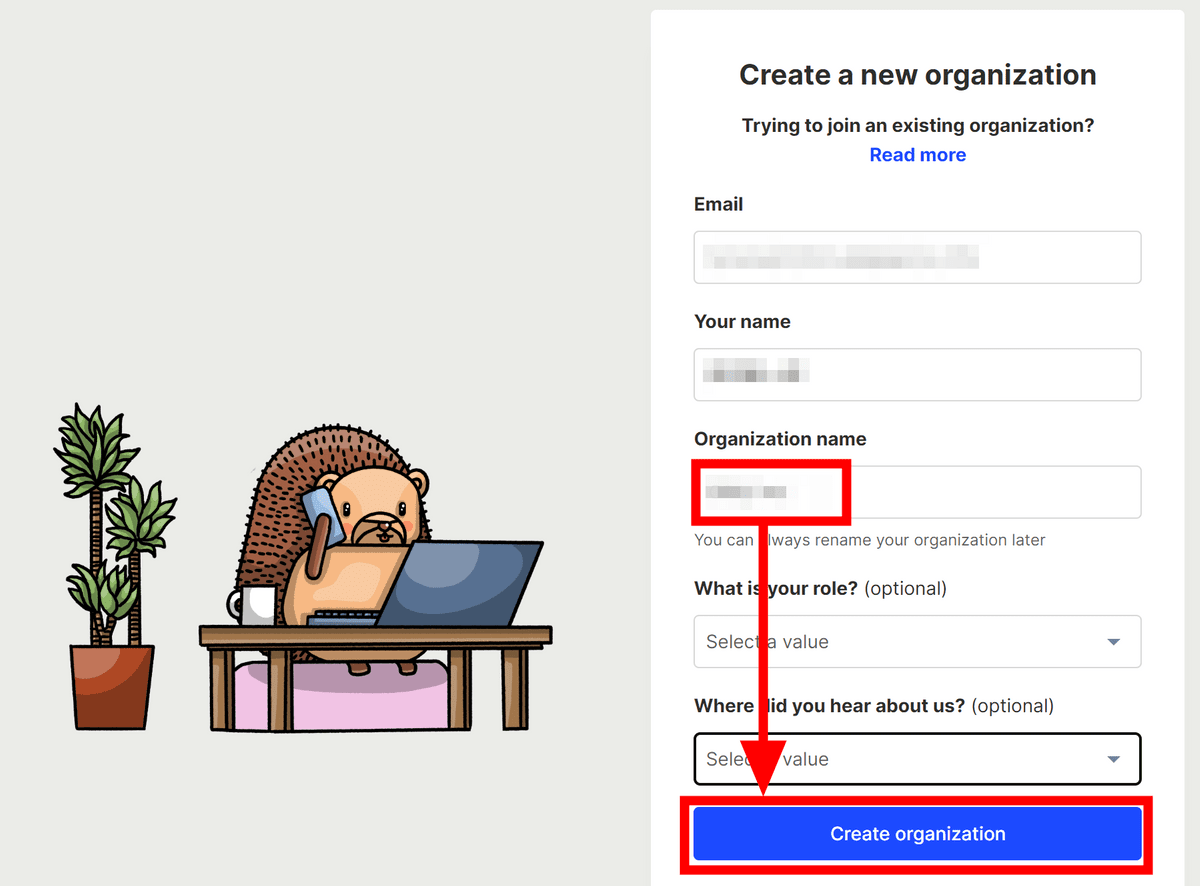
You will be asked to create an 'organization', so enter the organization name and click 'Create organization'.
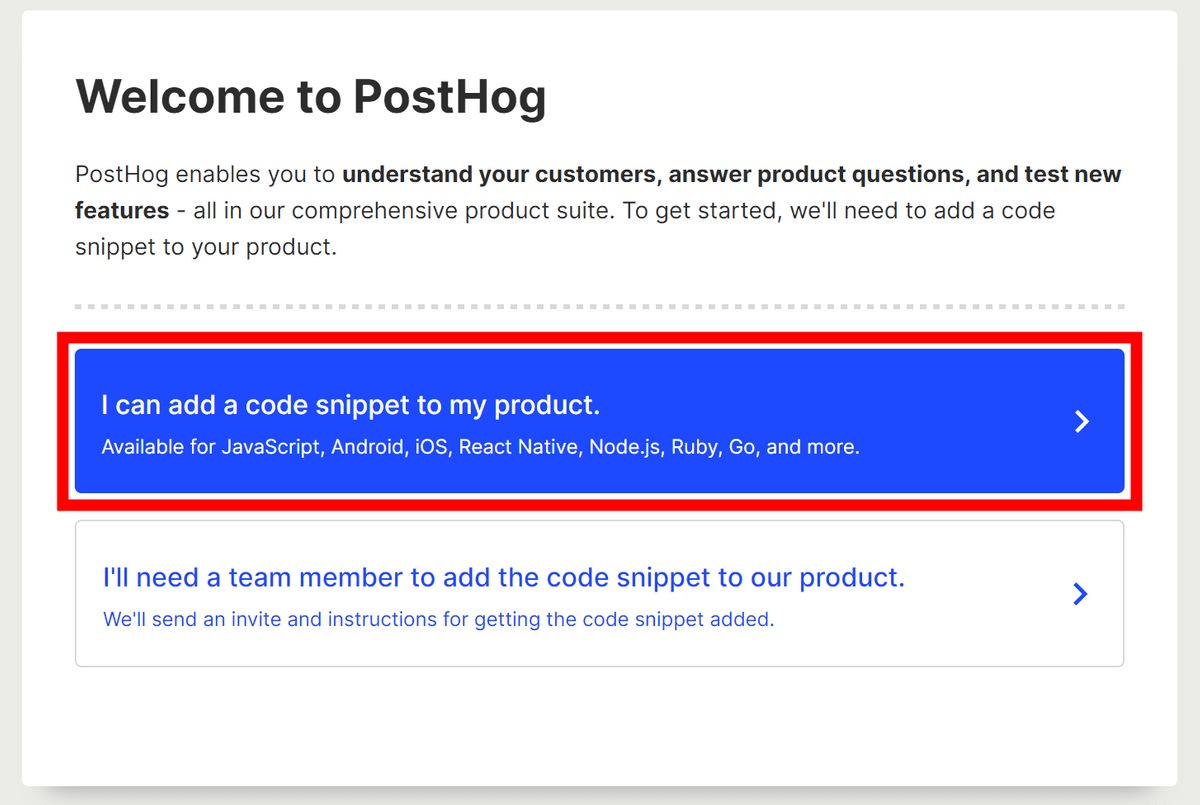
Registration is now complete. You'll have the option to add the code yourself or invite a team member. This time I chose to add the code myself.
Select where you want to aggregate events. This time, select 'web'.

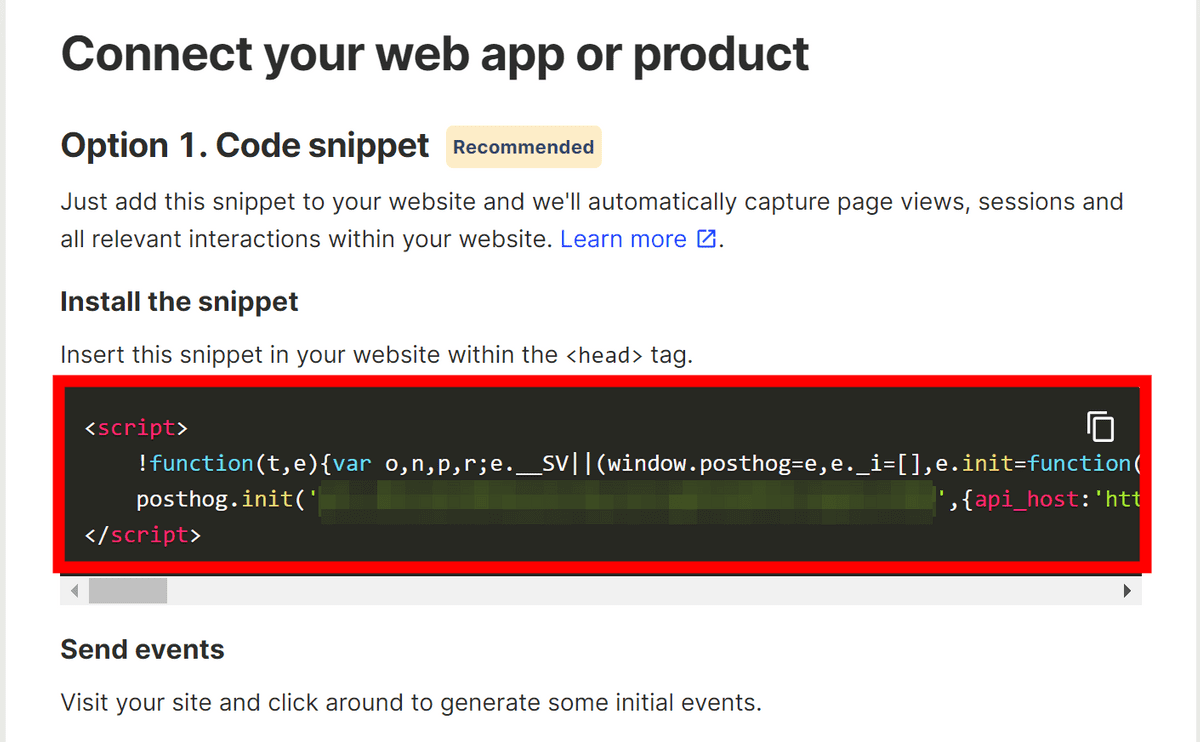
The code will appear; copy it and place it inside the 'head' tag of your website.
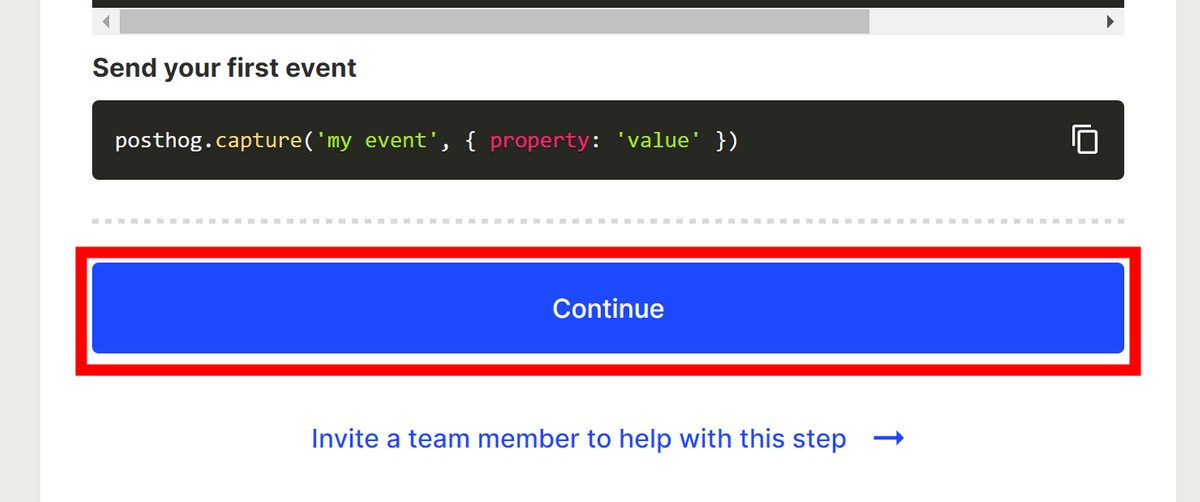
Scroll and click 'Continue'.
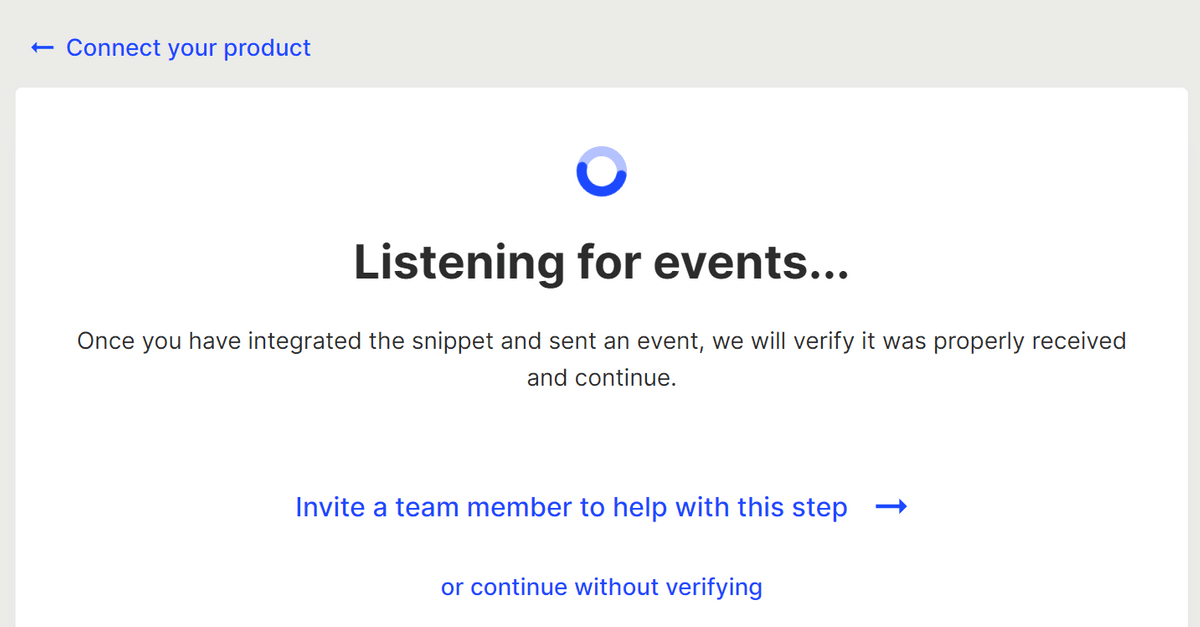
Since it will be waiting for an event, open the page where you installed the code.
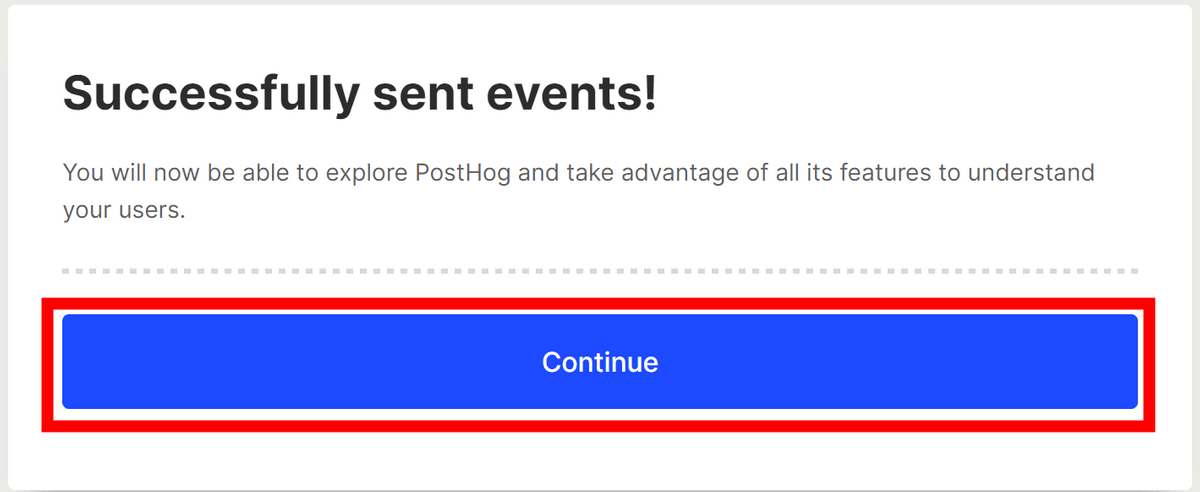
If the code is working correctly, an event will be sent when the page is opened, and the screen will change to the successful sending screen as shown below. Click 'Continue'.
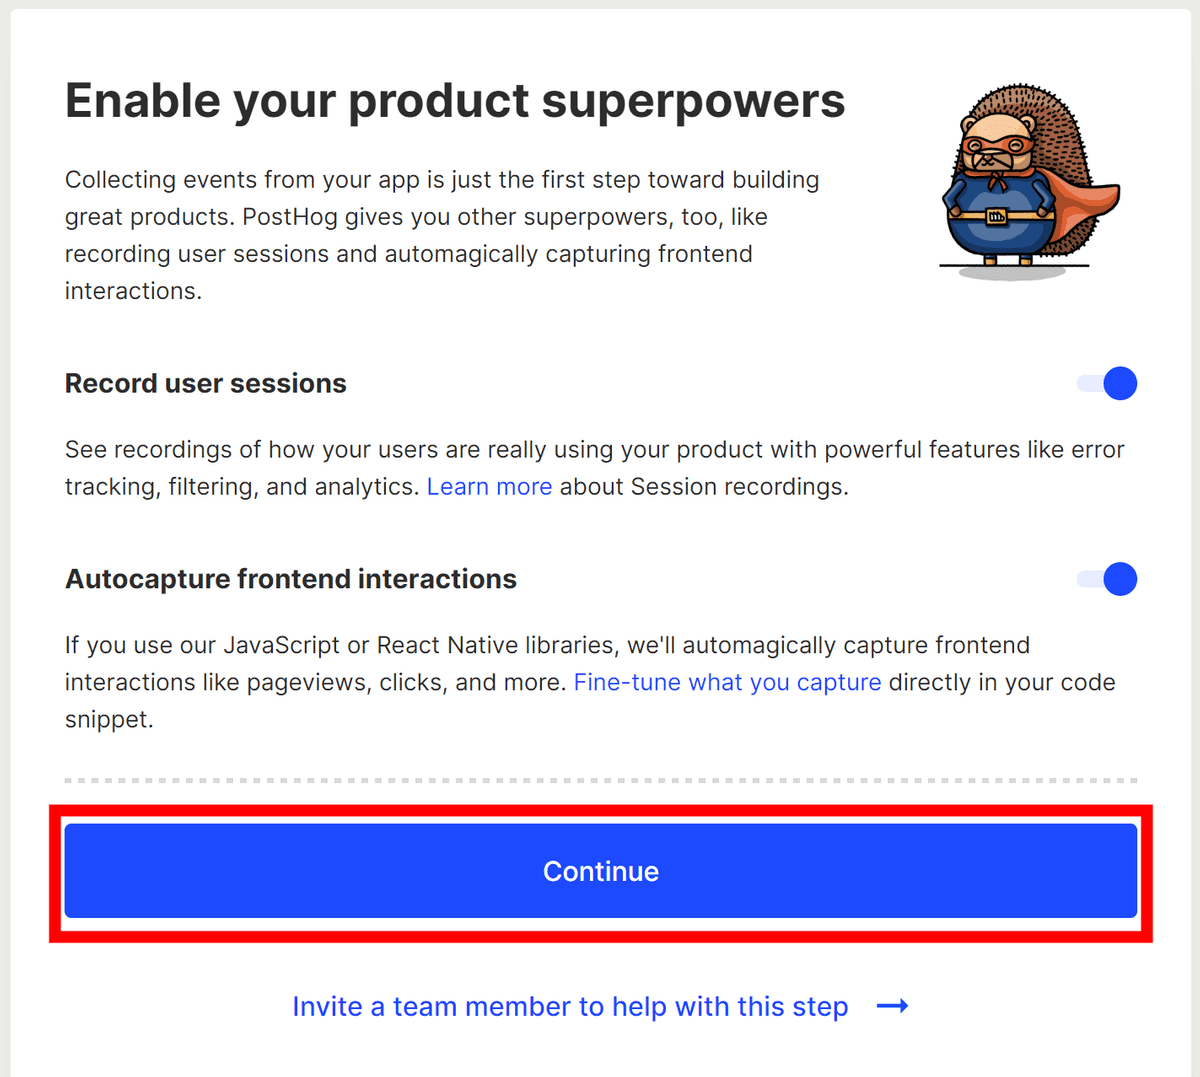
The settings screen for recording sessions and capturing user actions will be displayed. Since it is turned on by default, click 'Continue' without changing any settings this time.
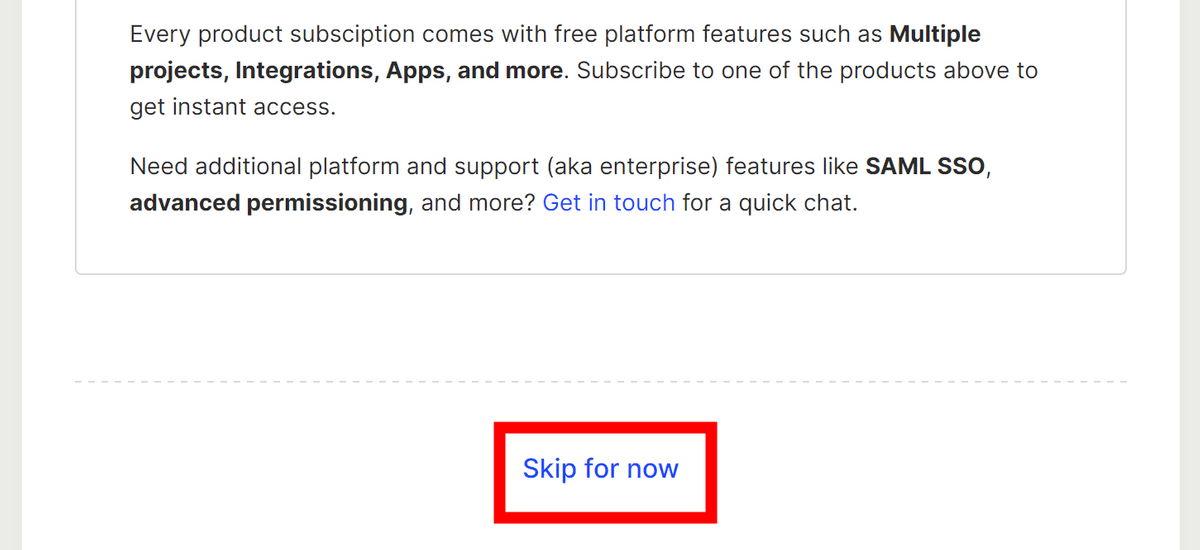
The screen now shows you what features are available when you upgrade to a paid plan.

Scroll to the bottom and click 'Skip for now'.
You will be redirected to the project's Event Explorer page. This page seems to be able to list event information such as page views and clicks.

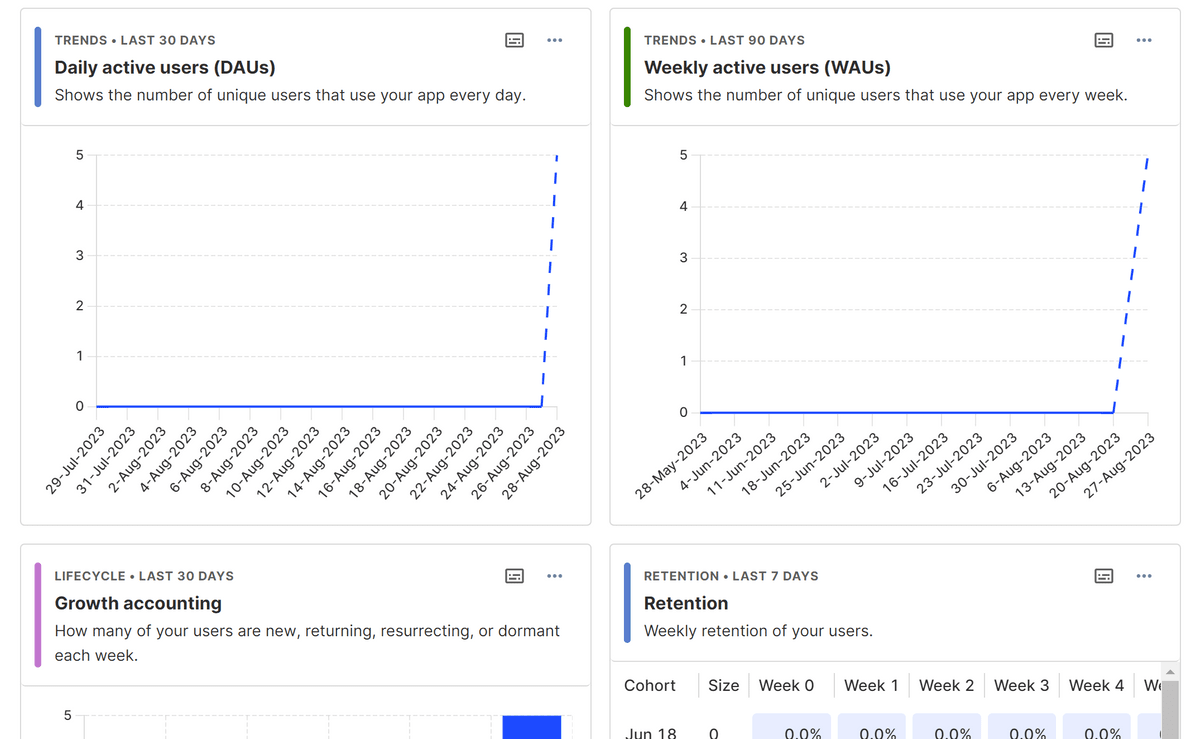
Click 'My App Dashboard' from 'Dashboards'.
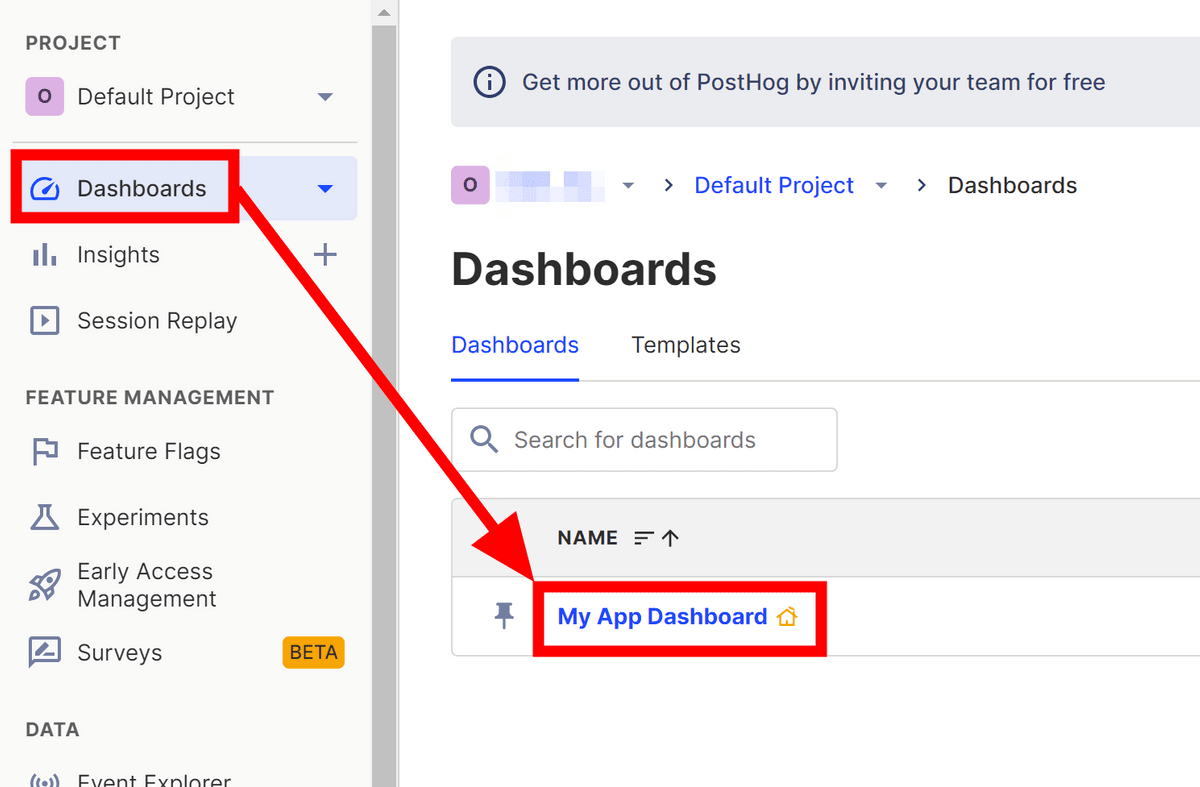
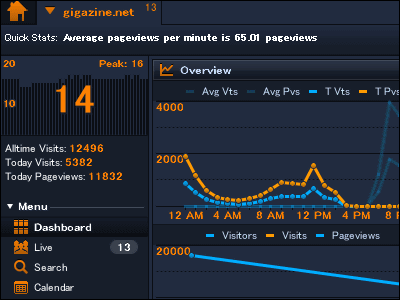
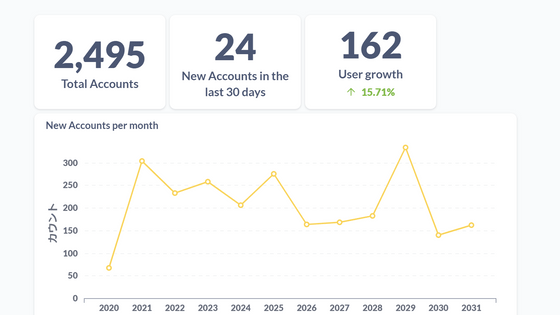
I was able to check metrics such as the number of daily active users, weekly active users, number of new users, and retention in graph format.
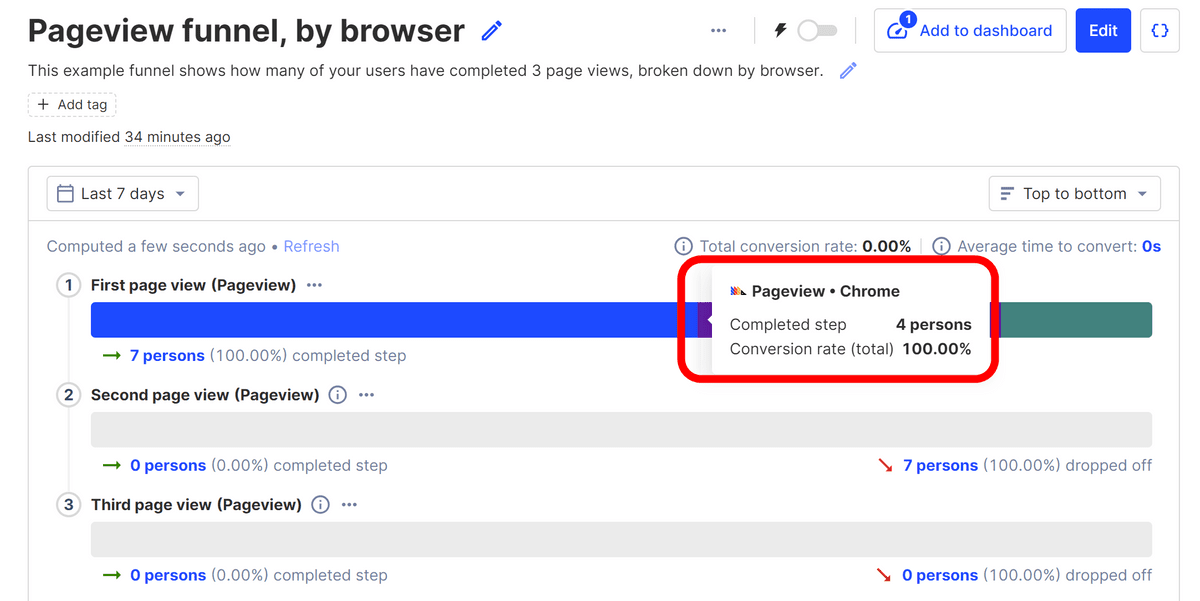
If you want to see more details about each of the above indicators, click on the desired one from 'Insights'. Click on 'Pageview funnel, by browser'.

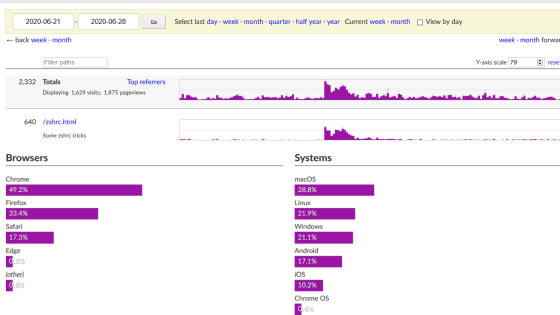
We were able to see information such as page views by browser and the number of people who accessed the site multiple times.
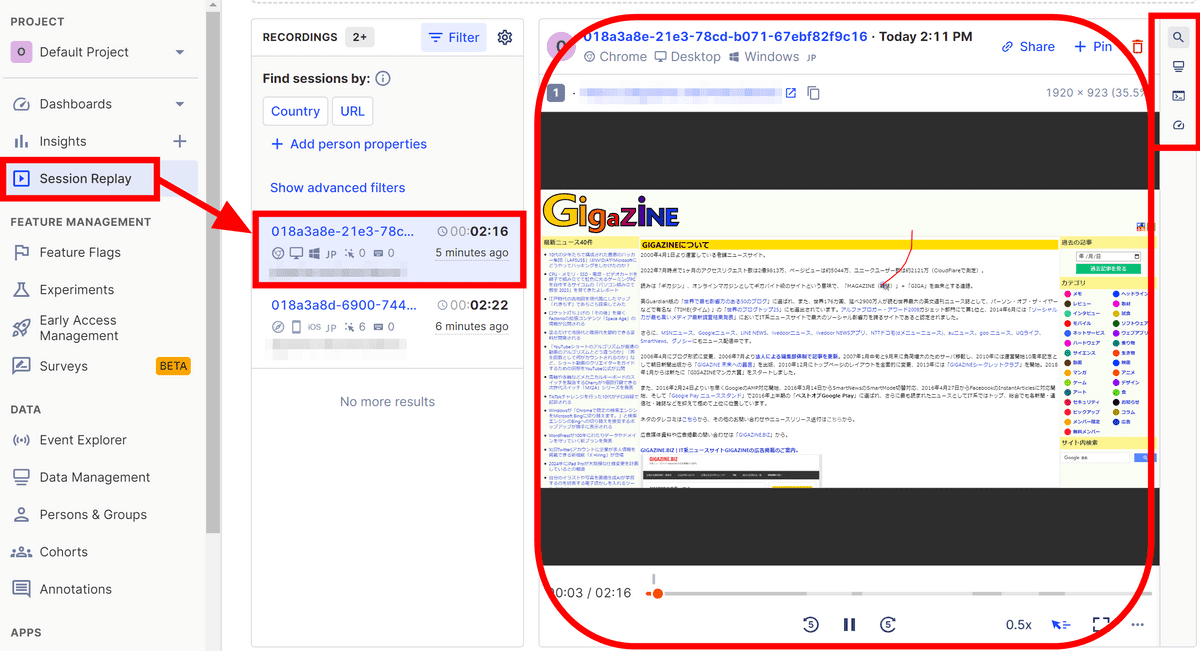
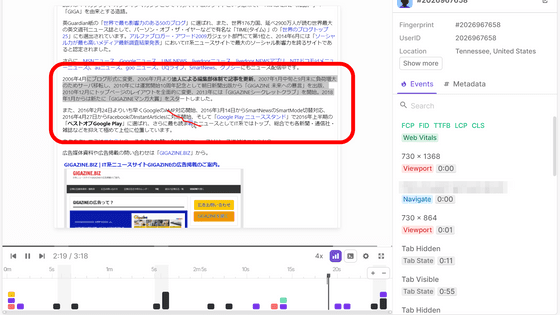
'Session Replay' allows you to check what actions the user was taking. By clicking on a session on the left, you can check the mouse movements, scrolling, clicking, and other actions performed by the user in that session in a movie. Move the cursor to the menu in the upper right corner.
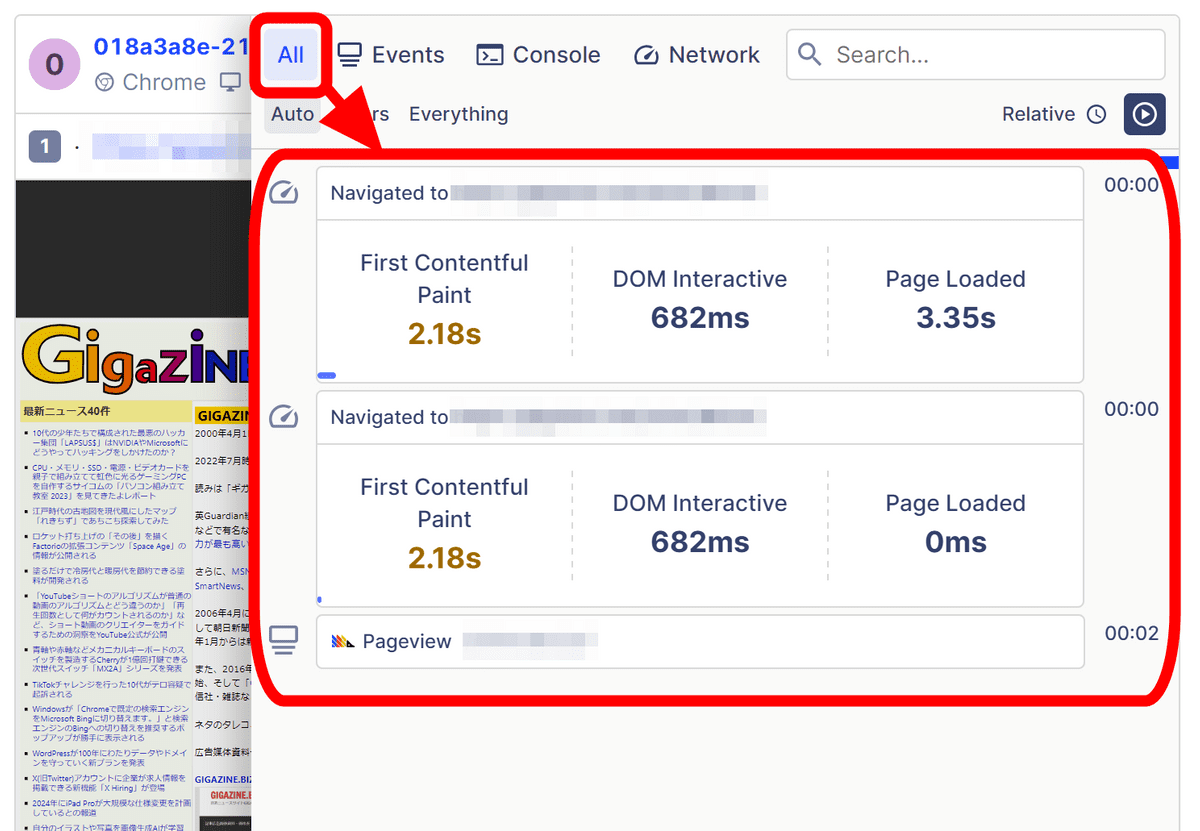
Then, indicators of the time it took to load the page, the content output to the console, the events that occurred, etc. were displayed with timestamps. In the initial state, 'All' is selected and all information is displayed, but you can also display 'events only', 'console output only', and 'network information only'.
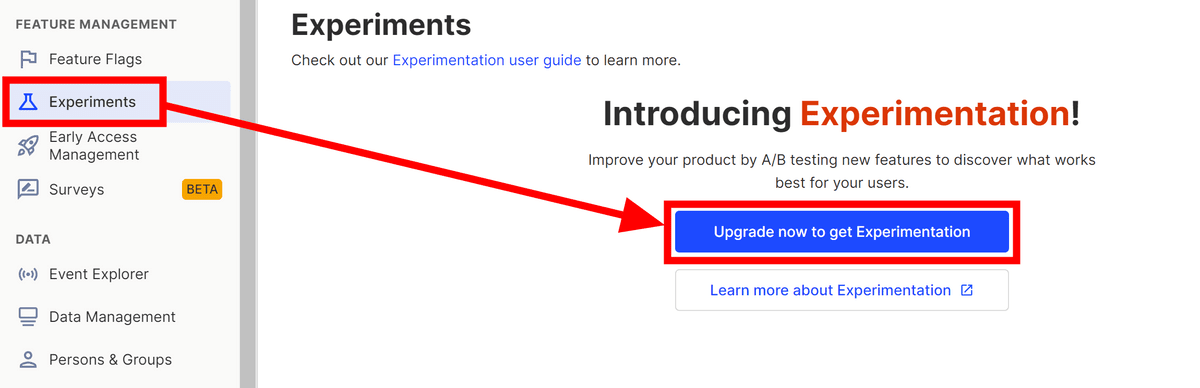
PostHog has a function to perform A/B testing, so I will try it out. Click 'Experiments' and you will be asked to upgrade your plan, so click 'Upgrade now to get Experimentation'.
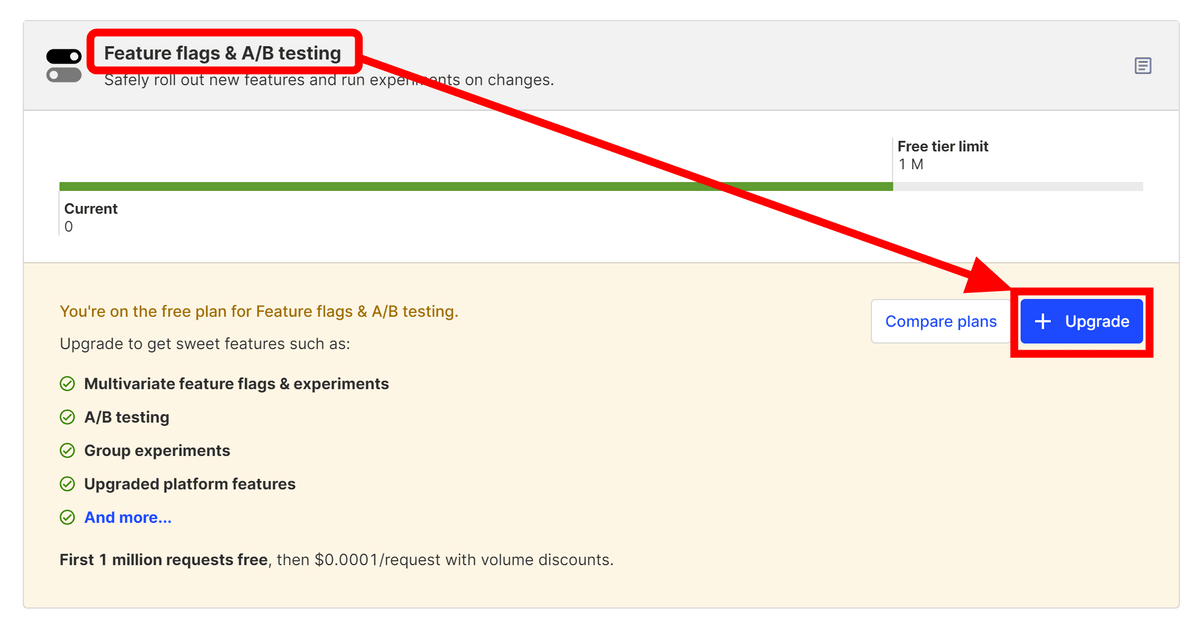
Various features will be displayed, so click 'Upgrade' in the 'Feature flags & A/B testing' item.
Enter your email address and credit card information and click 'Pay.' A charge of $0.5 (about 73 yen) will be charged to your card, but this will be refunded immediately to confirm the validity of your card.

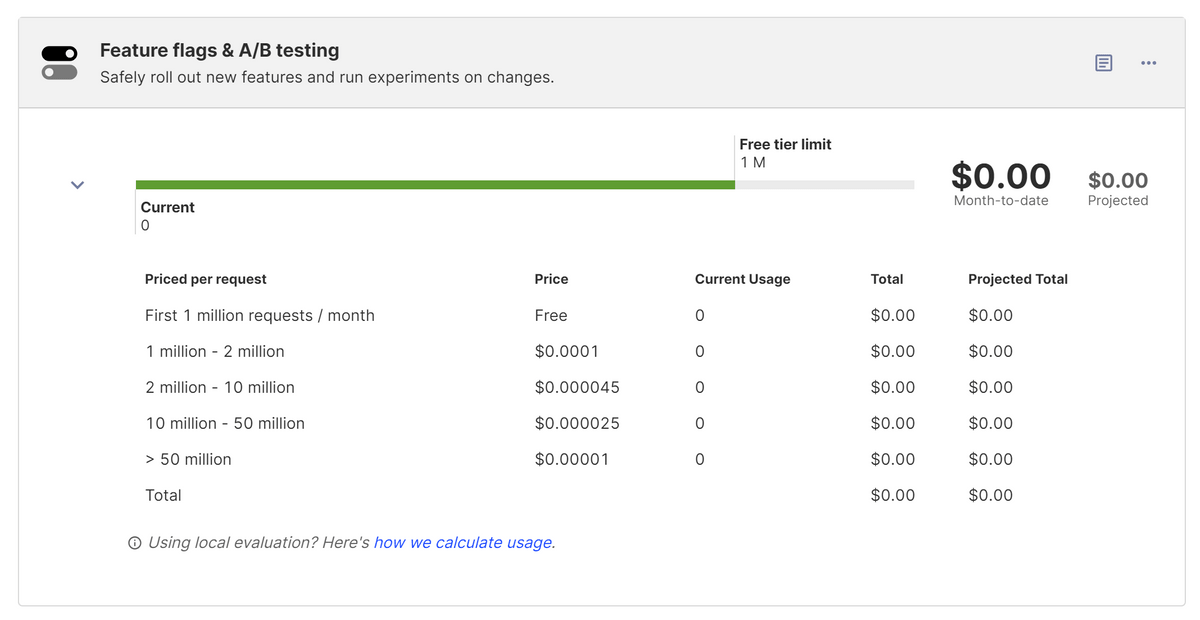
If you successfully register your credit card information, a price list will be displayed as shown below. The first 1 million accesses each month are free, and you are only charged for excess access.
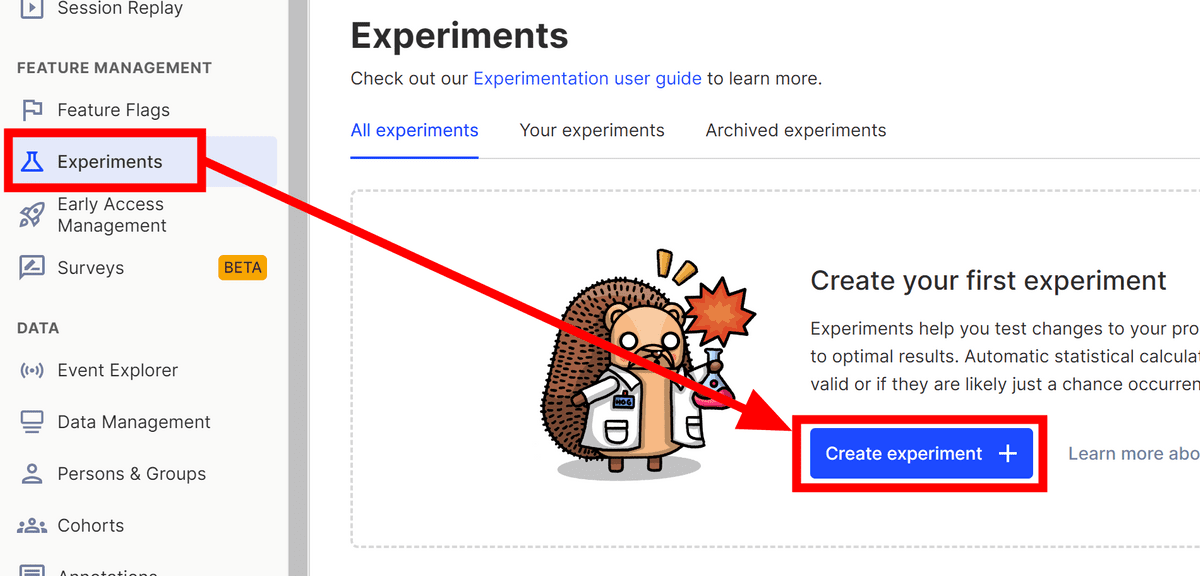
Let's start setting up the A/B test. Click 'Experiments' and click 'Create Experiments'.
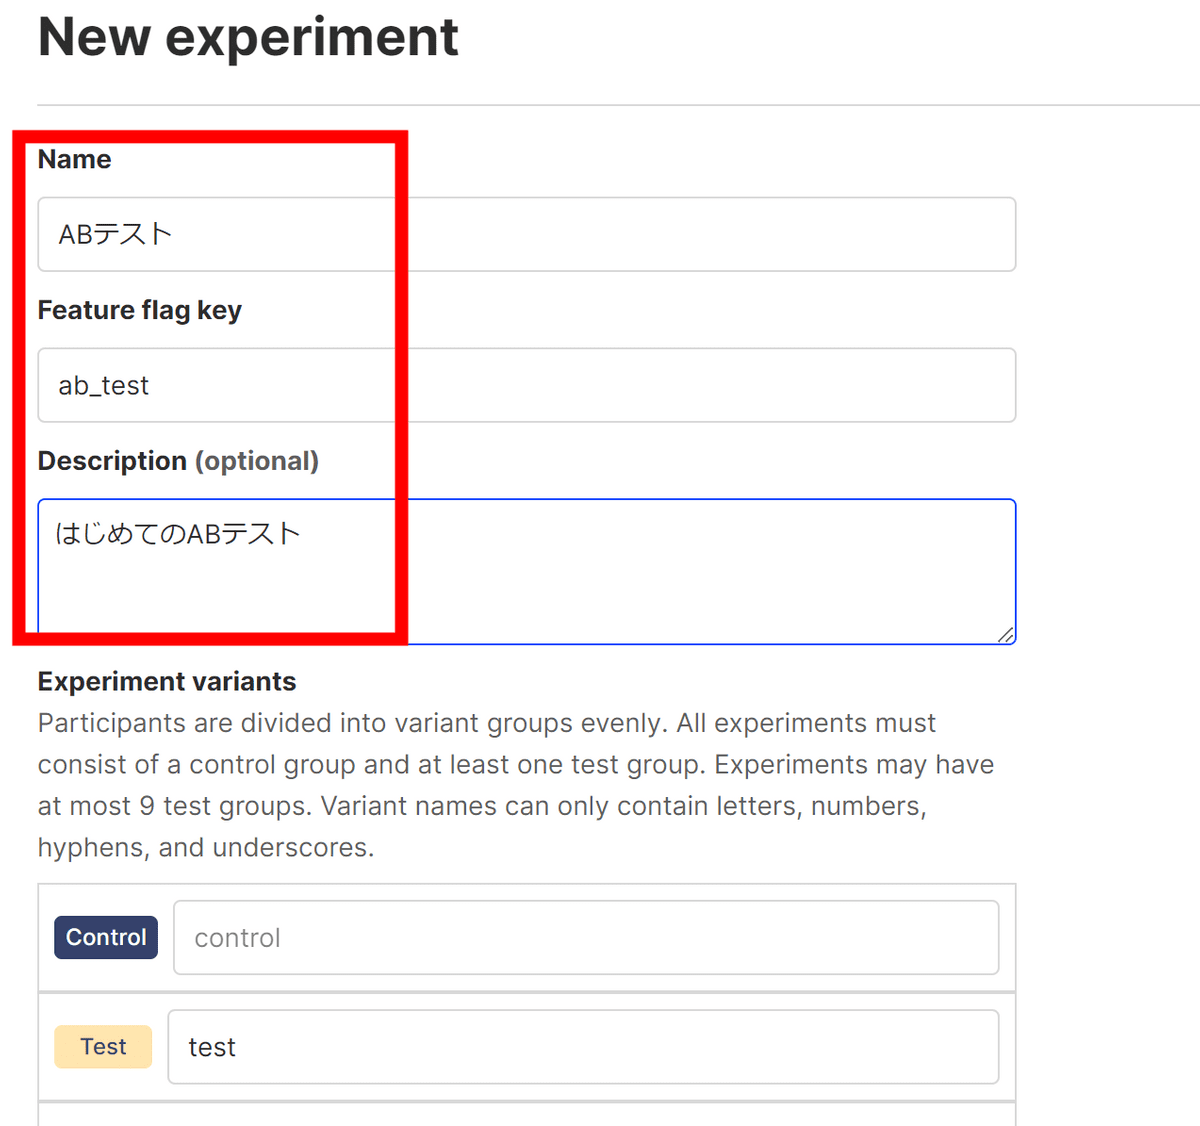
Decide on a name and key for the experiment, and enter a description.
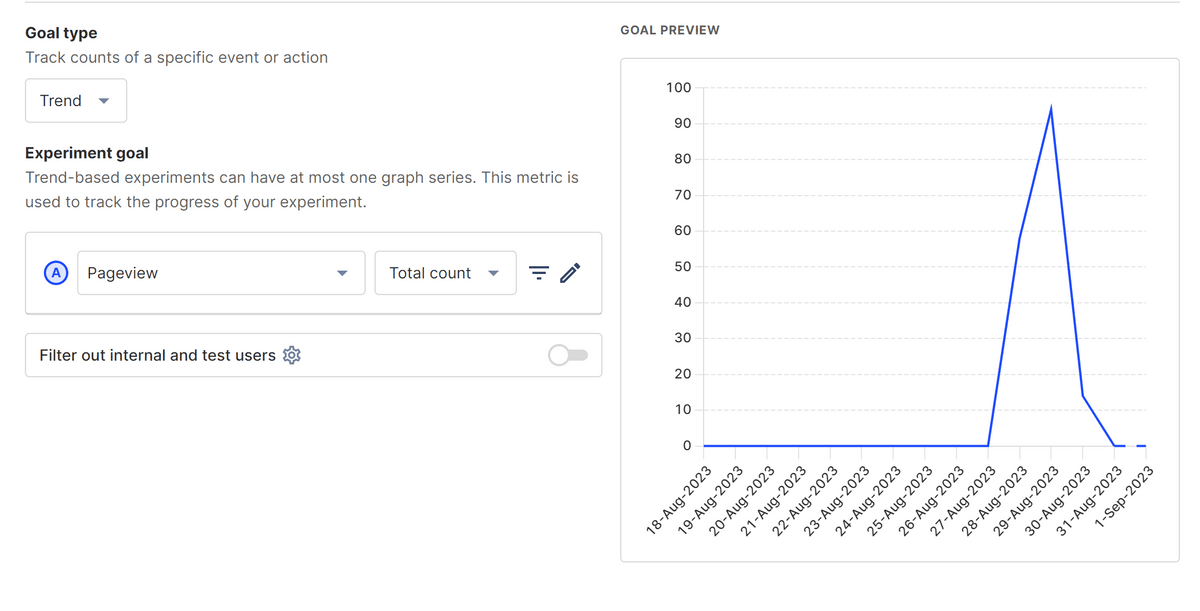
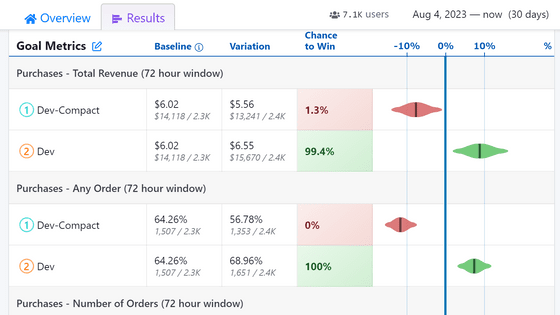
There are two types of experiments: ``Trend'', which looks at the top and bottom of the numbers, and ``Conversion Funnel'', which looks at the dropout rate on the path to conversion. This time, we will conduct an experiment to see the trends of 'Pageview'.
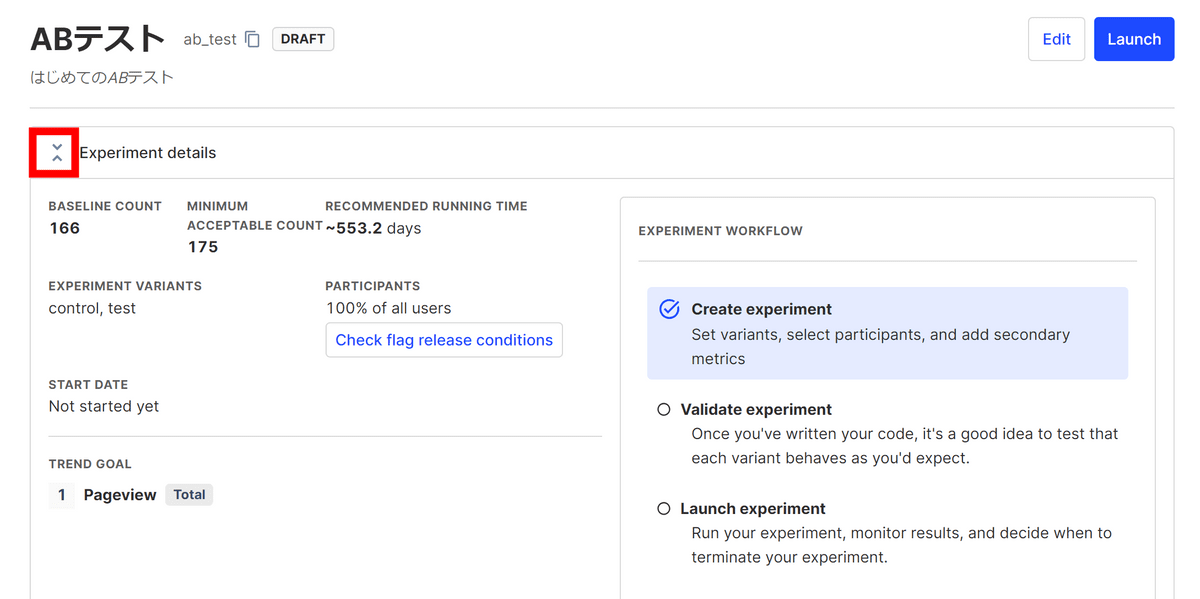
Once you set the threshold for finalizing the experiment results, the number of days required to complete the experiment will be calculated. Click 'Save as draft'.

It was saved as a draft. Close the experiment details using the button to the left of 'Experiment details'.
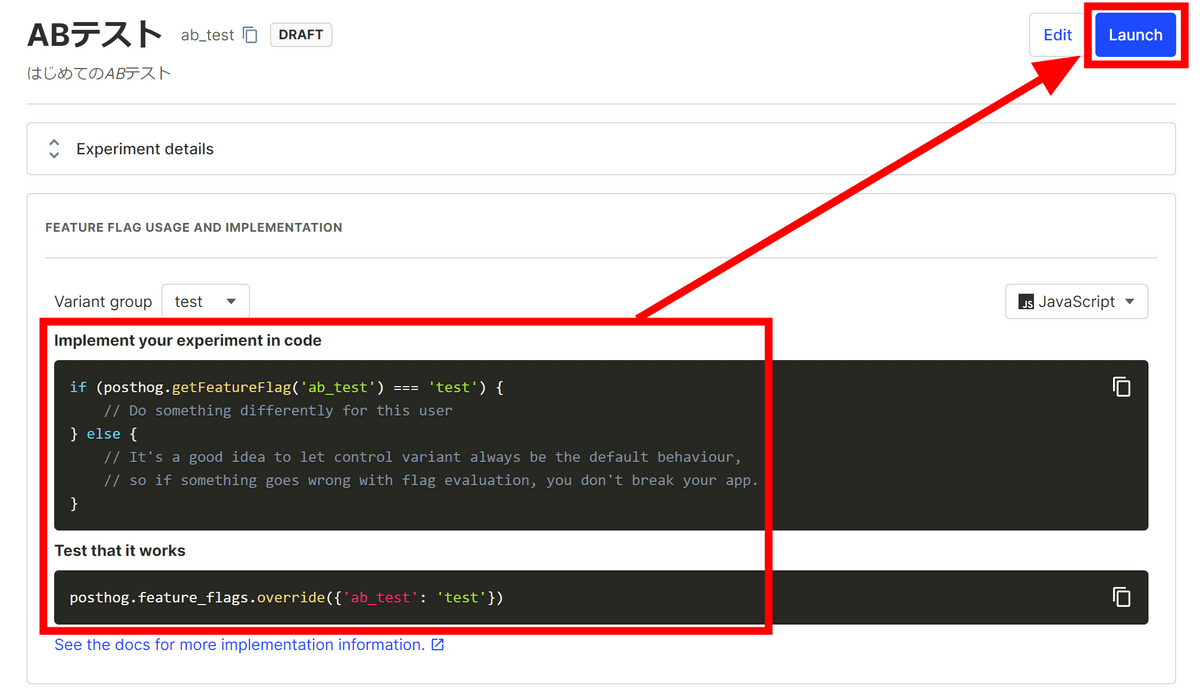
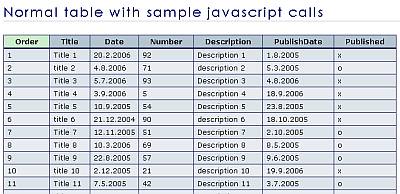
A code example will appear below, so use this code as a reference to introduce the pattern you want to test to your site. Once installed, click 'Launch'.
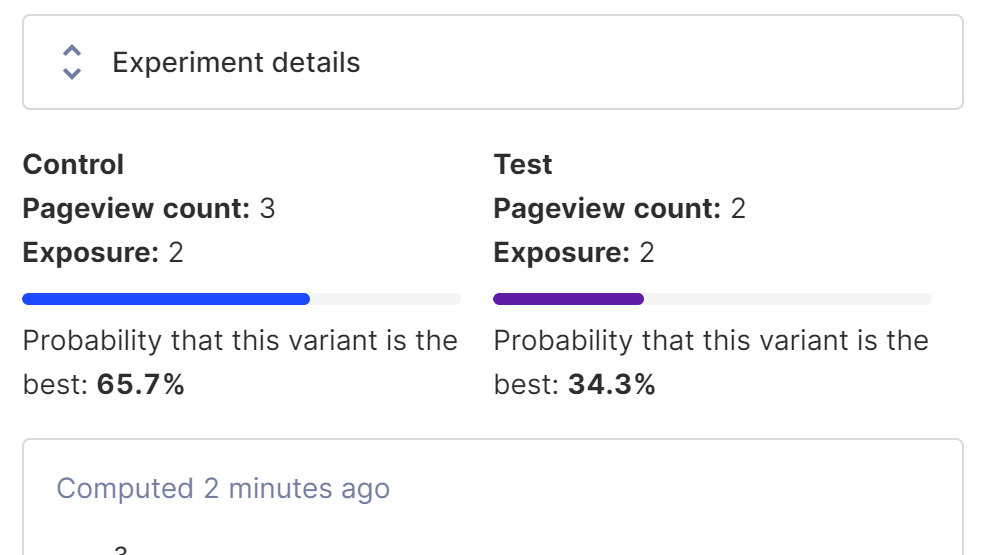
The experiment status changed to 'RUNNING' and the test started. The results column is blank because no data has been entered yet.

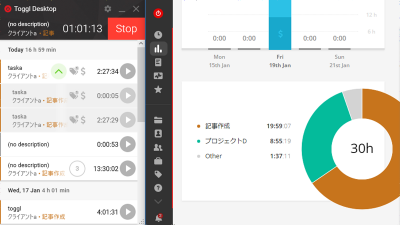
Once the data started to be collected, the progress was displayed.
In addition to session replays and AB testing, PostHog also has a ' Feature Flags ' feature that gradually rolls out new features from a subset of users, and analyzes where users drop off on the conversion path. Features such as “ Funnels ” analysis and “ User paths ” that allow you to see how users navigate your site. Also, since there is also a feature that the document is carefully built, please check it if you are interested.
Related Posts:
in Review, Software, Web Service, Web Application, Posted by log1d_ts