What is a 'Feyman diagram' that has transformed modern physics? Explain this with anime
by
Physicist Richard P. Feinman received the Nobel Prize in Physics for contributing significantly to the development of quantum electrodynamics (QED) . One of the achievements of Feynman Feynman diagram you ever create, but for the fact that 'something? Is the Feynman diagram' that confusing to the public, Quanta Magazine has discussed in animation.
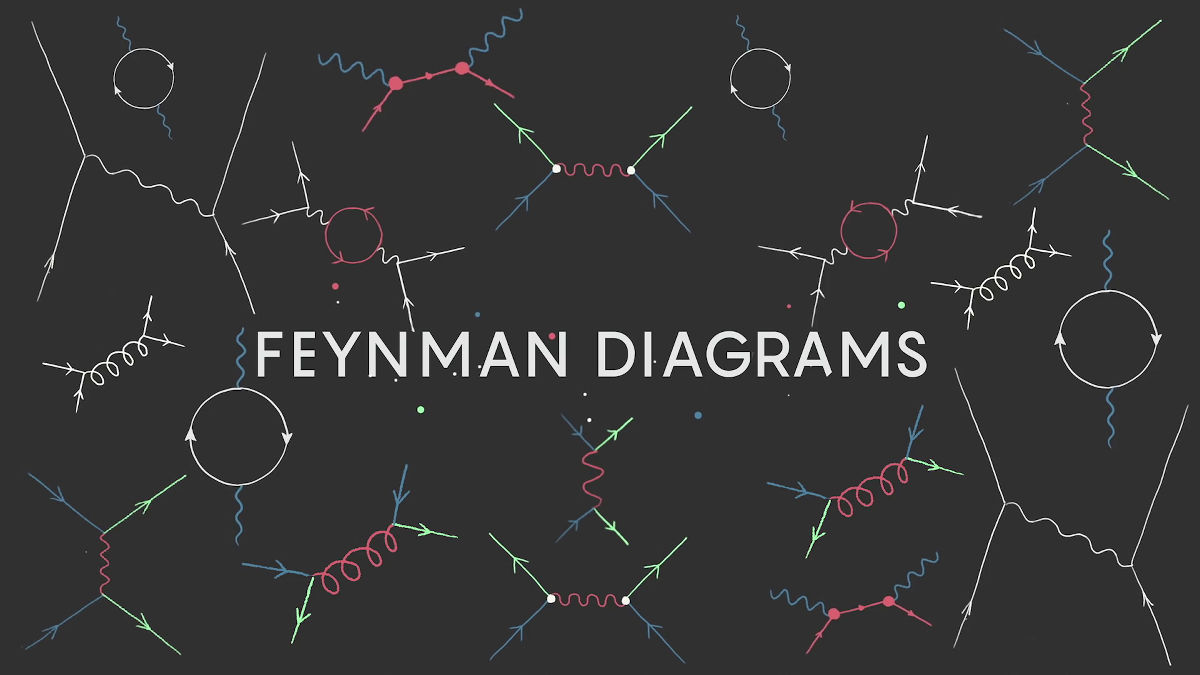
What Are Feynman Diagrams?-YouTube
In the spring of 1948, a conference was held by the world's leading physicists, including Richard Feinman, in the Pocono Mountains in the United States, where the behavior of elementary particles was discussed.

Explaining the behavior of elementary particles in a manner consistent with Einstein's
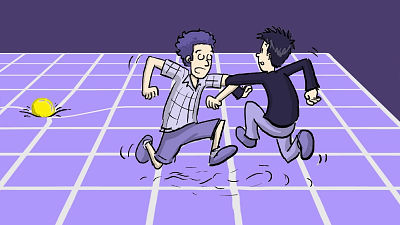
What Feynman wrote to track and calculate particle behavior is a simple figure.

These diagrams will be called 'Feyman diagrams' in the physical world.
After World War II, physicists wanted to develop more theories to explain electromagnetics .
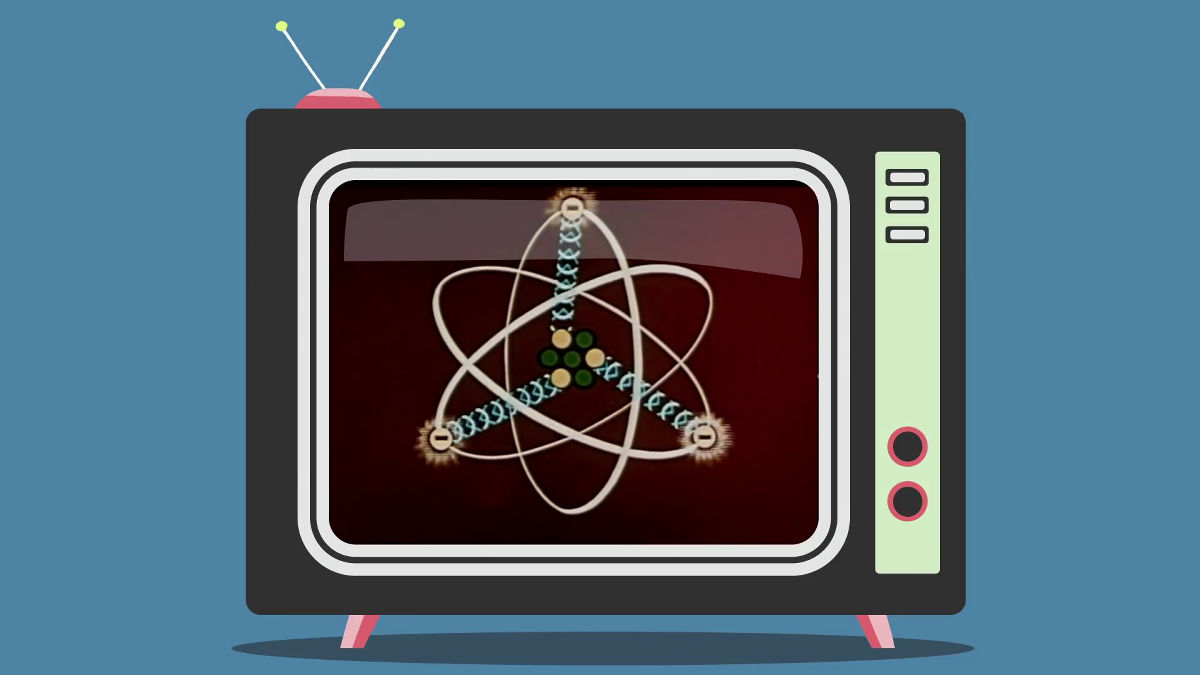
It is thought that quantum electrodynamics (QED) can calculate the probability of the possible result of particle behavior as the string behavior why particles of the same charge repel each other and particles of the opposite charge attract. It is

However, there were two difficult problems to overcome here. One is that to write an equation, one must keep track of possible particle behavior. This is a nearly impossible task that will make even a capable and patient physicist even more disgusting.
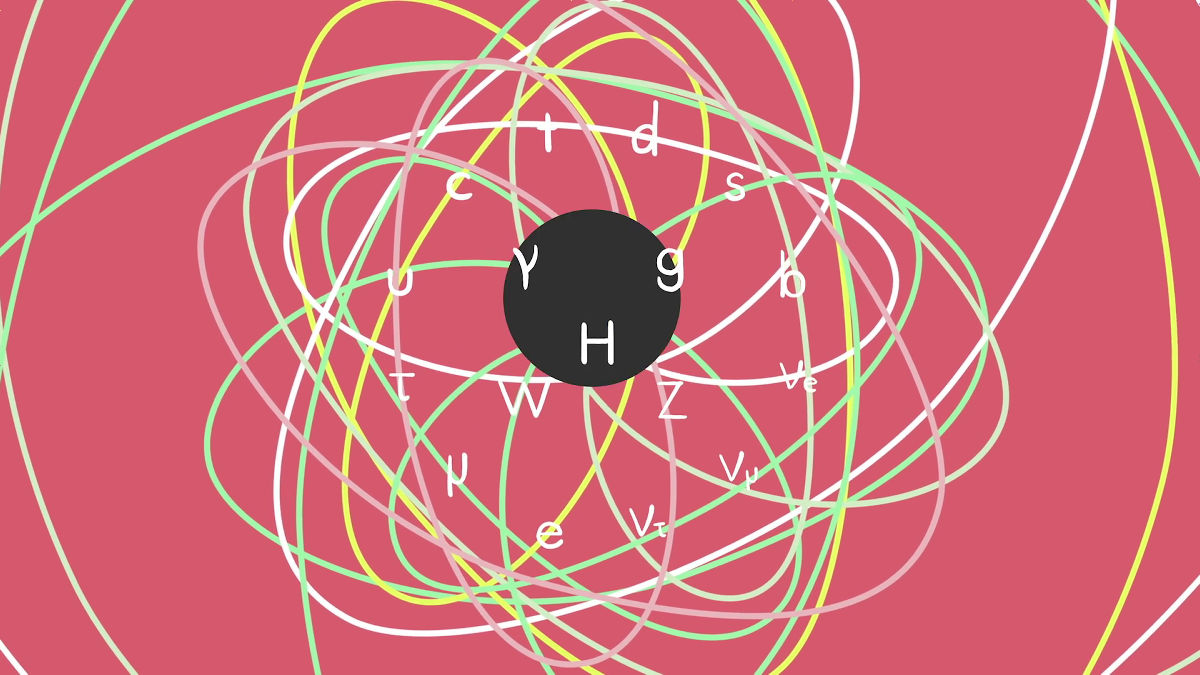
And the second problem is that when we quantify the '
The 1948 Feynman diagram is a simple visualization to calculate and ultimately quantify particle behavior.
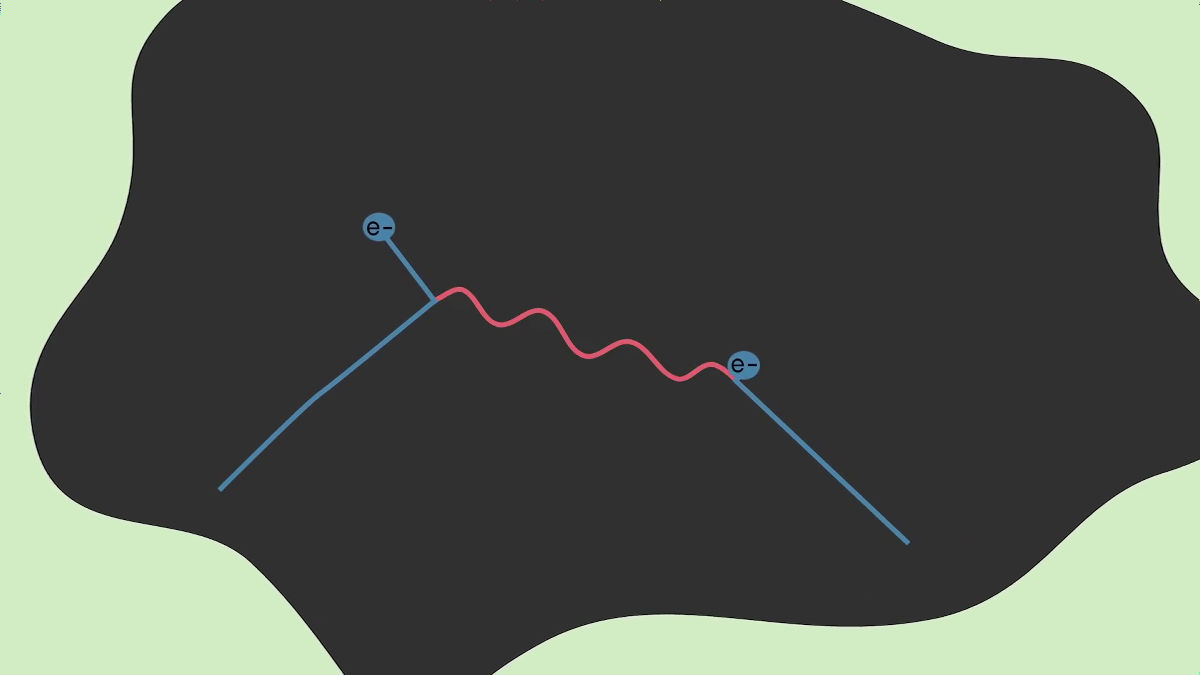
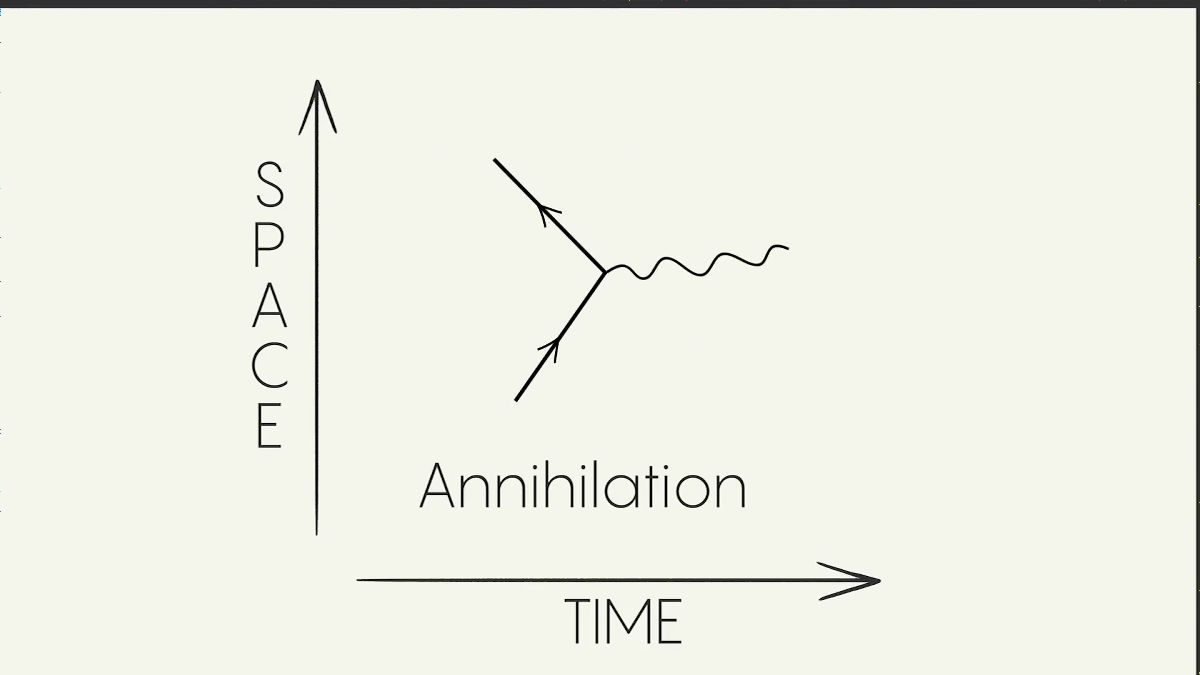
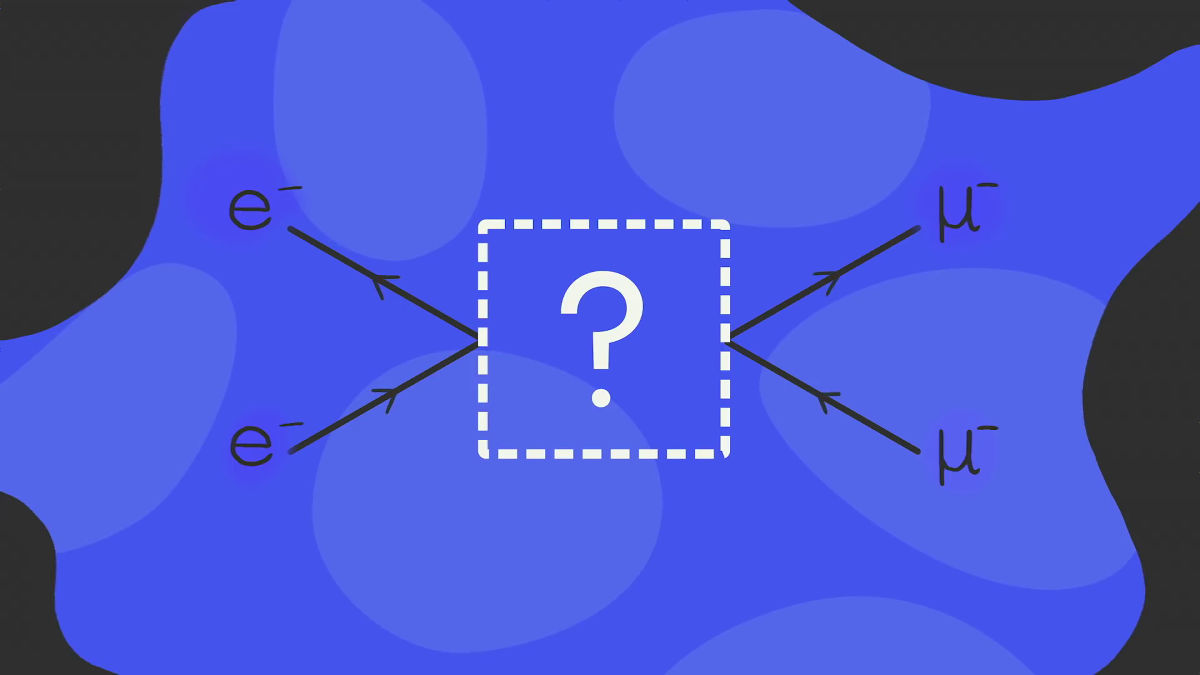
Feinman diagrams represent particle behavior in space and time. In the Feinman diagram, a linear graph shows an electron-like particle, and a ray graph shows a particle that transmits a photon-like force.
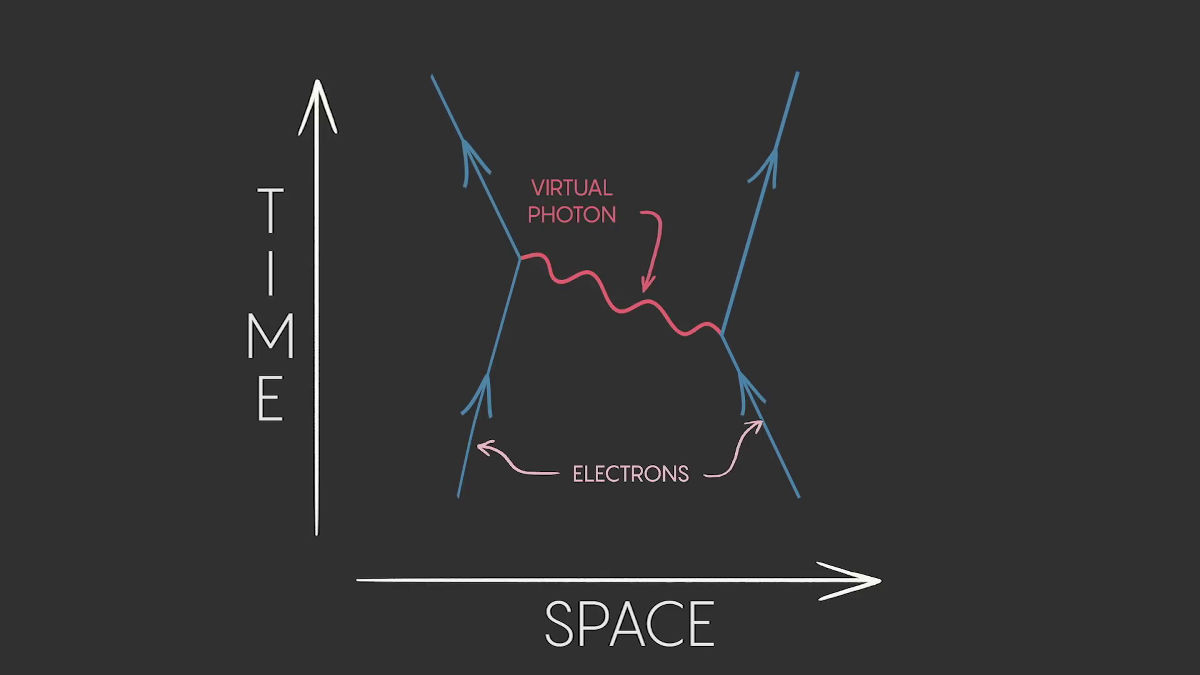
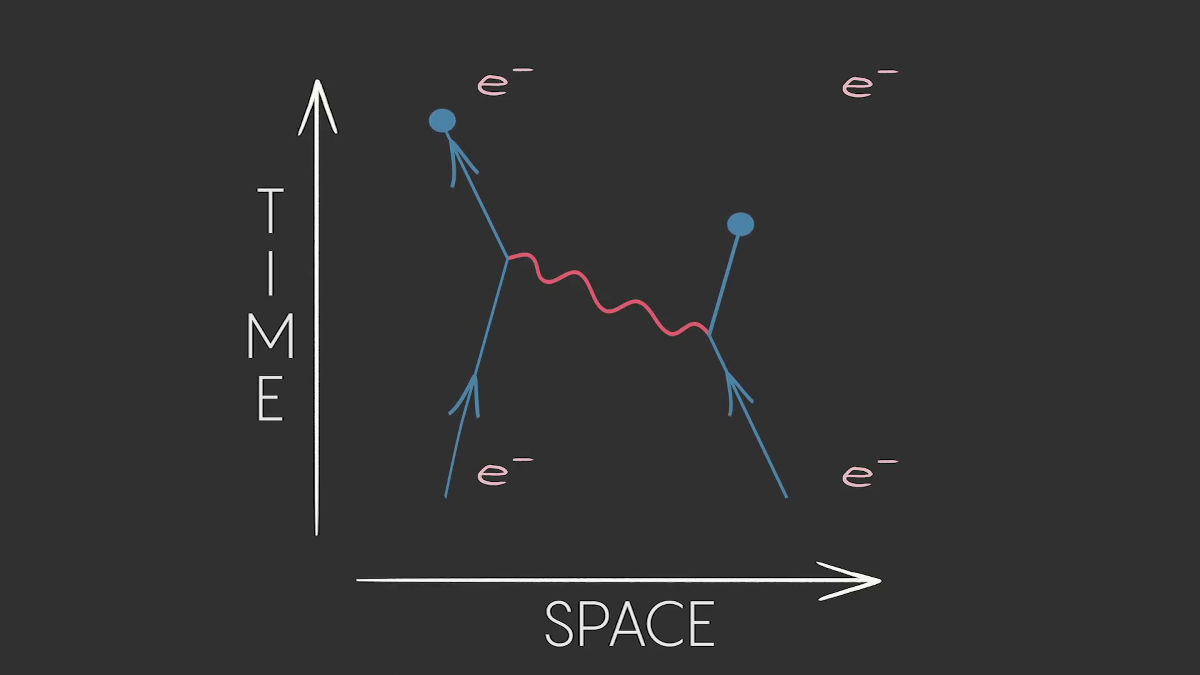
The following figure is a diagram showing how the vertical axis shows time, the horizontal axis shows space, and particles catch balls with photons to exert forces. The electron on the left side of the first emits a photon and changes its course, and the bounced photon changes the direction of another electron, indicating that scattering is occurring.
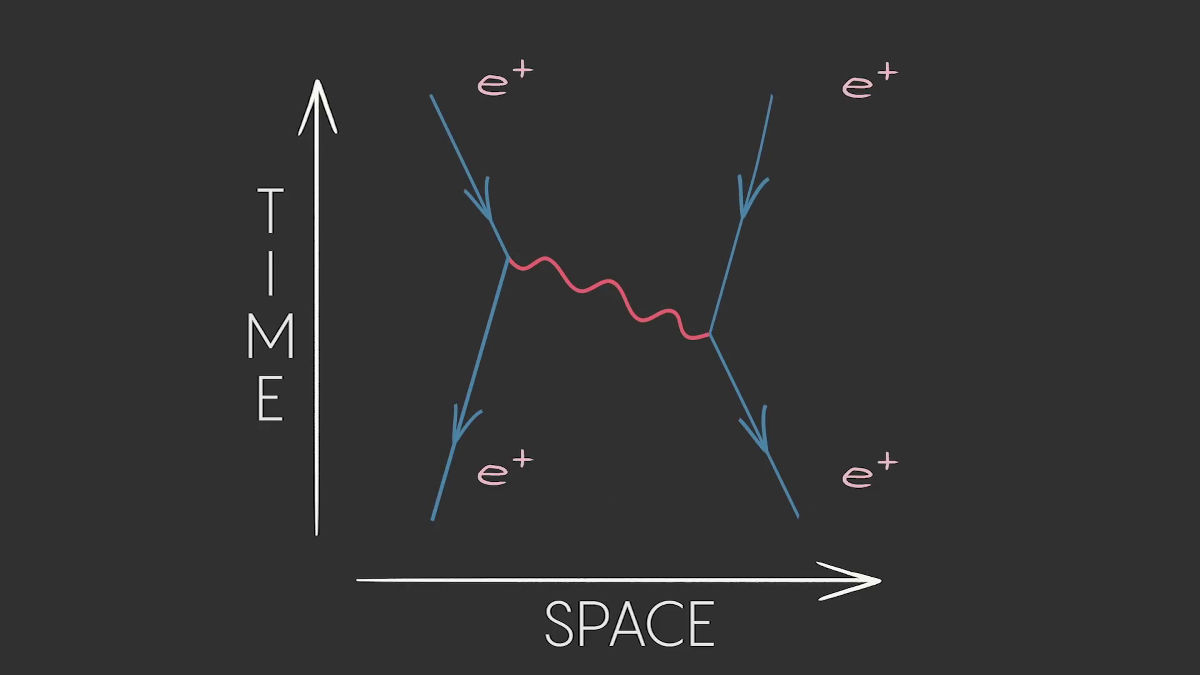
When it was turned over, the arrow indicated by the electron turned in the opposite direction, and the positron became an electron.
Each coordinate of the diagram is defined by the equation corresponding to QED, and these represent the reaction process of elementary particle.
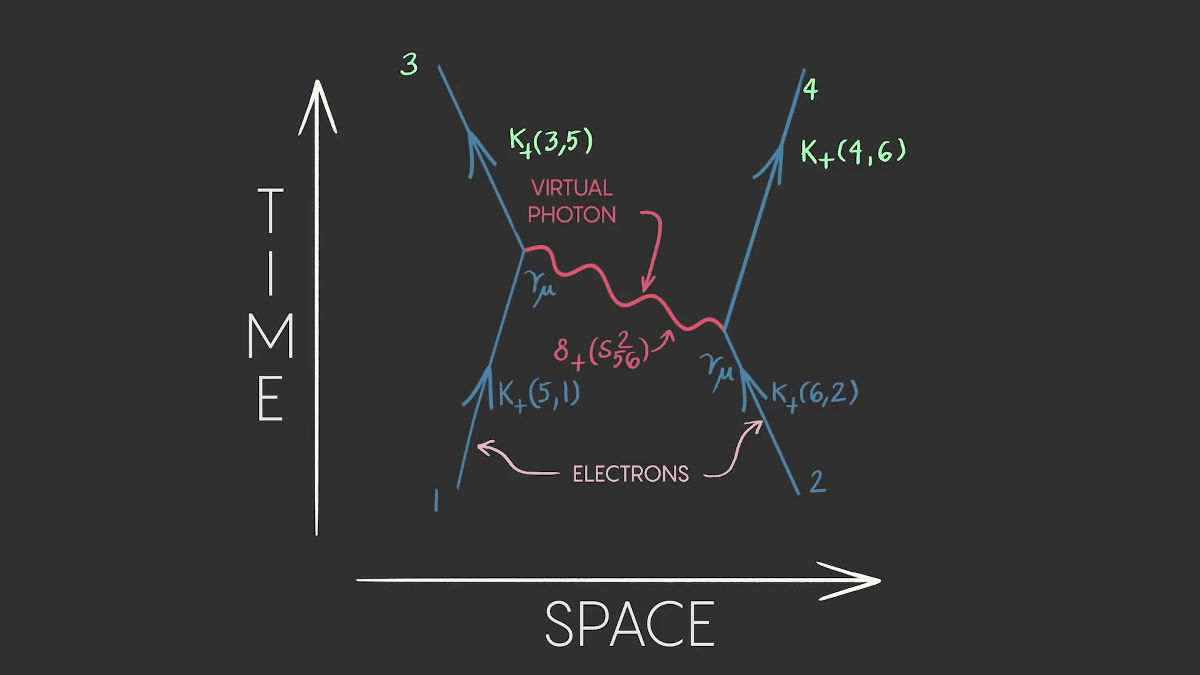
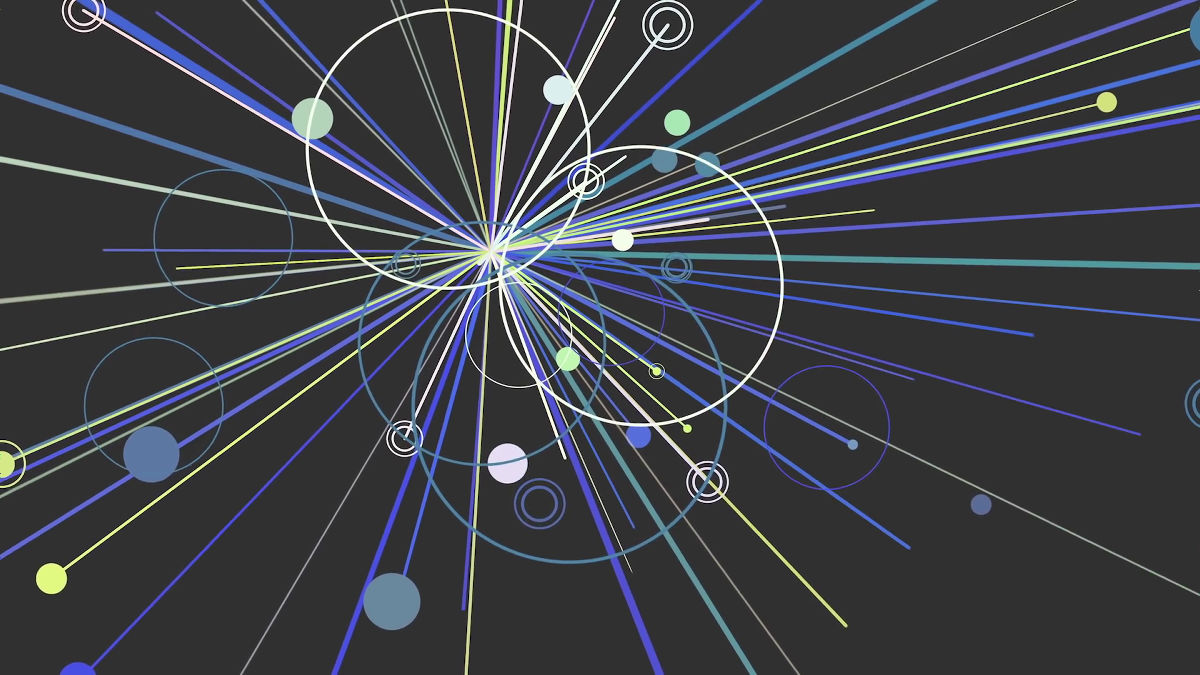
Such scattering occurs everywhere in the elementary particle reaction. At this time, energy, speed and charge will be saved.

The strange thing about Feinman diagrams is that this

There are infinite possibilities for particle reactions, but the Feynman diagram has sifted through this possibility and calculated the possible results.
When Feynman presented Feynman diagrams, his colleagues were confused because he did not know how to use Feynman diagrams in his research.

Theoretical physicist

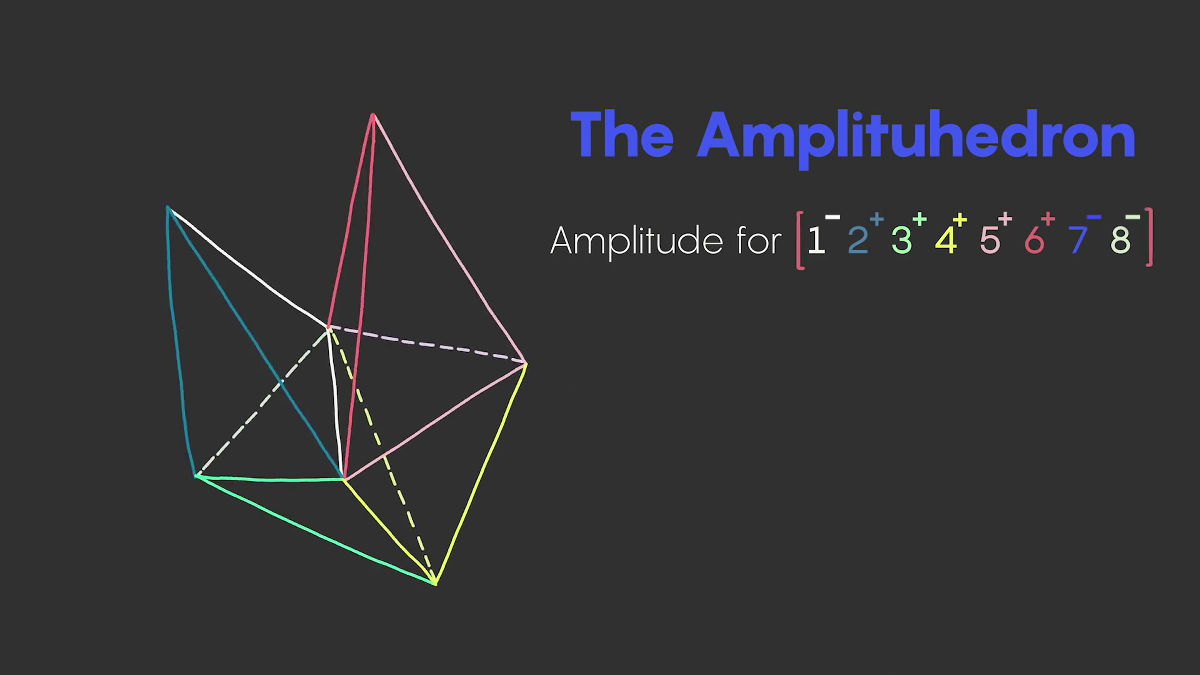
The efforts of Dyson worked well, and the Feynman diagram spread, greatly affecting modern theoretical physics. However, as time goes on, it also turns out that Feinman diagrams have limitations.

For example, in the case of
Therefore, some physicists also try to calculate the scattering amplitude with the multidimensional geometric approach ' (PDF file)
But all that began with the Pocono Mountains, which opened in 1948, the Feynman diagram is a groundbreaking tool that helps you understand the vast universe with small figures.

Related Posts: