Tests are on the market to see how much you understand the science hidden in 'good graphs'
by 200 degrees
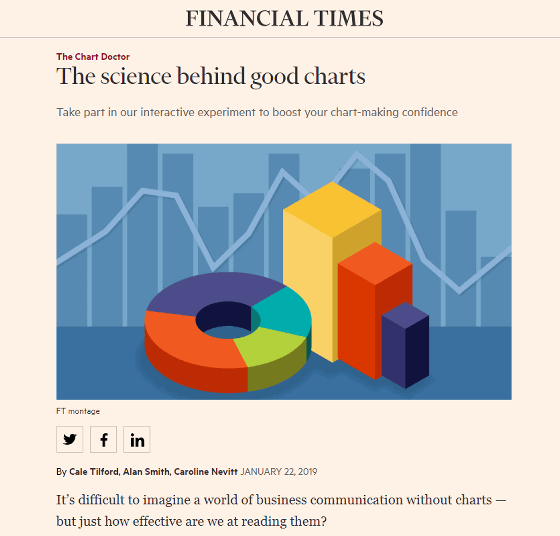
Using graphs and charts to make a convincing presentation is effective, but it can be counterproductive if you use it for play. Therefore, Financial Times explains in a quiz format the “science behind a good chart” that you should know when using graphs and charts.
The science behind good charts
https://ig.ft.com/science-of-charts/
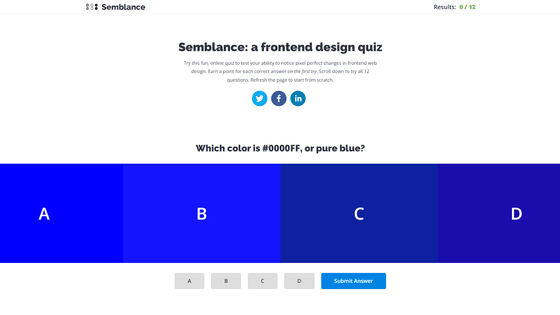
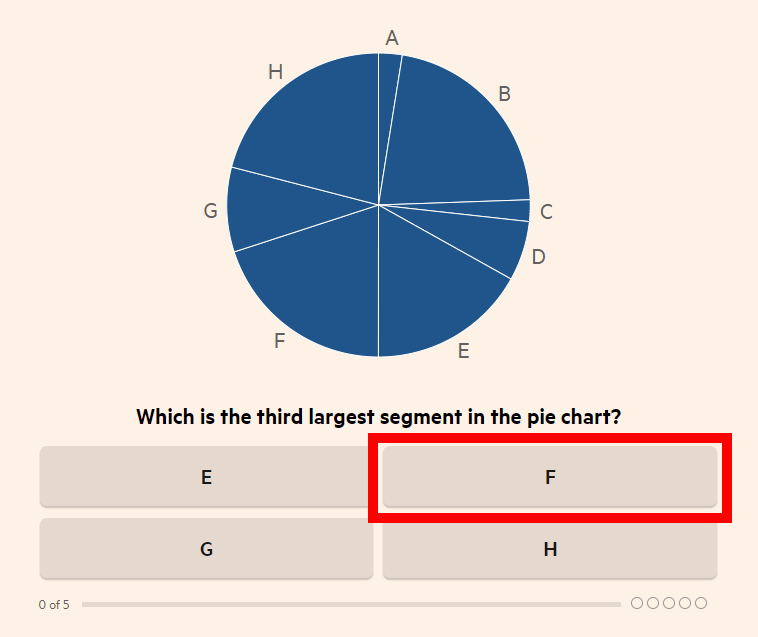
The pie chart is displayed first. When asked, "What is the third largest segment?"
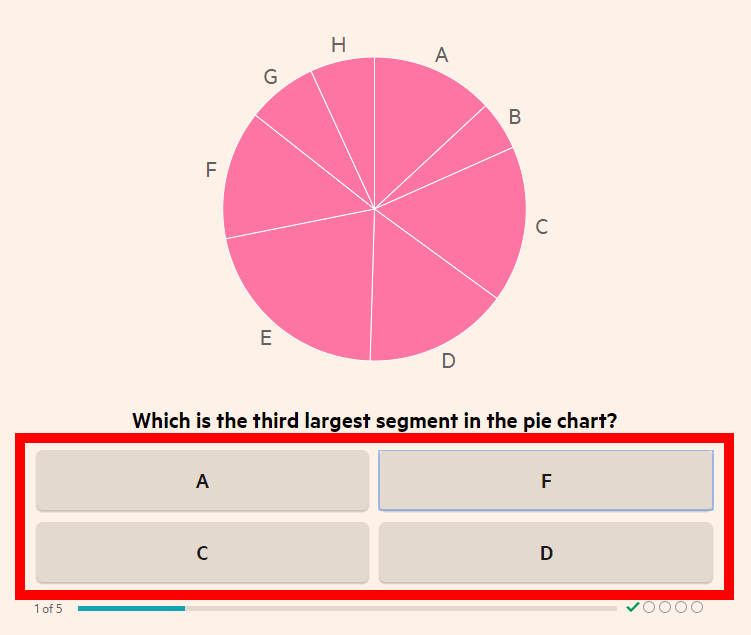
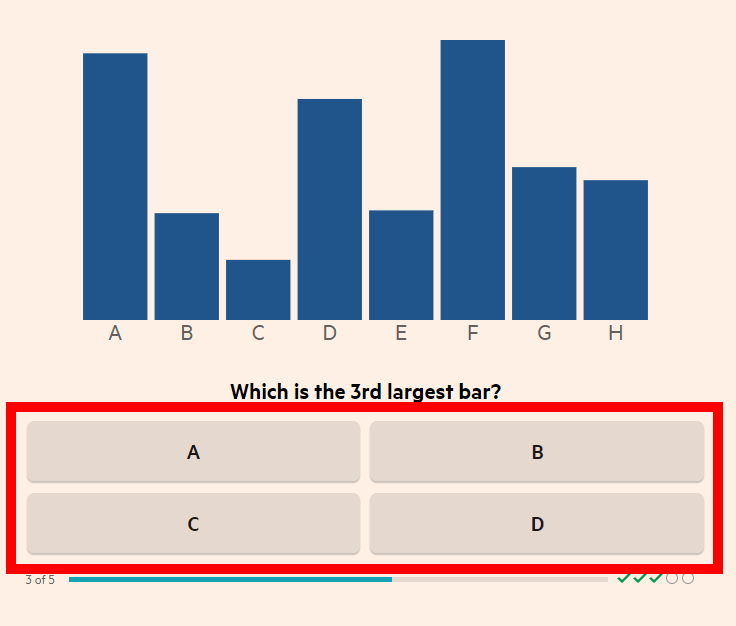
Then we move on to the next problem. The problem is the same, but because the pie charts are different, stare at the chart and click on the alphabet that indicates "the third largest segment".
The same question is followed by five questions, and the lower part shows the correctness / incorrectness of the questions answered so far. There are relatively simple problems and some problems.
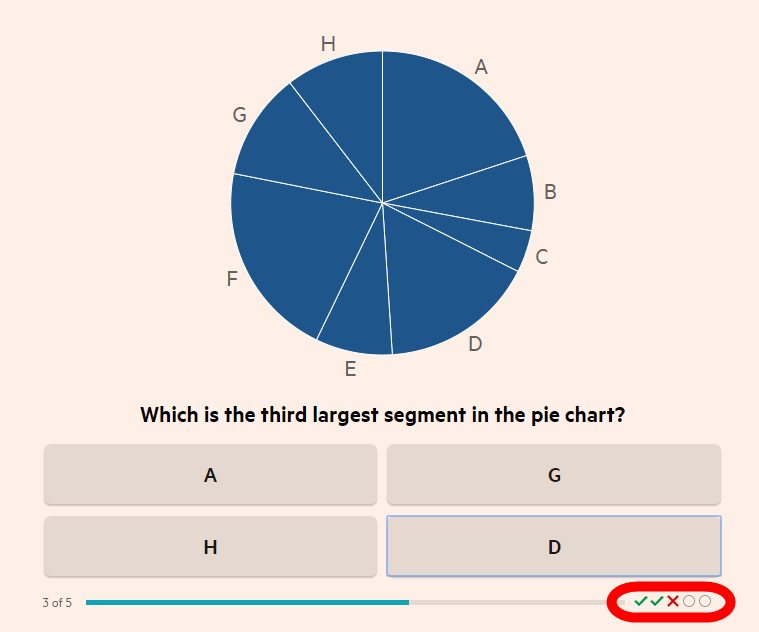
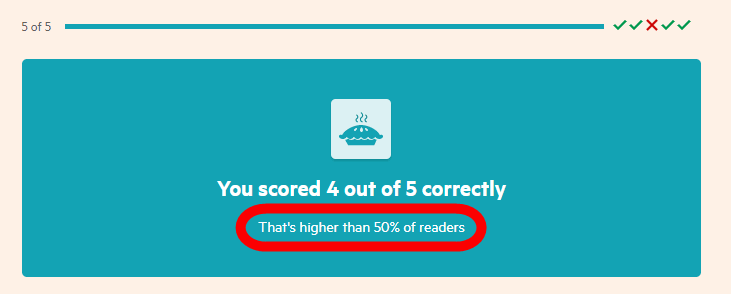
When all 5 questions have been completed, it will be shown how many of the 5 questions were correct. In the case of 4 questions correct answer, it says "Score higher than 50% readers".
Effective use of charts and graphs is very important for a good presentation. By solving the above problems, you should first understand how difficult it is to read a frequently used pie chart correctly. In the latest research , when reading a pie chart, people use one or both of the area of the segment, the length of the outer arc, and the angle of the center. Reading pie charts is a very complex task of encoding.
On the other hand, bar charts are easier to compare than pie charts because they have a baseline.
The bar graph quizzes are answered in the same way, with the third highest bar clicking any button.
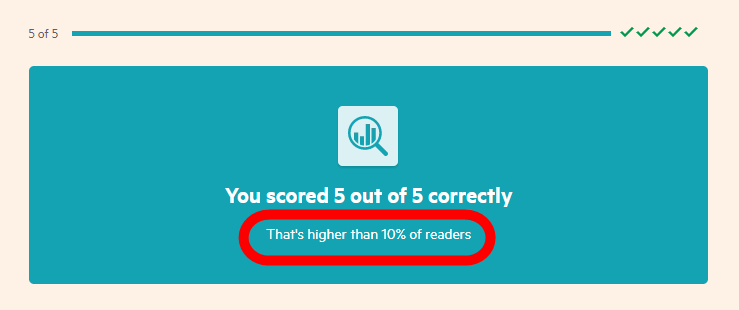
Of all 5 questions, 5 questions are correct. As it is "a score higher than 10% readers", the overall accuracy rate is higher than that of the pie chart.
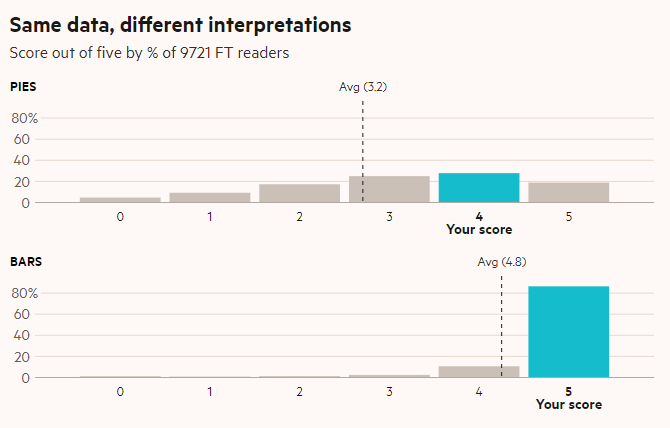
The following is a feeling like that, along with the average score, it also shows how much your score is located in the whole.
It does not mean that you should never use pie charts. Pie charts are good at showing parts and wholes in relation, but they can be confusing to the viewer . However, you should not think that "let's make a pie chart 3D" and so on.
And, like a pie chart looks better than a bar chart, a sphere is more visually appealing than a circle. However, the size of the sphere is very difficult to understand visually. The following quiz shows how 2D and 3D graph comparisons differ.
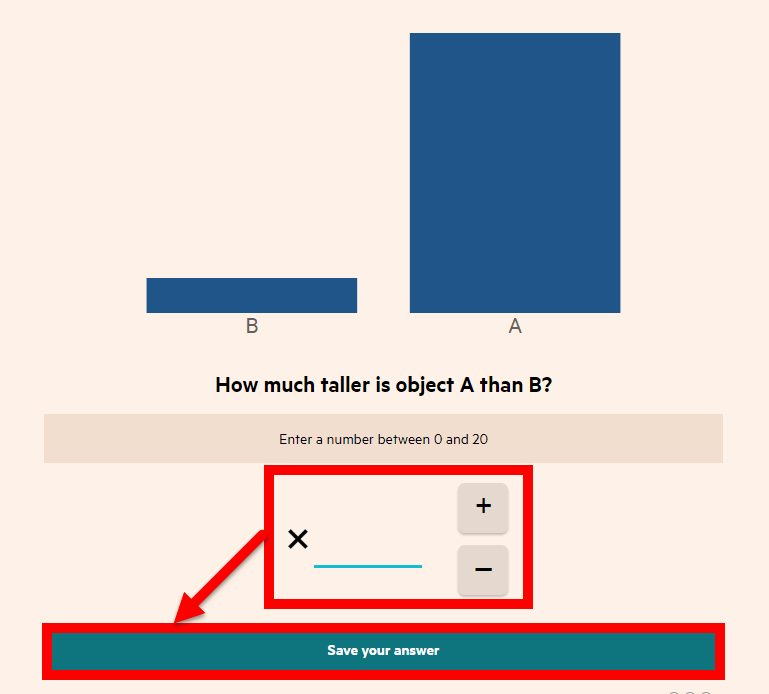
First of all, the quiz of "two-dimensional" which answers how many times the graph of A is B height. Adjust the numbers with "+" "-" and click "Save your answer".
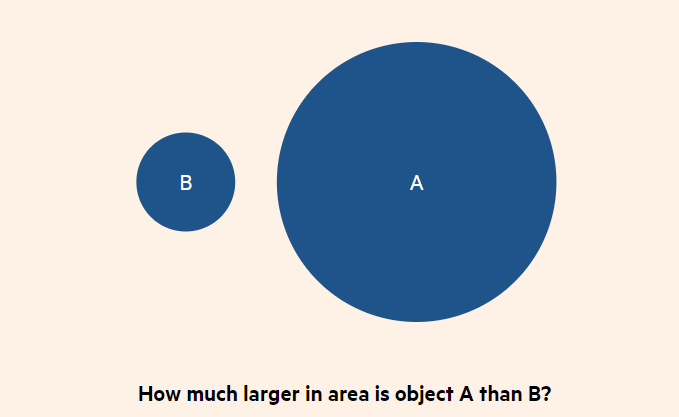
But what is the area of A as large as B? Intuitively answer the question that ...
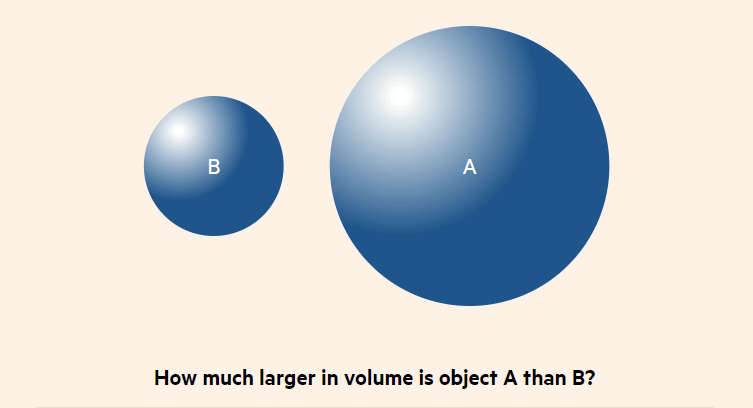
How many volumes of A is B? It is almost impossible to answer the question.
In January 2019, a tweet explaining that an 18-inch (about 45.7 cm) pizza has a larger area than two 12-inch (about 30.5 cm) pizzas has a surprise that "there is no such reason." More than 30,000 retweets and more than 70,000 "Like" got a topic. This also demonstrates the difficulty of people intuitively understanding the area of the circle and the volume of the sphere.
Here's a useful counterintuitive fact: one 18 inch pizza has more 'pizza' than two 12 inch pizzas pic.twitter.com/hePSpG0pJs
— Fermat's Library (@fermatslibrary) January 7, 2019
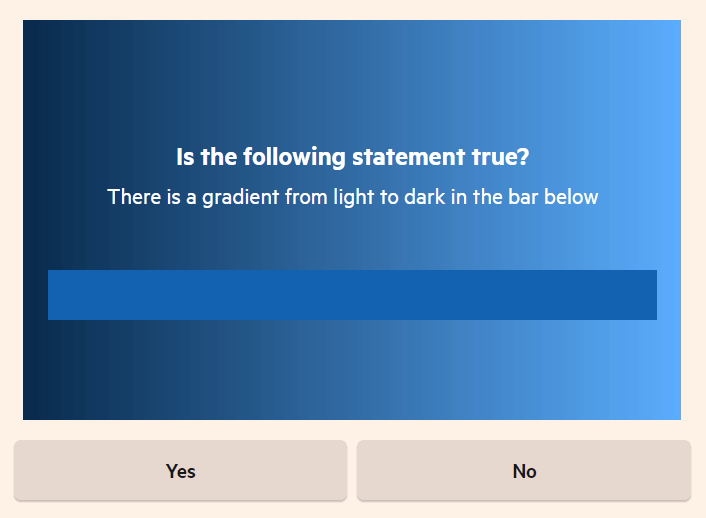
And the final question is whether the bar shown below the letters is a gradation? It was 2 choice comparing. This problem indicates how much the human eye is affected by graphic elements other than graphs.
As you can see from the above tests, it is necessary for people to understand how to read and misread visual information in order to make the data look effective. Pie charts have been used for over 200 years, but the usefulness of visualizing data has only been studied for the first time. "Directing to the science behind data visualization is key to improving the quality of graphic communication," said Robert Kosara of Tableau Software, a data visualization software company.
Related Posts: