Half of the revenue of the smartphone gaming turned out to be supported by only 0.19% of all users
The monetization of the game industry has attracted attention recentlyFreemiumIt is a business model. Freemium is a mechanism that provides basic services and games themselves for free, and furthermore, charges for the use of advanced functions are charged, and there are many games that adopt Freemium in mobile games . In the Freemium Mobile Game, a report that investigates how much charging users are, how much charge per user, etc. is published.
The Swrve Monetization Report 2016 | Swrve - Mobile Marketing Automation: Analytics, A / B Testing, In-App Campaigns, Push Notifications
https://www.swrve.com/landing/swrve-monetization-report-2016
The mobile games industry is kept afloat by less than 1% of users
http://thenextweb.com/insider/2016/03/23/free-to-play-games-are-not-the-way-forward-for-mobile-gaming/
Mobile games subject to survey are freemium type, which games products themselves generate revenue through in-game billing for free, and the investigation period is one month in February 2016.
◆ Number of charged users and billing amount
According to Swrve who investigated, it was found that only 1.9% of all users are charging users, and about 98% of users are playing without charge. In addition, the average charge per user is 24.66 dollars (about 2790 yen) in one month. Considering that about 98% of the total is a charge-free user, you can see that a chargeable user is charged a considerable amount.
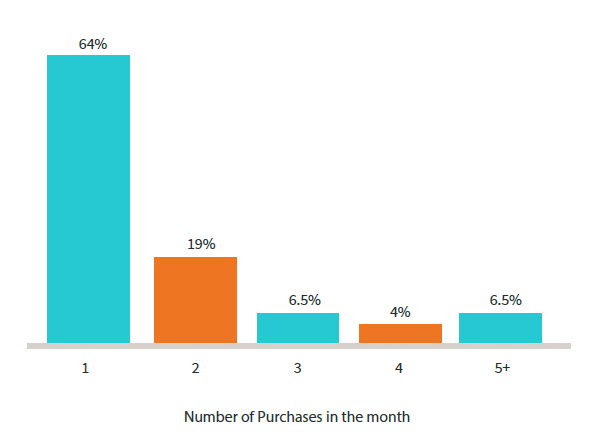
◆ Charging count
The graph below shows how many times billing users are charged per month. It is 64% of all billing users to charge once a month, 19% for 2 times, 6.5% for 3 times, 4% for 4 times, 6.5% for 5 times or more. According to Swrve, there is a tendency to charge a large amount at a time instead of charging a small amount a plurality of times, and the charging users have learned the timing of charging within the game, or the game developers massively We are making a system that will charge you.
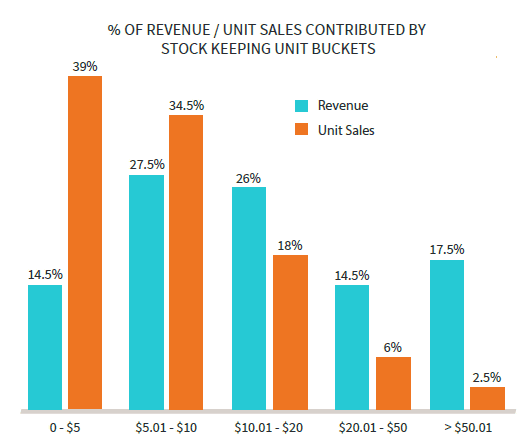
◆ Billing and earnings
The graph below shows how much the charging user contributed to earnings. For example, if you look at the leftmost "0 to 5 dollars (about 570 yen)" in the graph, it is shown as 14.5% in blue and 39% in orange, which charges 0 to 5 dollars per month Users are 39% of total sales and 14.5% of revenue. You can see that users who charge more than 50 dollars (about 5600 yen) are only 2.5% of the total sales, but contribute 17.5% to earnings.
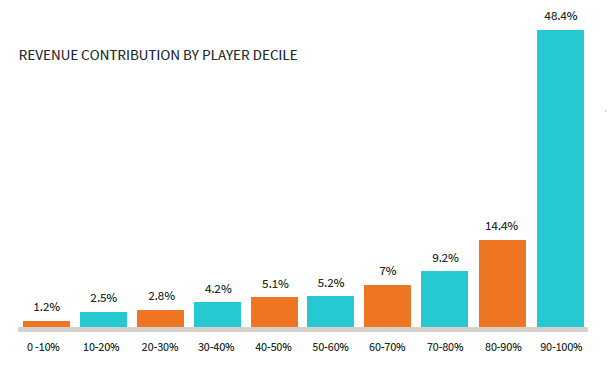
◆ Subdivide charged users
The graph below shows the percentage of each group's revenue by dividing all charge users by 10% from the less charged to the most charged. For example, the leftmost "0-10%" is a user who falls within 10% of the charged users among the charged users, and the "1.2%" above it is the percentage that accounts for revenue. In other words, the revenue from the bottom 10% of the total charged users is 1.2% of the total. "90-100%", which has the largest charge amount, accounts for 48.4% of revenues. It is not written on the graph, but according to Swrve, there are only 0.19% of all users who belong to "90-100%". In other words, about 50% of revenue is supported by only 0.19% of all users.
◆ Billing pattern for new users
25.3% of all users of Freemium Mobile Games in February 2016 were new users who started playing the game. The following graph shows the number of days that new users took the charge, and it turned out that 59% of new users charged for the first day of play. However, 7% are users who charge for the first time on the fifth day.

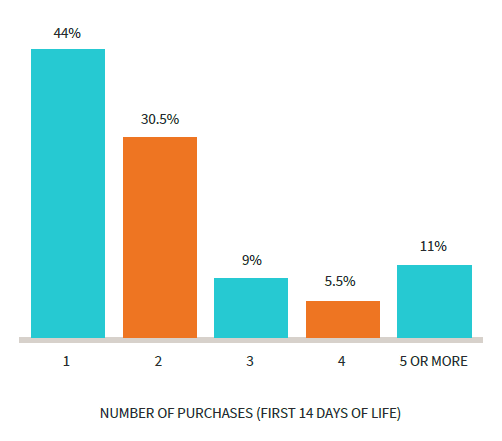
The following is a graph showing how many times a new user who charged once makes a charge within 14 days from the first charge. 44% makes the second charge within 14 days and 30.5% did the third charge. As the number of billing increases, the graph decreases, but 11% of new users who charged once feels that they charge 5 times or more within 14 days.
Related Posts: