"GlassWire" security tool to notify of visualization of network usage status and outflow of PC data for free
It monitors users' activities on the network, displays various data related to the amount of data traffic, detects and warns which application is sending personal information from the PC to the outside, etc.FirewallA free security tool that can also act as "GlassWire"is.
GlassWire Network Security Monitor & Firewall Tool
https://www.glasswire.com/
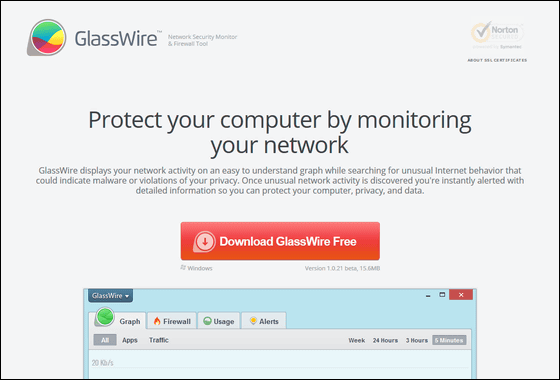
"GlassWire" can be downloaded for free from "Download GlassWire Free" on the above page.

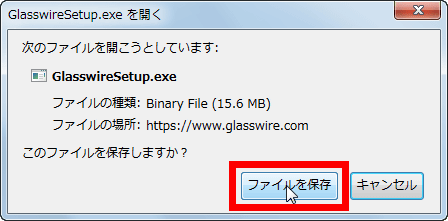
Click "Save file".
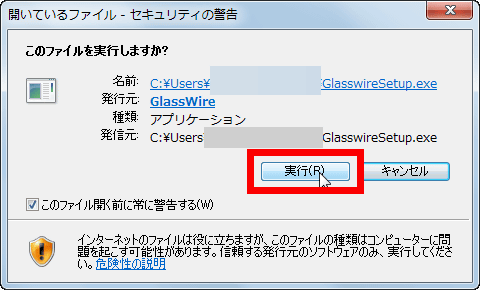
Launched "GlasswireSetup.exe" downloaded in the PC.
Click "Execute".
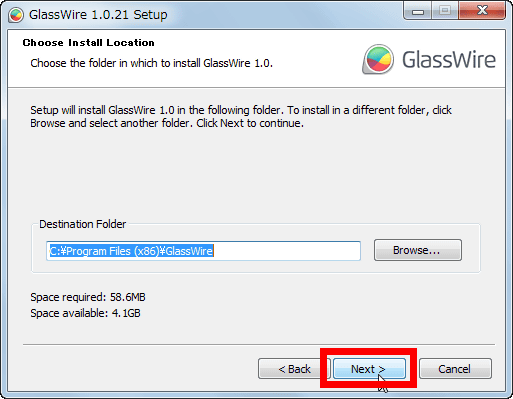
Click "Next".
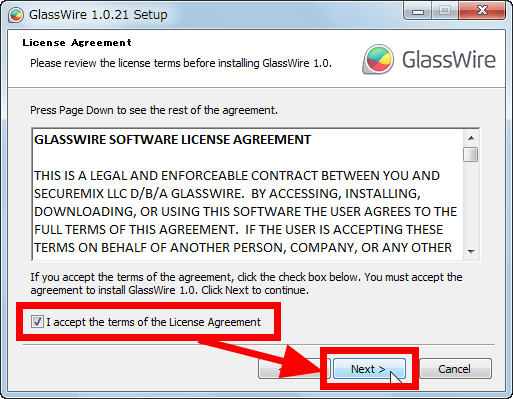
After reading and agreeing to the Software License Agreement, select "I accept the terms of the License Agreement" and click "Next".
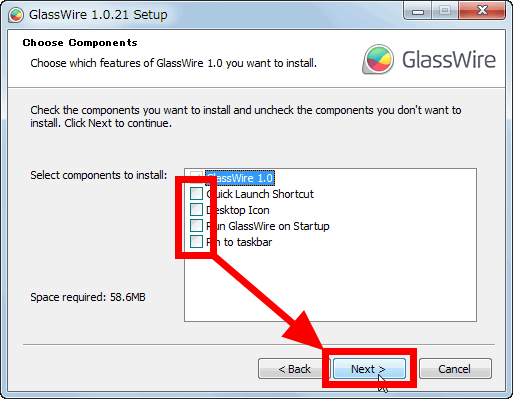
Please uncheck "Quick Launch Shortcut" "Desktop Icon" "Run GlassWire on Startup" "Pin to taskbar" and click "Next".
Click "Next".
When installation is completed click "Finish".
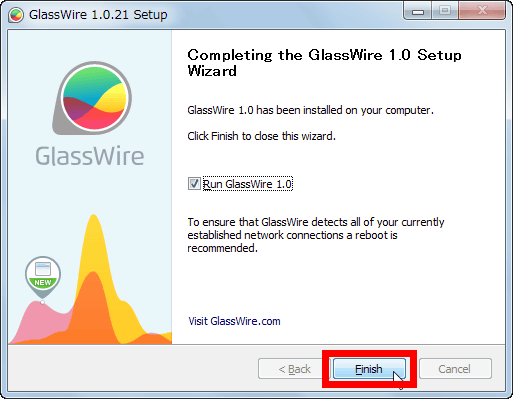
Then GlassWire will start up as it is.
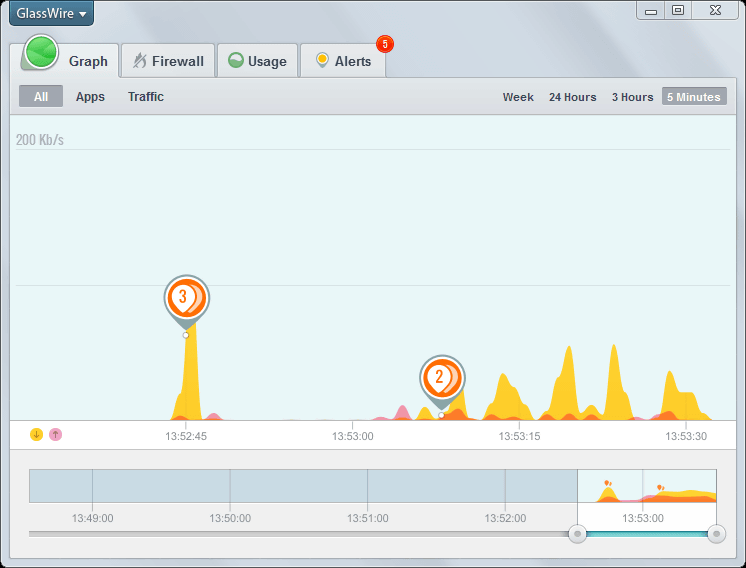
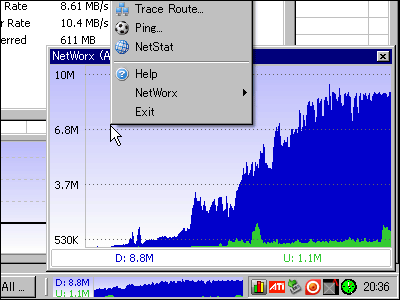
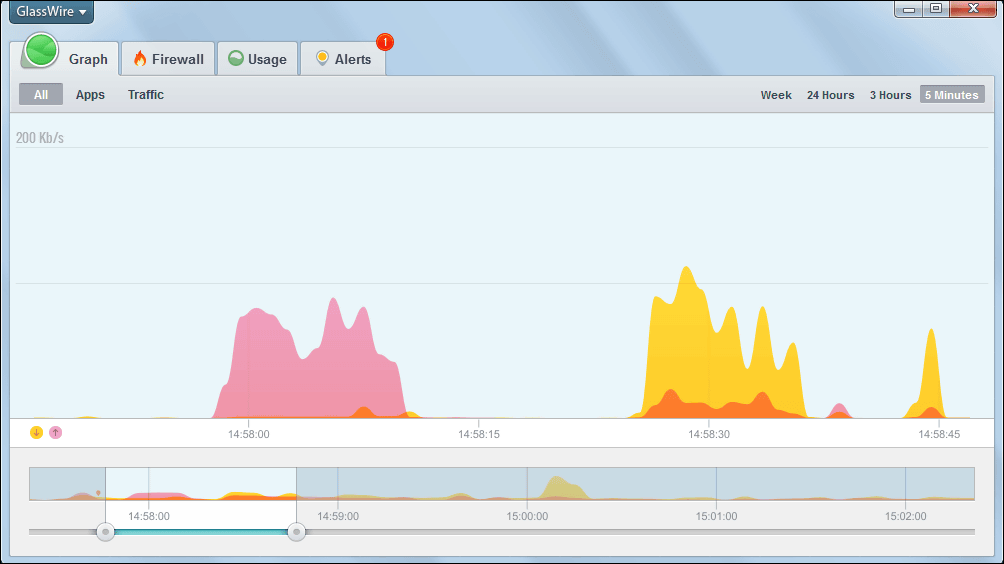
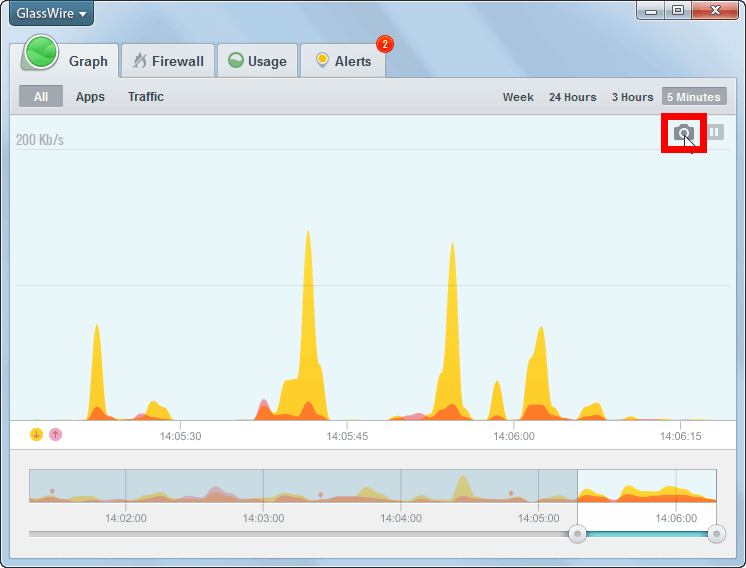
In GlassWire, the network usage status is displayed in a graph, and the graph shows the amount of traffic used for yellow down (download) and pink up (upload). Unit will vary greatly depending on traffic volume at that time, but in the case of the following graph, since it is "200 Kb / s" at the top left, it seems that we were communicating about 100 Kb or less per second.
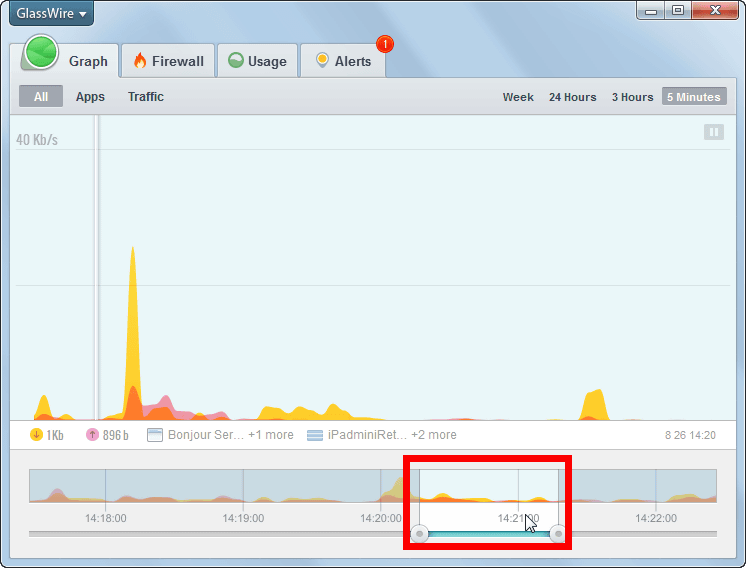
By dragging and dropping the red frame part at the bottom of the graph you can also see the traffic graph of your favorite time zone.
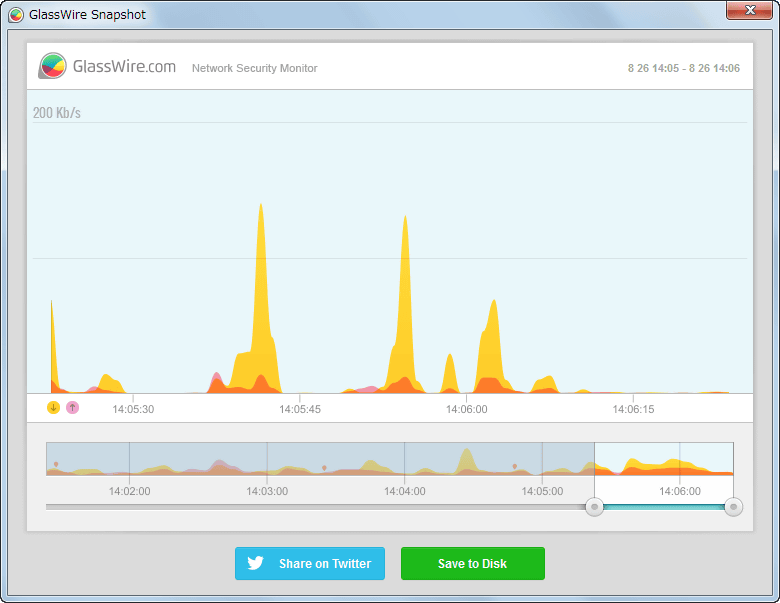
Furthermore, if you click the camera icon at the top right of the graph ... ...
You can take a screenshot of the graph, you can share it on Twitter or save it on your PC.
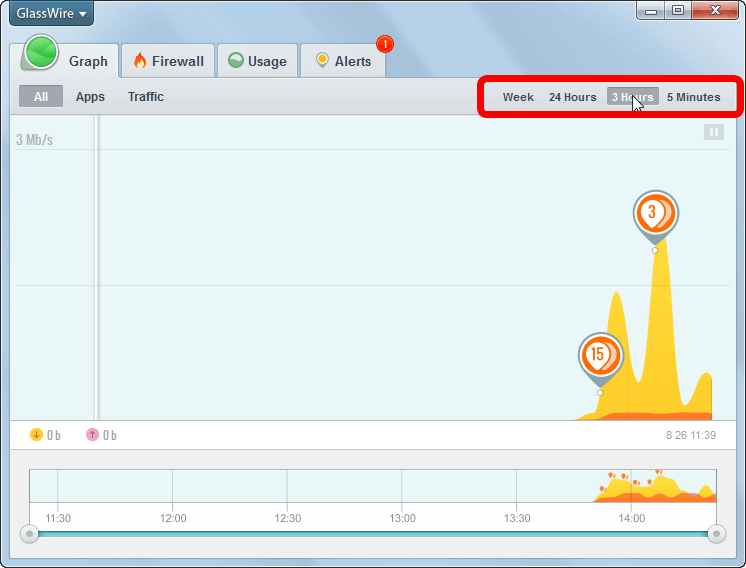
With GlassWire it is also possible to display the traffic graph for each of the four periods of 1 week, 24 hours, 3 hours, 5 minutes.
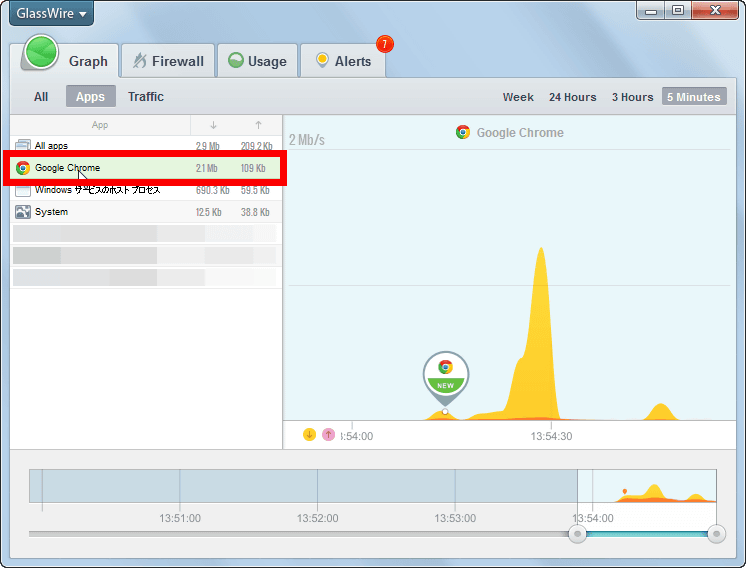
If you can not be satisfied with this information, click "Apps". Then you can see the network usage status for each application.

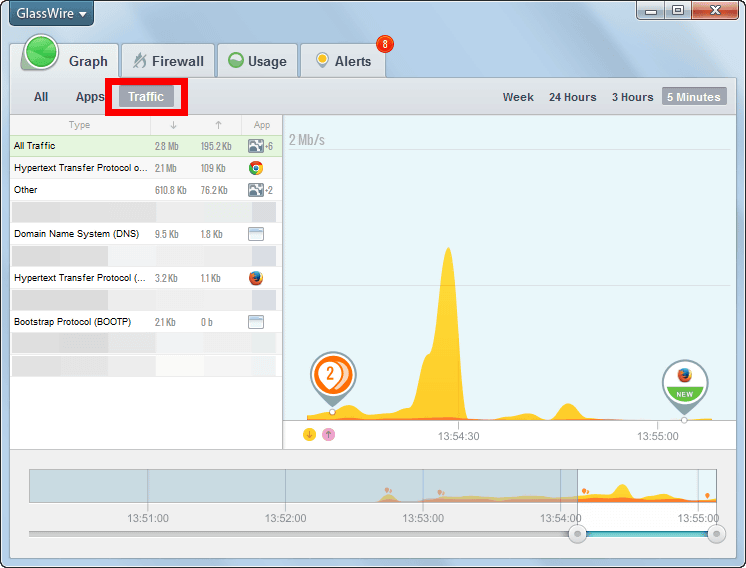
For example, if you click "Google Chrome", the graph will change to show how much data users are using data communications with Google Chrome. In addition, the amount of traffic via Google Chrome was understood by looking at the numerical value next to the icon, the download amount was 21 Mb, and the upload amount was 109 Kb.
By clicking on "Traffic", you can sort the data of the graph mainly based on traffic volume.
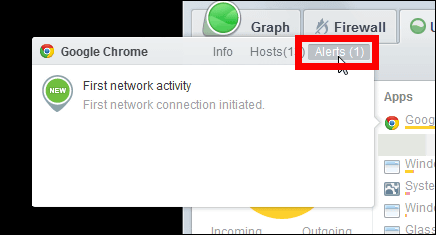
Suddenly a notification called "First network activity" appeared at the lower right of the PC screen. If you look closely well this is a password & Cluka management software that you can use for iOS / Android / PC / Mac for free -Dashlane Password ManagerIcon of.
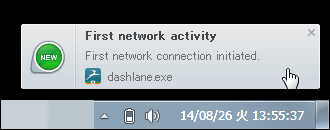
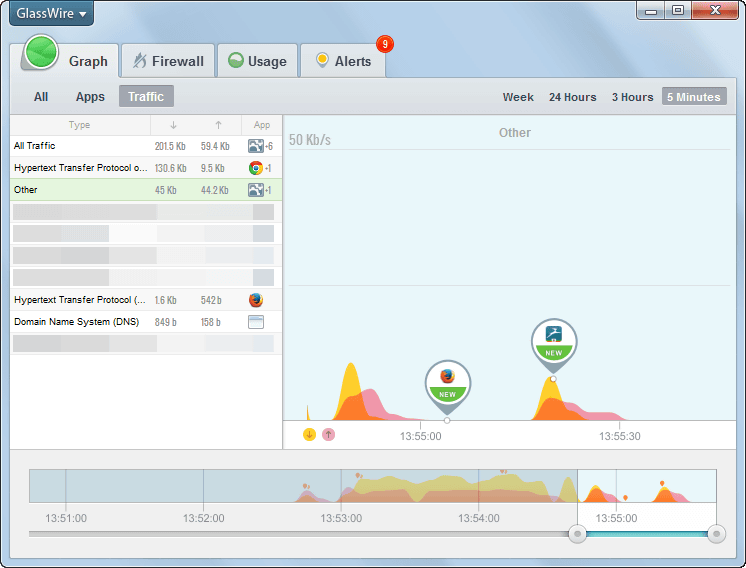
The icon of "Dashlane" has flowed like this on the graph as well. Apparently, it seems that GlassWire will notify you of the existence of applications that used the network for the first time during startup like this. In addition, GlassWire displays notices not only when the application starts the network connection but also when personal information or data in the PC is illegally uploaded via the network, and the user It will encourage attention.
These notifications are displayed on the "Alerts" screen.
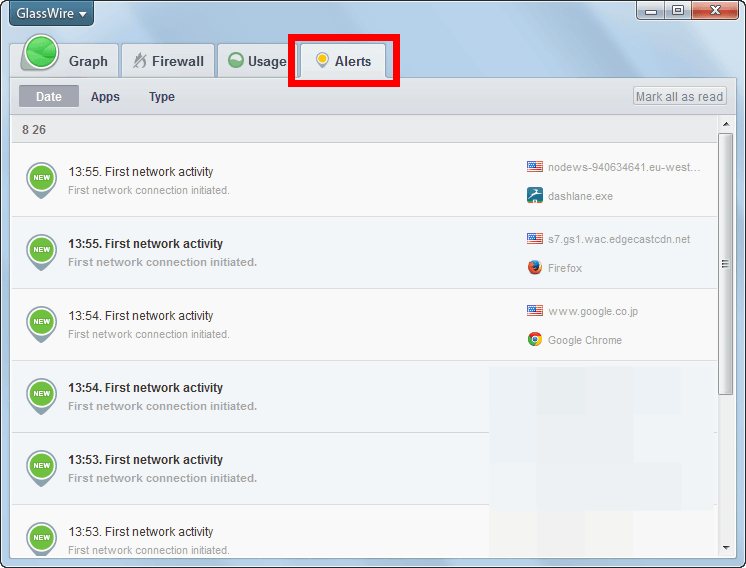
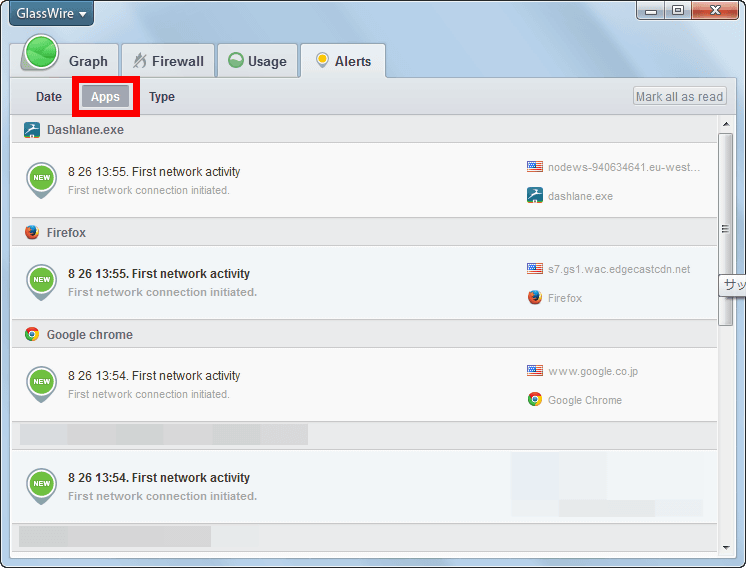
Click "Apps" to display the contents of notification for each application.
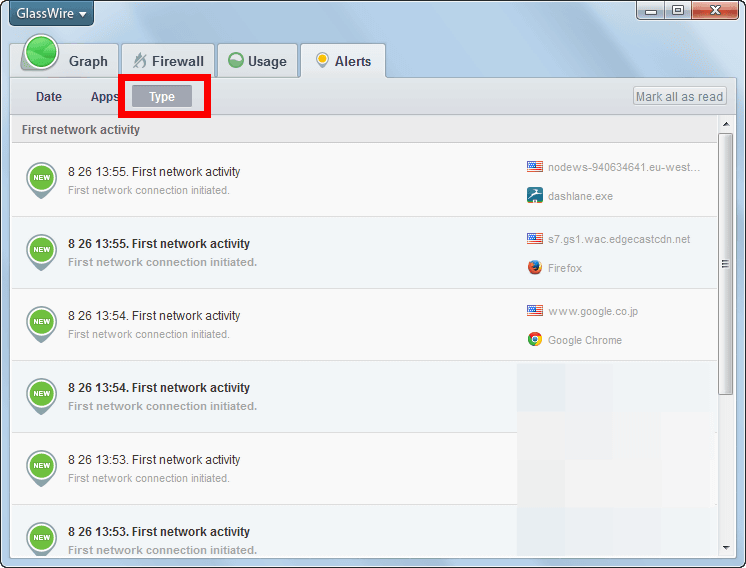
Click "Type" to rearrange the notifications by type.
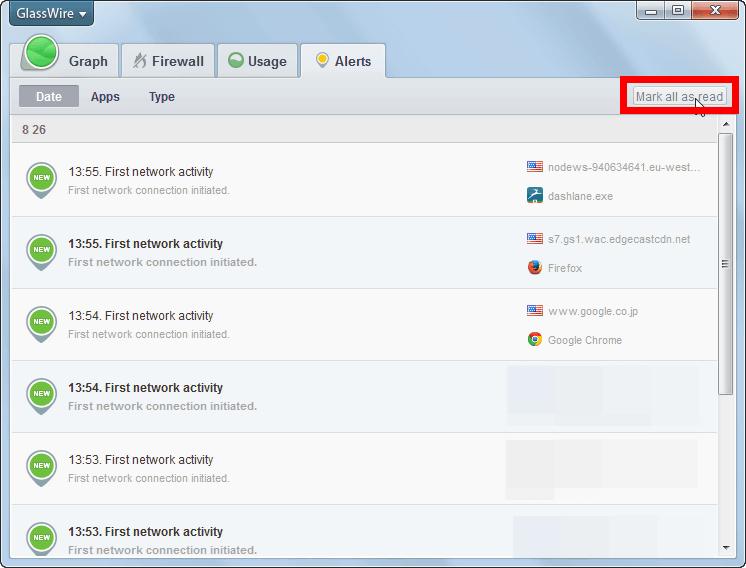
After you finish reading all notifications, you can click "Mark all as read" at the top right of the screen.
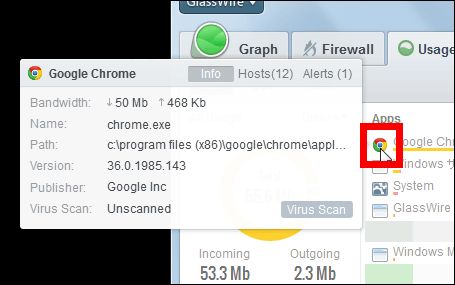
Next, click "Usage". In this screen, the PC communication volume (All Usage), application (Apps)hostname(Hosts), type (Traffic Type).
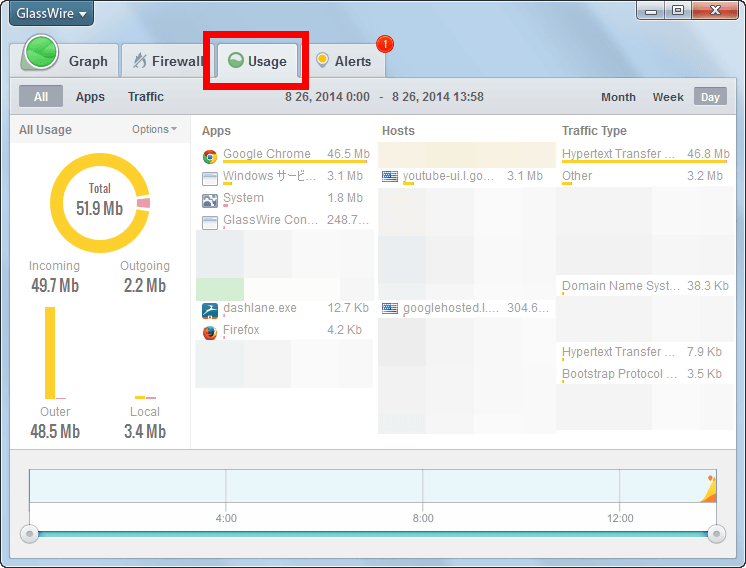
I clicked on the application icon and I got more detailed data. For example, Google Chrome's current traffic volume is 50 Mb for download and 468 Kb for upload. Furthermore, it is a good thing to display information on the place and version where the application is stored, as well as information on the publisher.
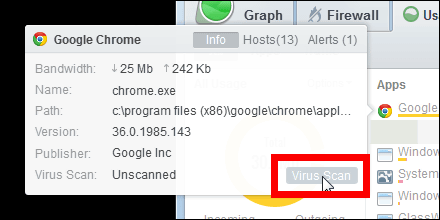
If you click on "Virus Scan" on this screen, it runs Google Chrome virus scan quickly.
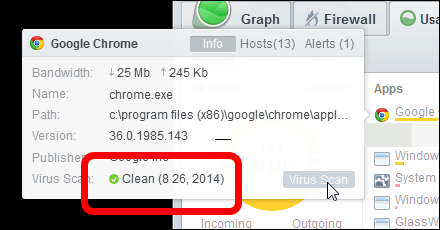
It seems that there was no problem.
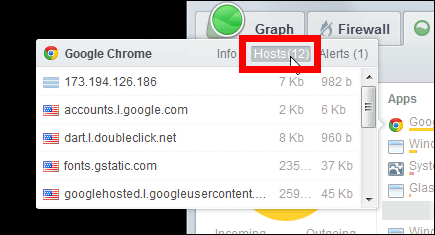
When you click "Hosts", the host name and data traffic volume that the application accessed are displayed.
By clicking on "Alerts" you can also see notifications about Google Chrome that GlassWire has shown so far.
In addition, you can activate GlassWire's firewall by clicking "Firewall On" on "Firewall" screen.
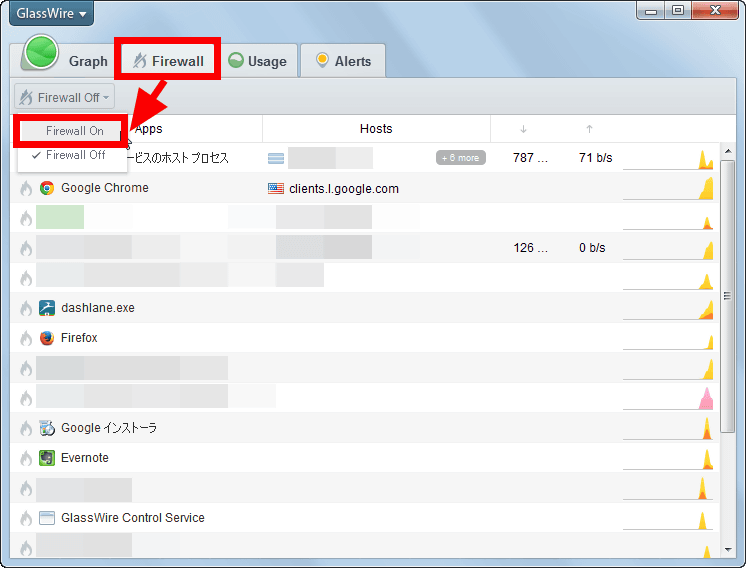
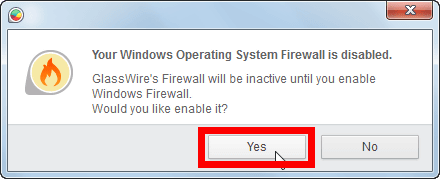
Because GlassWire's firewall can not be launched simultaneously with the firewall that is standard on Windows, if you click "Yes", the Windows firewall will be invalidated.
When activating the firewall, click the flame icon.
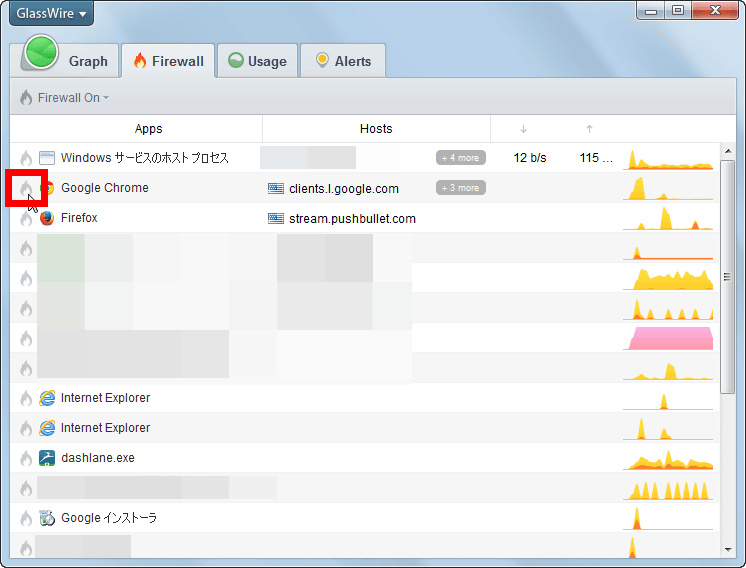
When the flame icon is colored ......

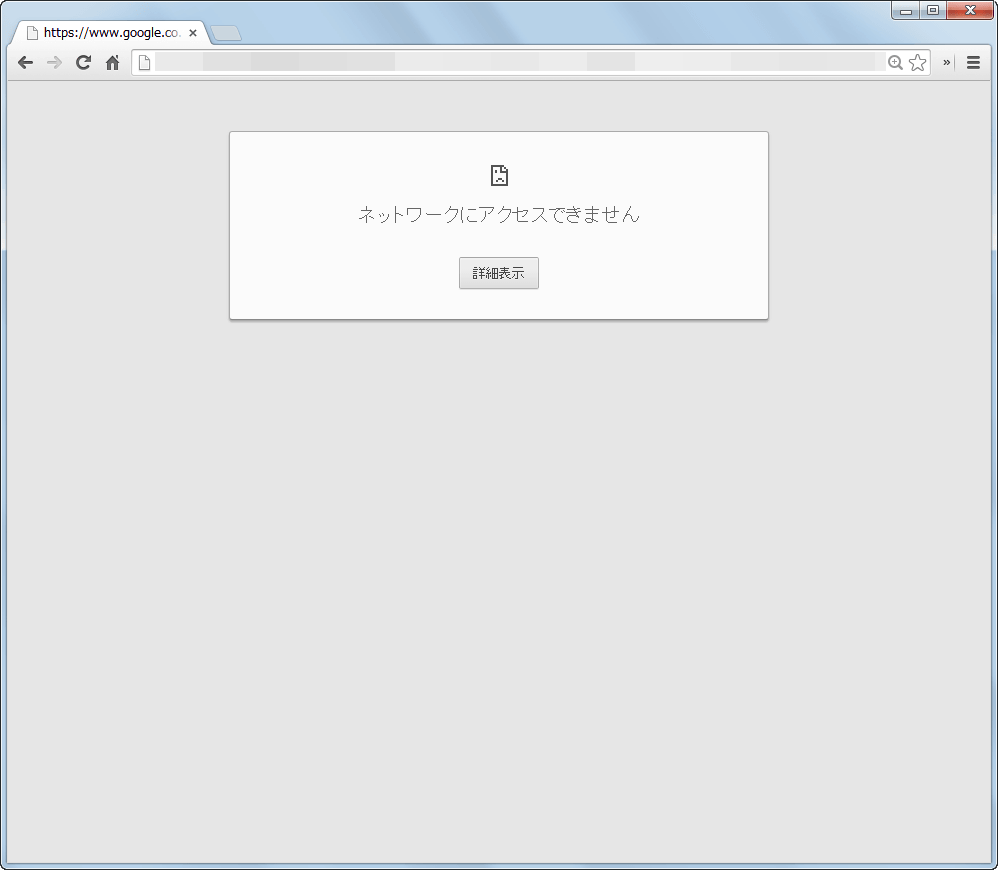
The application can not connect to the network.
At the moment GlassWire is offering all functions free of charge, but in the future it is also considering adding paid features.
· 2014/12/27 11:58 postscript
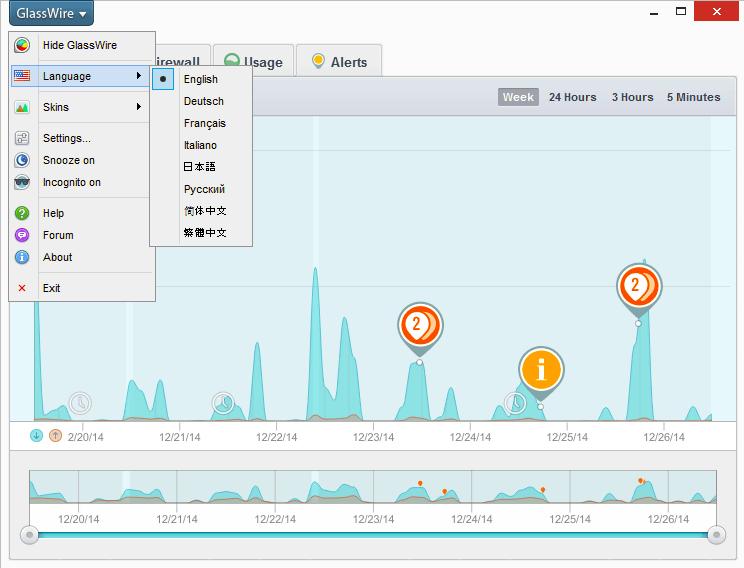
It corresponds to Japanese display from the latest version.
Related Posts: