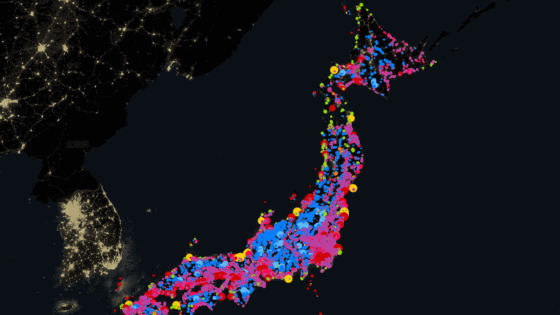
Map showing the distribution of energy sources in the USA
It shows what energy on the map is on the map, such as petroleum, natural gas, nuclear power and so on. For example, nuclear power plants are less on the west coast and where the petroleum is located, and more at a glance.
Details are as follows.
MSNBC ENERGY map of AMERICA
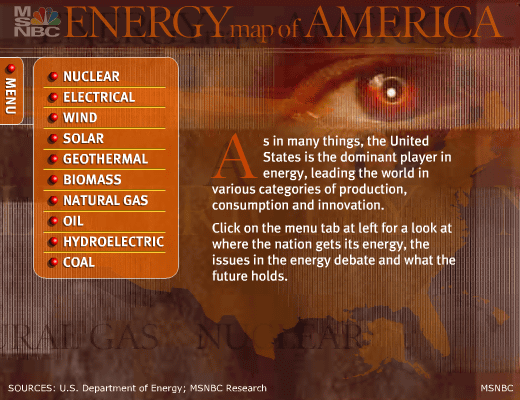
Items include nuclear power, electricity (electricity grid), wind power, sunlight, geothermal power, biomass, natural gas, oil, hydropower, coal from the top.
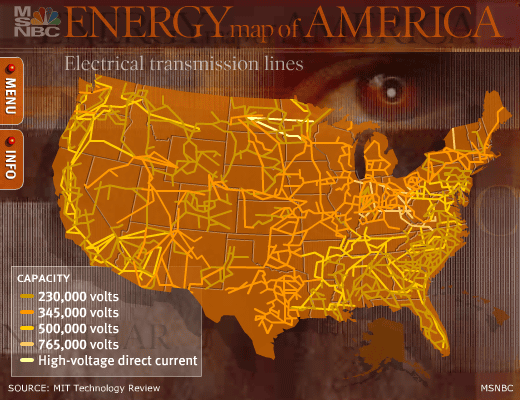
An electric grid in the USA. The total extension is likely to be 157,810 miles (about 250,000 km).
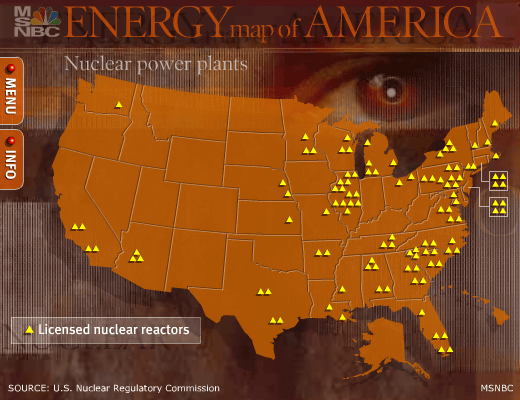
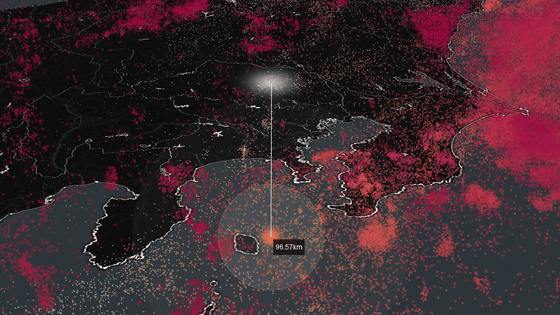
Distribution of nuclear power plants. On the west coast there are only counts, mostly on the east coast.
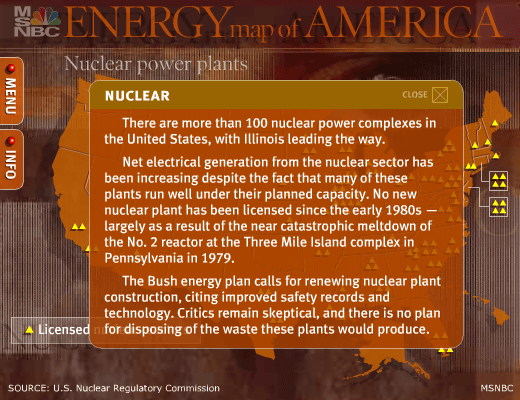
On the "INFO" tab, you can read the description about that item.
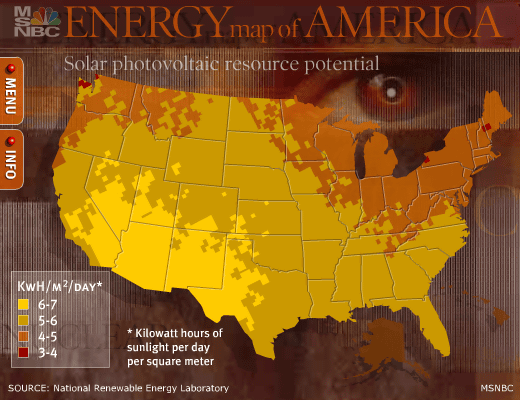
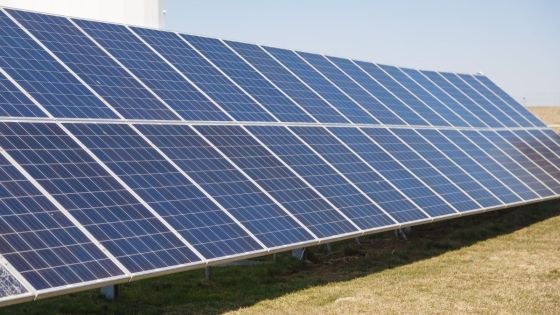
Sun light. How many kWh of electricity can be generated per square meter a day?
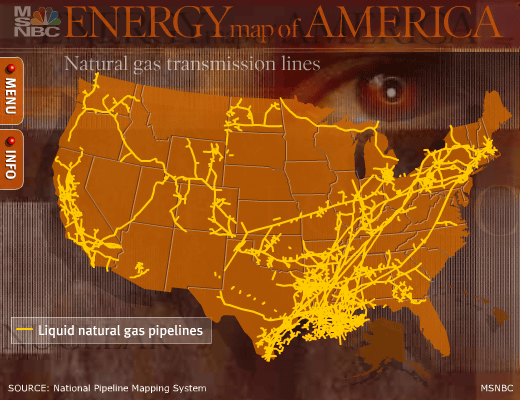
Natural gas pipeline. The Caribbean coast is particularly dense.
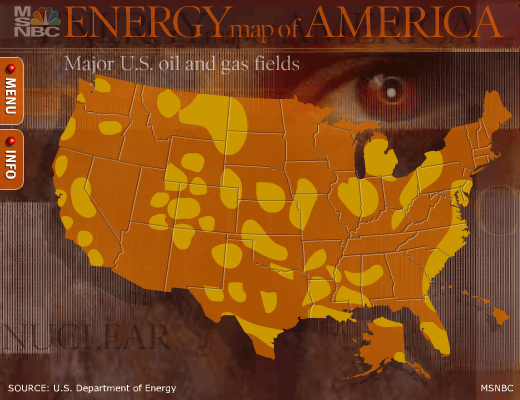
Oilfields and gas fields. It is dotted in various places.
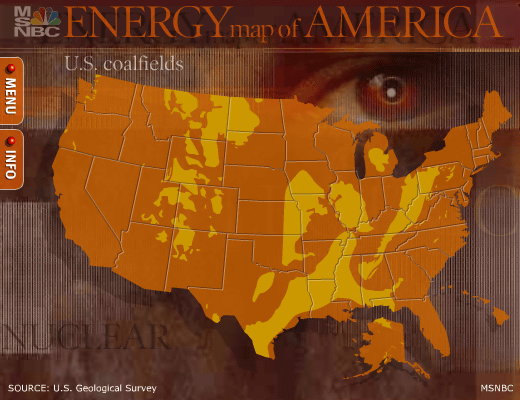
Coal distribution. It is clustered in strips.
Related Posts:


in Note, Posted by logc_nt